0128
Monitoring glucose uptake and metabolism in human kidney with dynamic 3D DMI at 7 T1Department of Radiology, University Medical Center Utrecht, Utrecht, Netherlands
Synopsis
Kidneys play a crucial role in glucose homeostasis via glucose reabsorption and glucose release into and glucose uptake from the circulation. We investigated the feasibility of measuring renal glucose uptake and metabolism with dynamic 3D DMI. A volunteer was scanned twice with two different ways of deuterated glucose administration: in the scanner and before scanning session. Similar glucose uptake was observed in the kidney and liver. We demonstrated the feasibility of measuring renal glucose uptake and metabolism with dynamic 3D DMI. This technique has potential to study the role of renal glucose uptake in glucose homeostasis in diabetes.
Introduction
Kidneys play a crucial role in glucose homeostasis via glucose reabsorption from the renal glomerular filtrate, and glucose release into and glucose uptake from the circulation. In the post-absorptive state, the kidneys are responsible for 20-25% of glucose release and ~10% of glucose uptake, and both contributions increase after meal ingestion1. In type 2 diabetes, both renal glucose release and renal glucose uptake are significantly elevated, in post-absorptive as well as post-prandial conditions2,3. The excessive renal glucose uptake in diabetes patients has been linked to the development of diabetic nephropathy and the accumulation of glycogen in diabetic kidneys. Therefore, its measurement is very relevant. However, because renal blood flow is high, arterial-renal venous difference measurements of renal glucose uptake are challenging.Here we investigated the feasibility of measuring renal glucose uptake and metabolism with dynamic deuterium metabolic imaging (DMI)4 using a 4-channel deuterium body array at 7T. In addition, we compared renal glucose uptake and metabolism with hepatic glucose uptake and metabolism obtained from the same DMI scans.
Methods
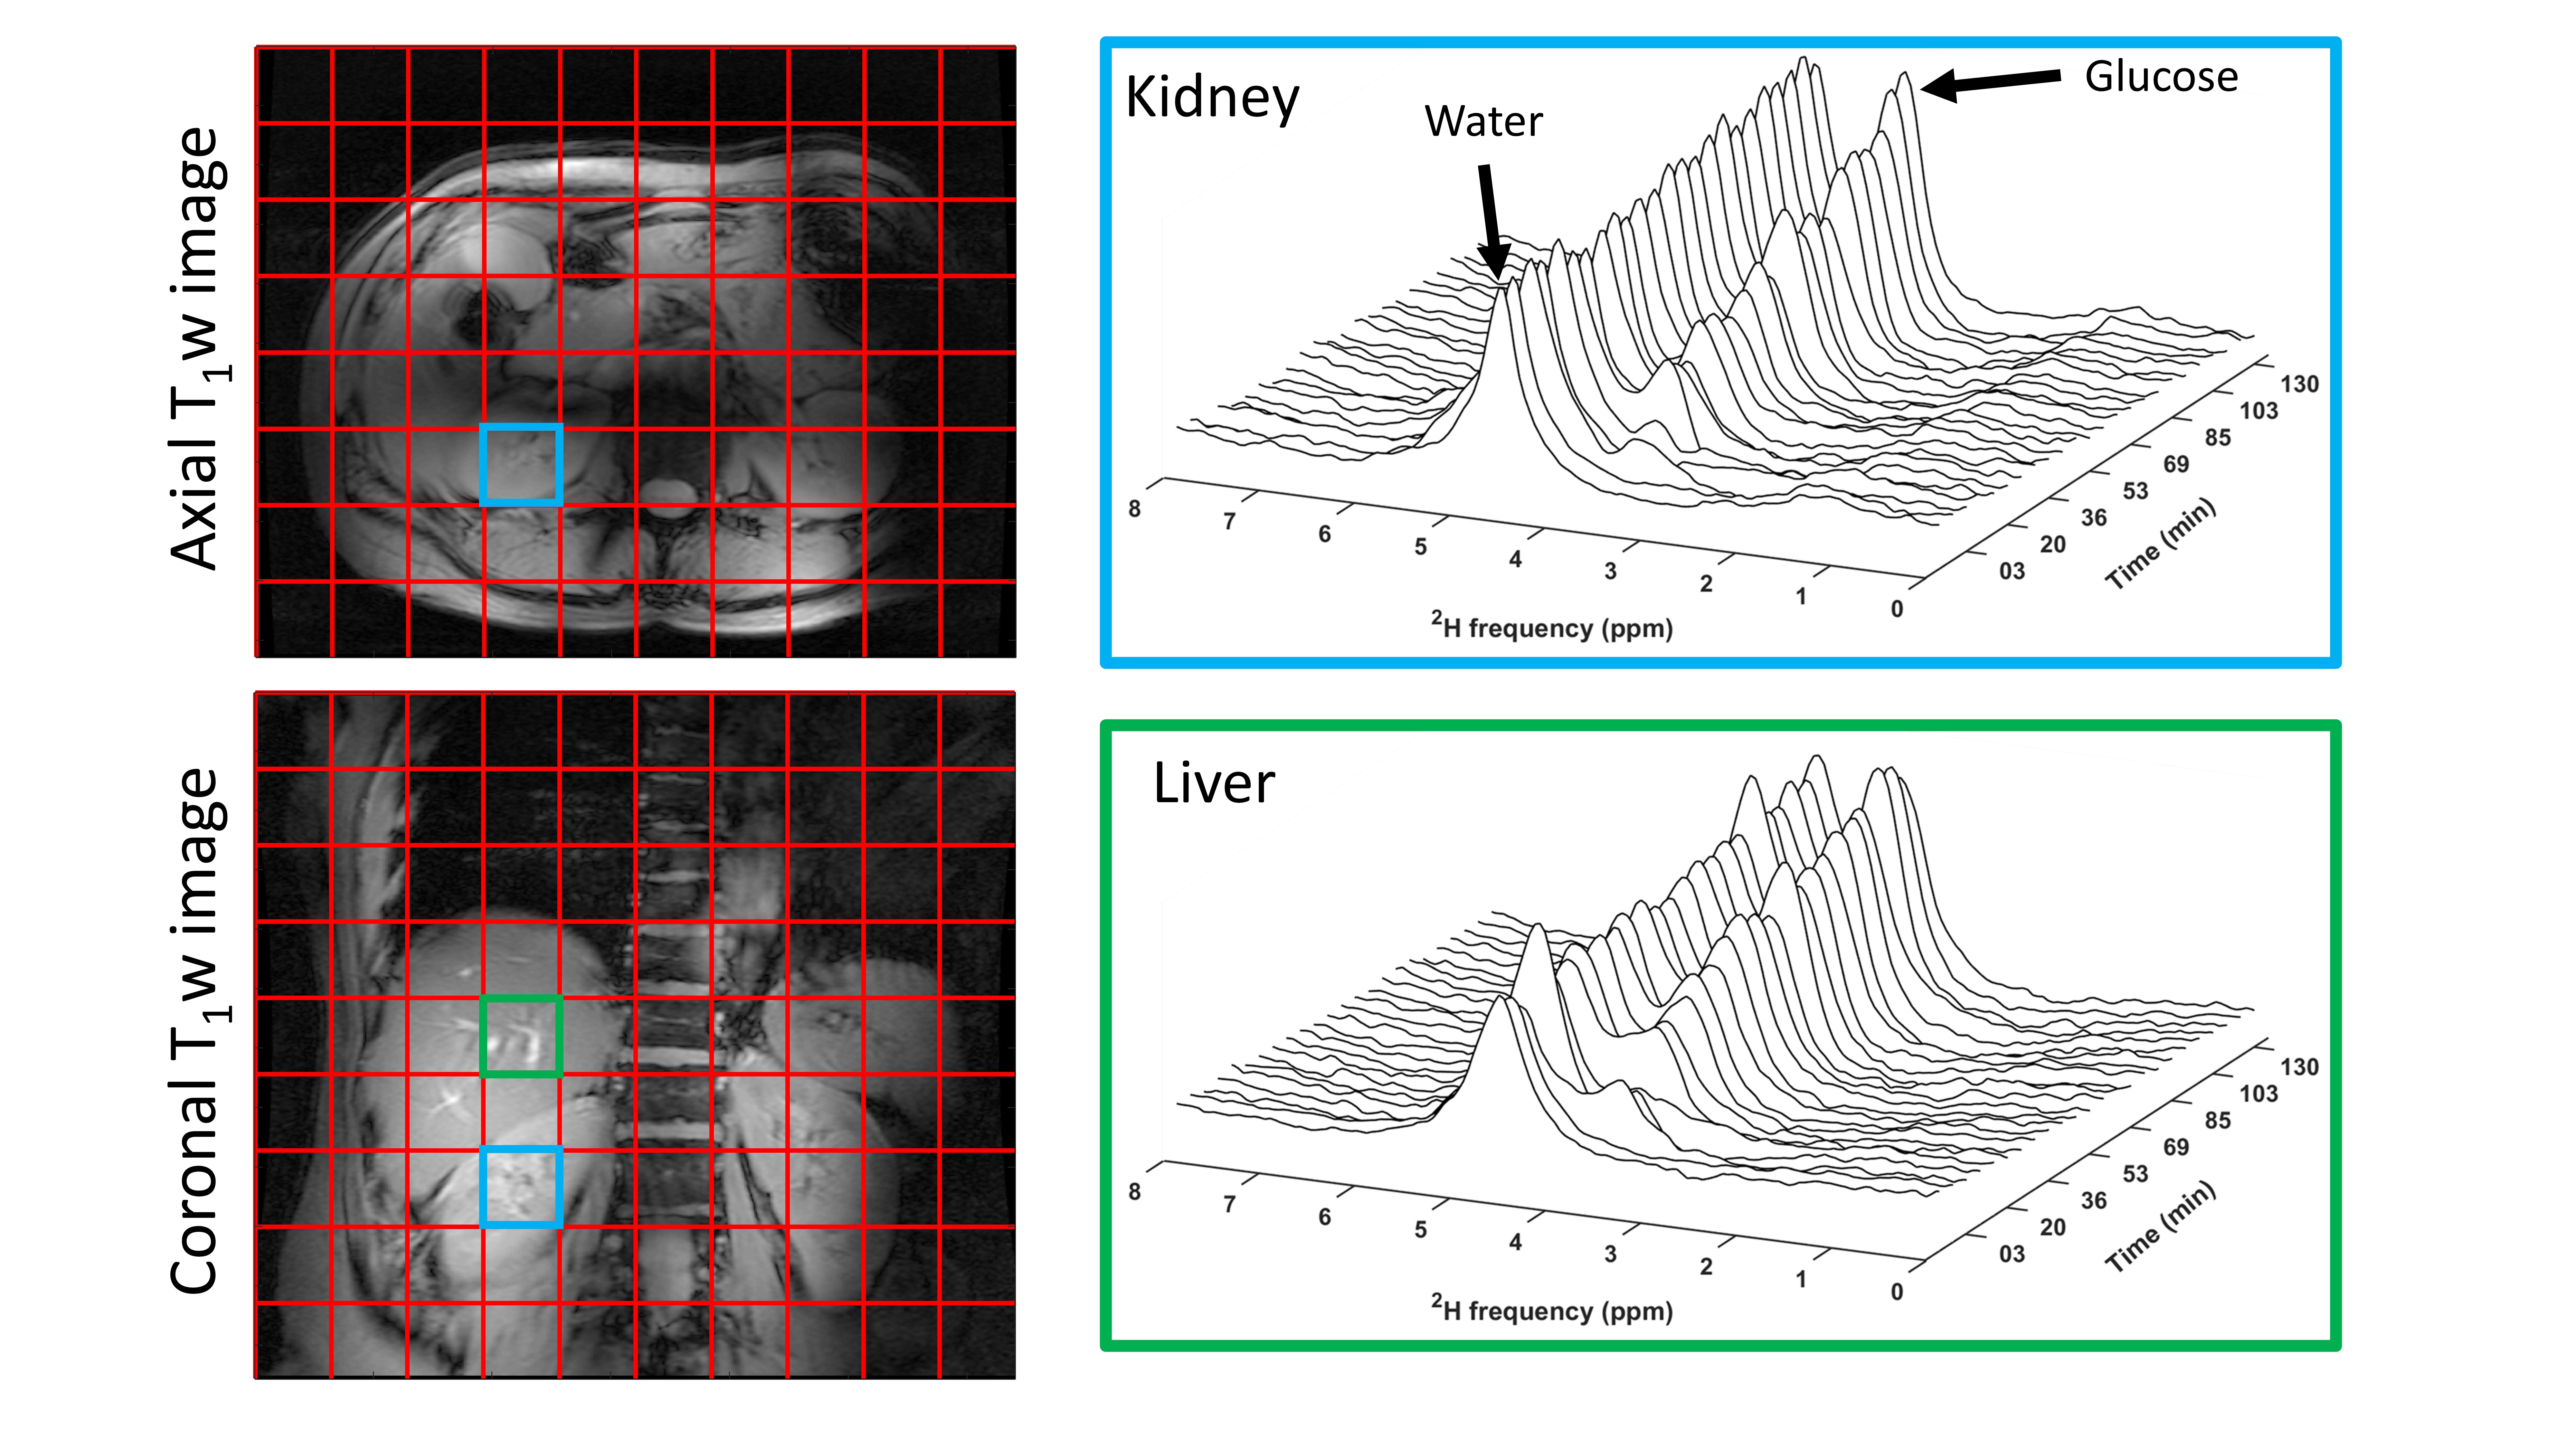
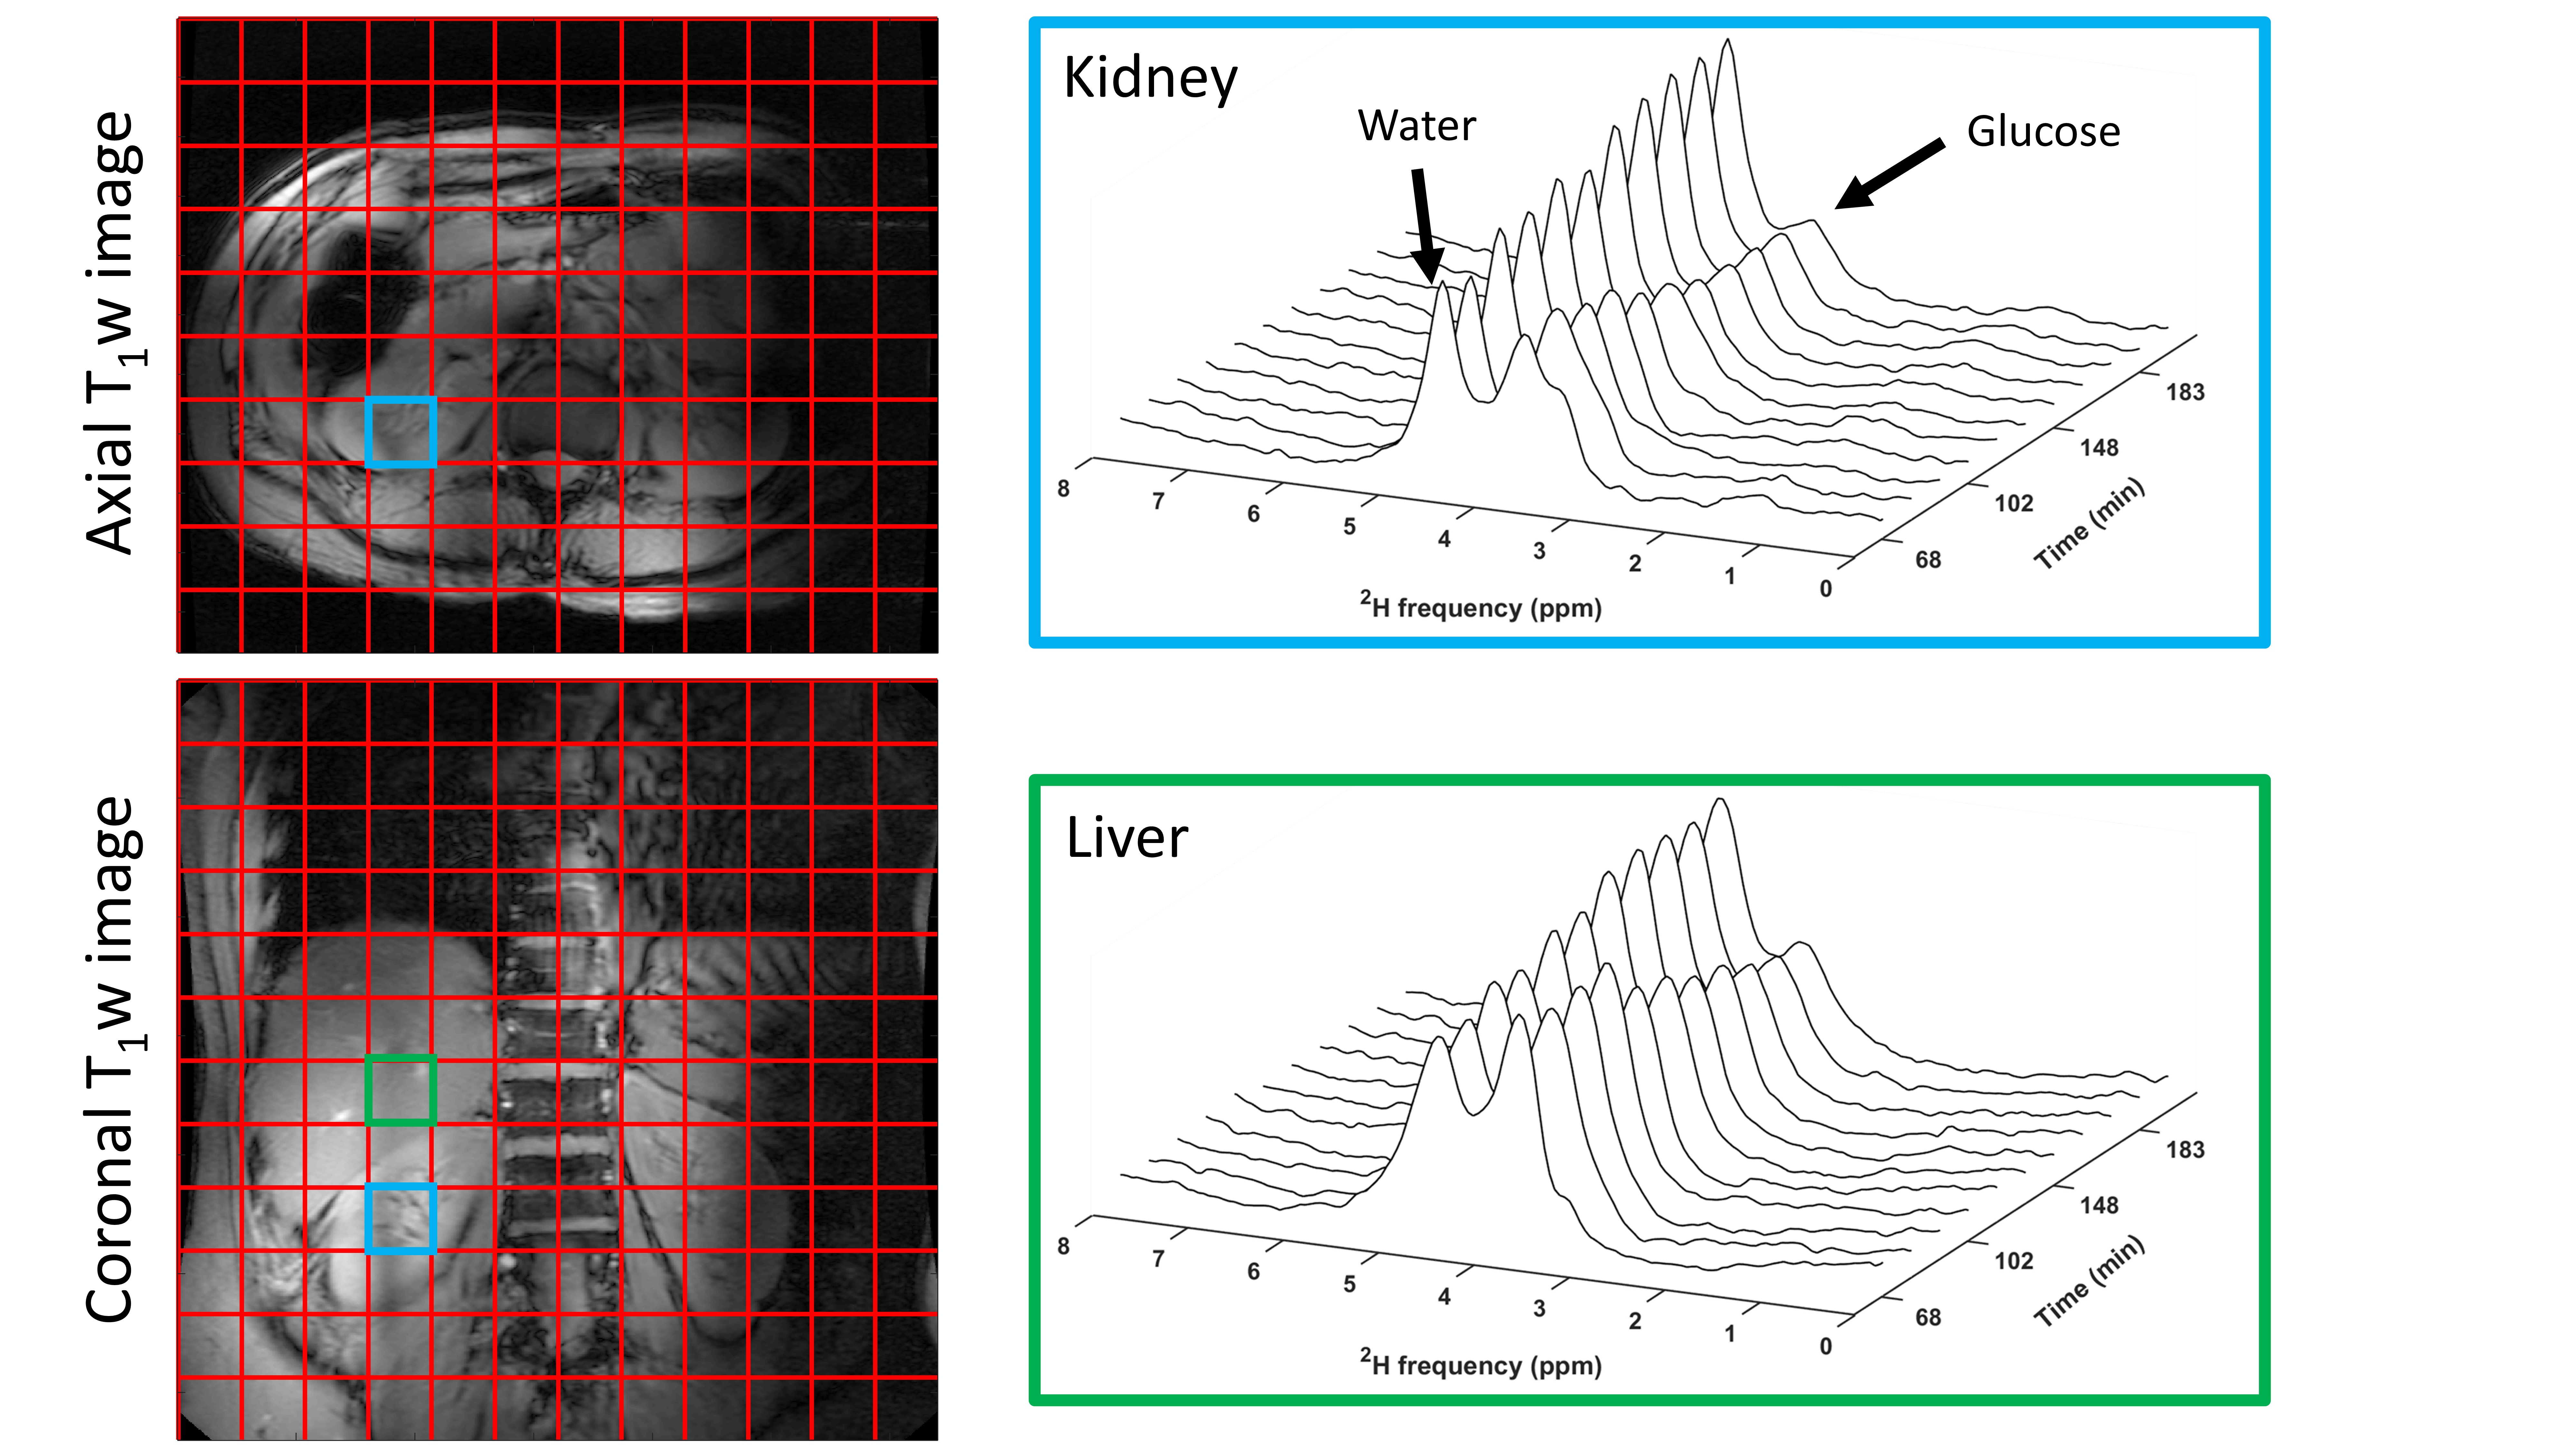
DMI measurements were performed at a 7T whole-body MRI system (Philips Healthcare, Best, Netherlands), using a body array consisting of 4 2H transmit/receive loop coils combined with 4 1H transmit/receive dipole antennas. Image-based B0 shimming and acquisition of coronal and axial T1w reference images for DMI planning were performed with the 1H antennas. All DMI measurements were performed with a pulse-acquire sequence using a 1 ms block pulse, followed by phase encoding gradients for 3D spatial encoding, using TE/TR=1.95/333 ms. DMI acquisitions were made using a Hamming-weighted k-space acquisition pattern with 4 averages in the center of k-space. No respiratory gating was applied.One healthy volunteer was scanned twice, about 3 months apart, after an overnight fast. [6,6’-2H2] glucose (0.75g per kg body weight) was dissolved in 200-300 ml water and administered orally. During the first session, the deuterated glucose was administered while the volunteer was in the scanner, after two baseline DMI scans, and DMI scans were then continued up to 130 min after glucose intake. DMI parameters: voxel size 30x30x30 mm3, matrix size 8(AP)x10(LR)x9(FH), temporal resolution 5:08 min. During the second session, the deuterated glucose was administered 30 min before the volunteer went into the scanner. The first DMI experiment was acquired 68 min after glucose intake and scans were continued up to 205 min after intake. DMI parameters: voxel size 25x25x25 mm3, matrix size 10(AP)x12(LR)x12(FH), temporal resolution 10:35 min.
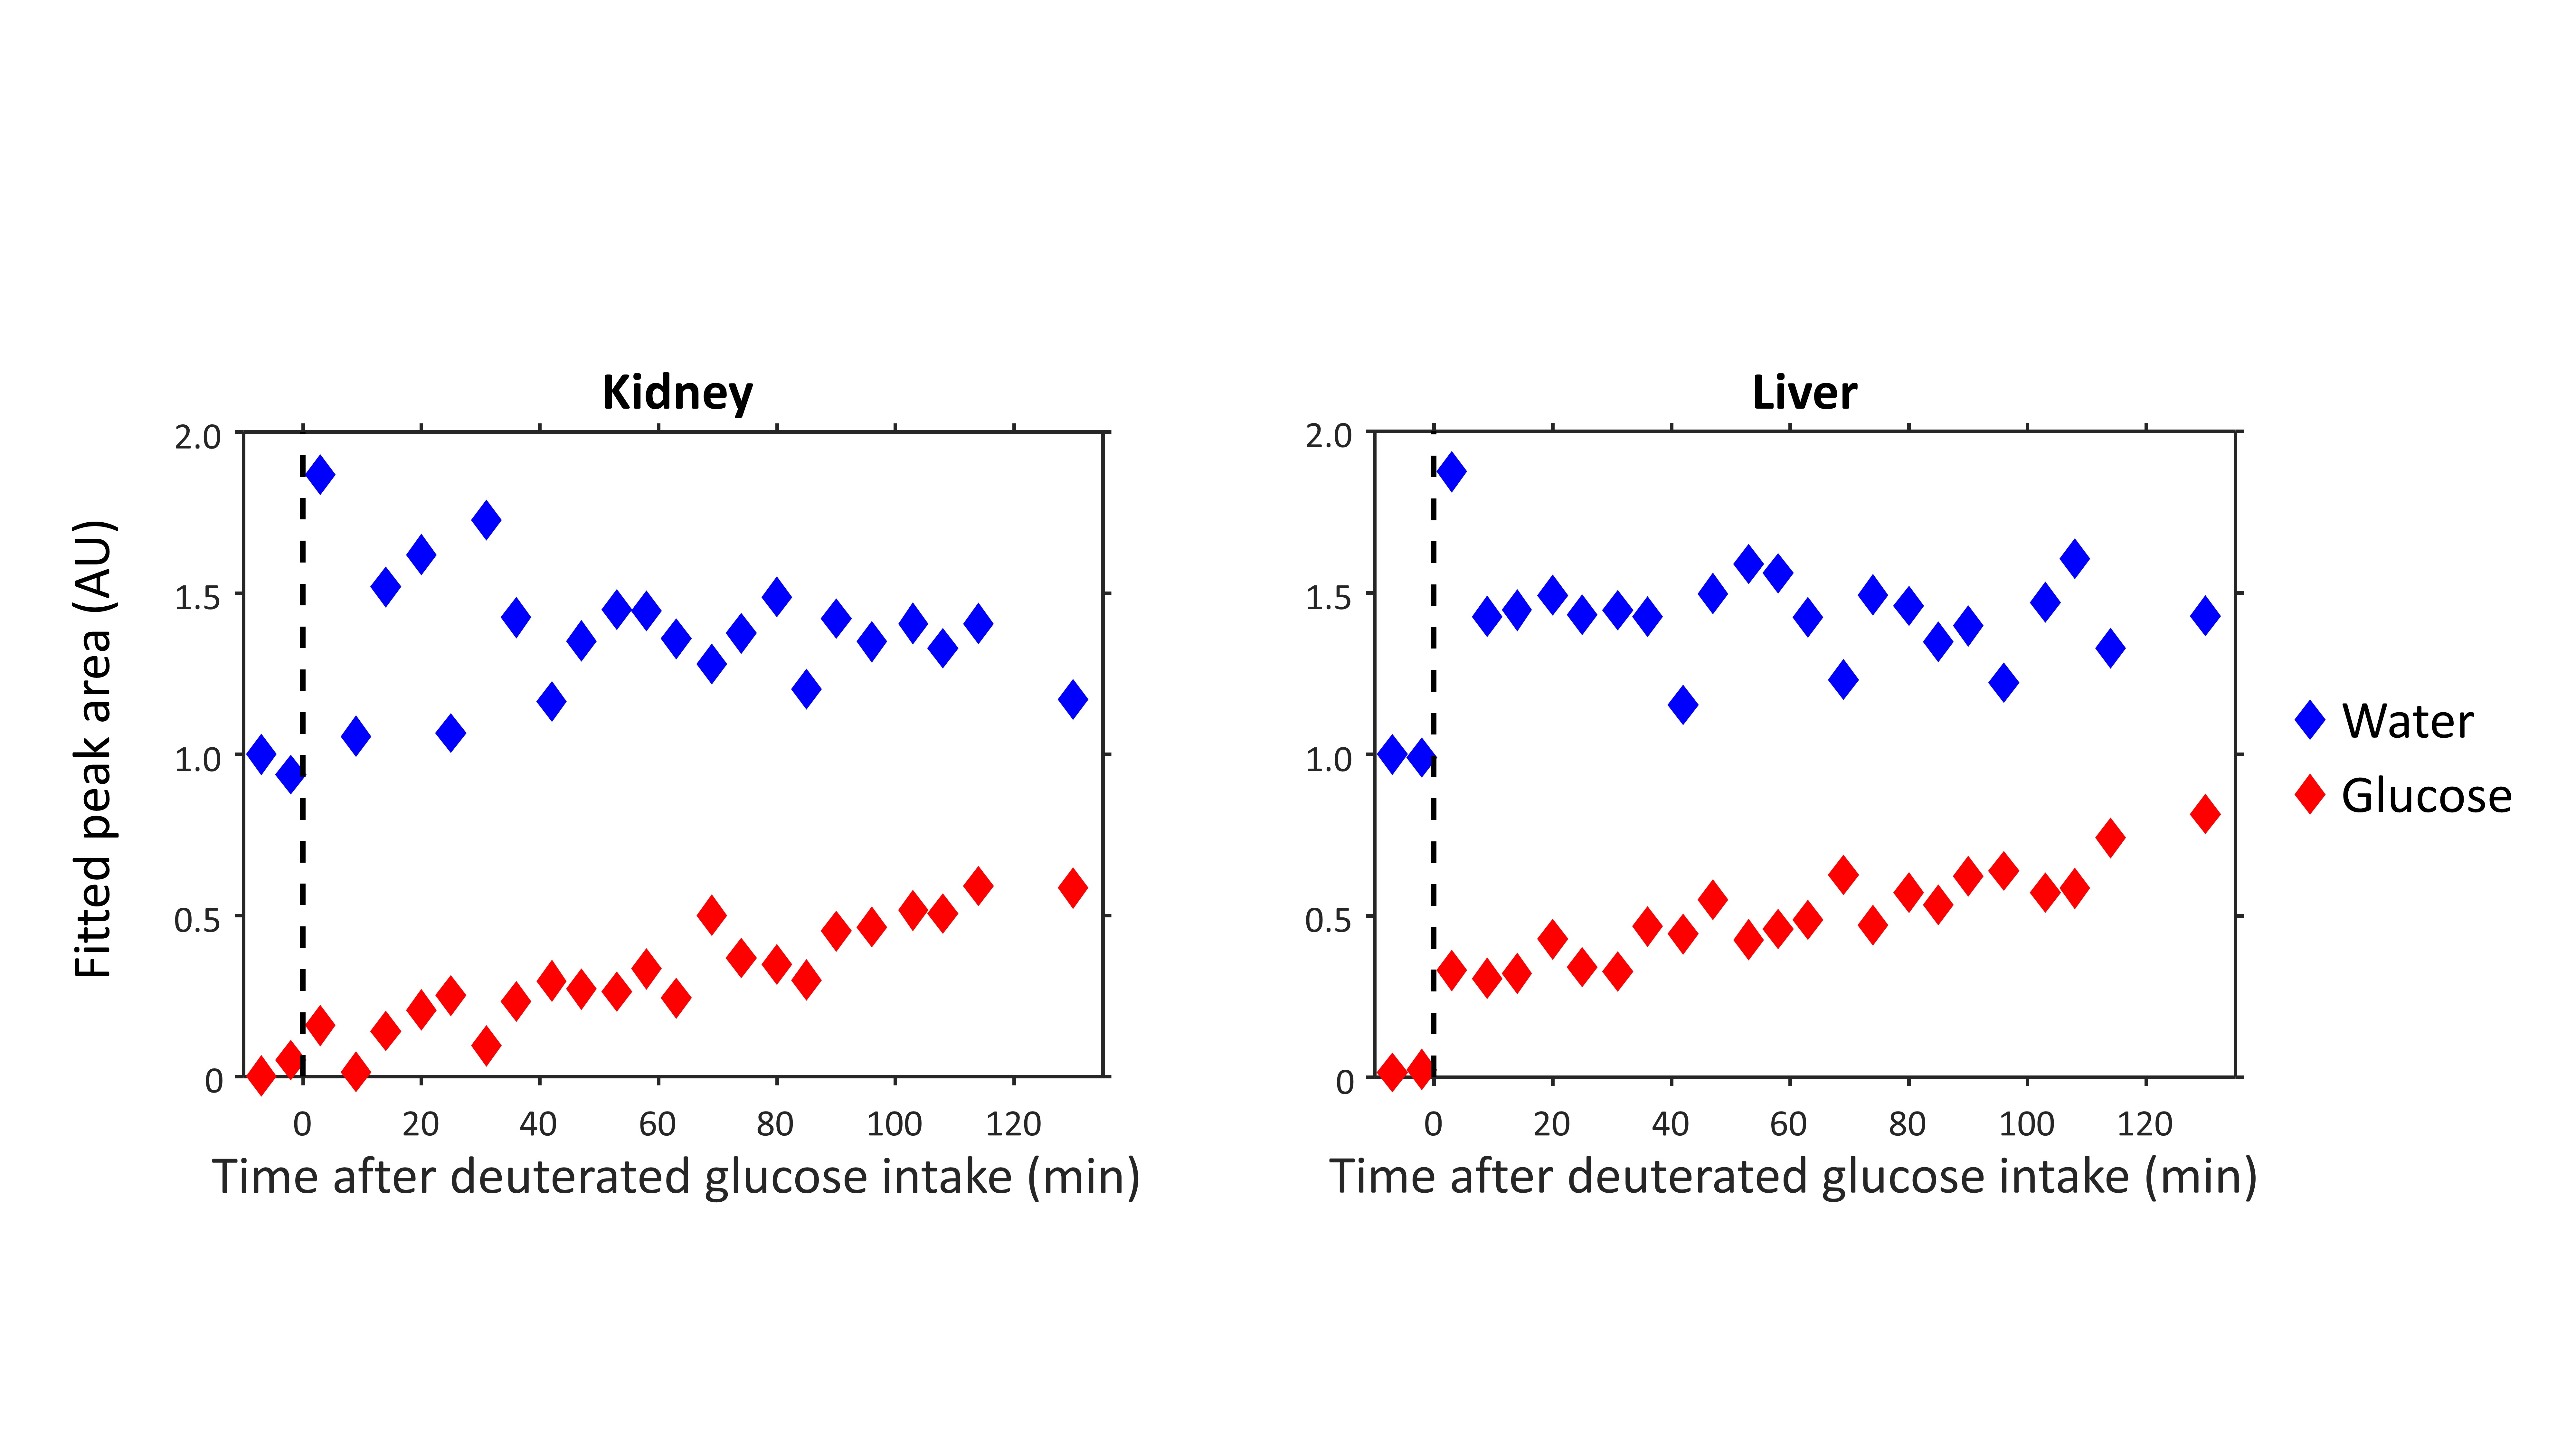
Reconstruction and processing of the raw DMI data was performed with an in-house written MATLAB script (MathWorks, Natick, MA, USA). Channel combination was performed using the Roemer equal noise algorithm5. For each voxel, water (4.7 ppm), glucose (3.8 ppm) and lipid (1.3 ppm) signals were fitted using AMARES6. Fitted water and glucose amplitudes were normalized to the water amplitude of the first time point. Axial T1w images were used to draw ROI’s for the liver in both datasets and quantitative values were averaged within these ROI’s to report a single value for the liver.
Results
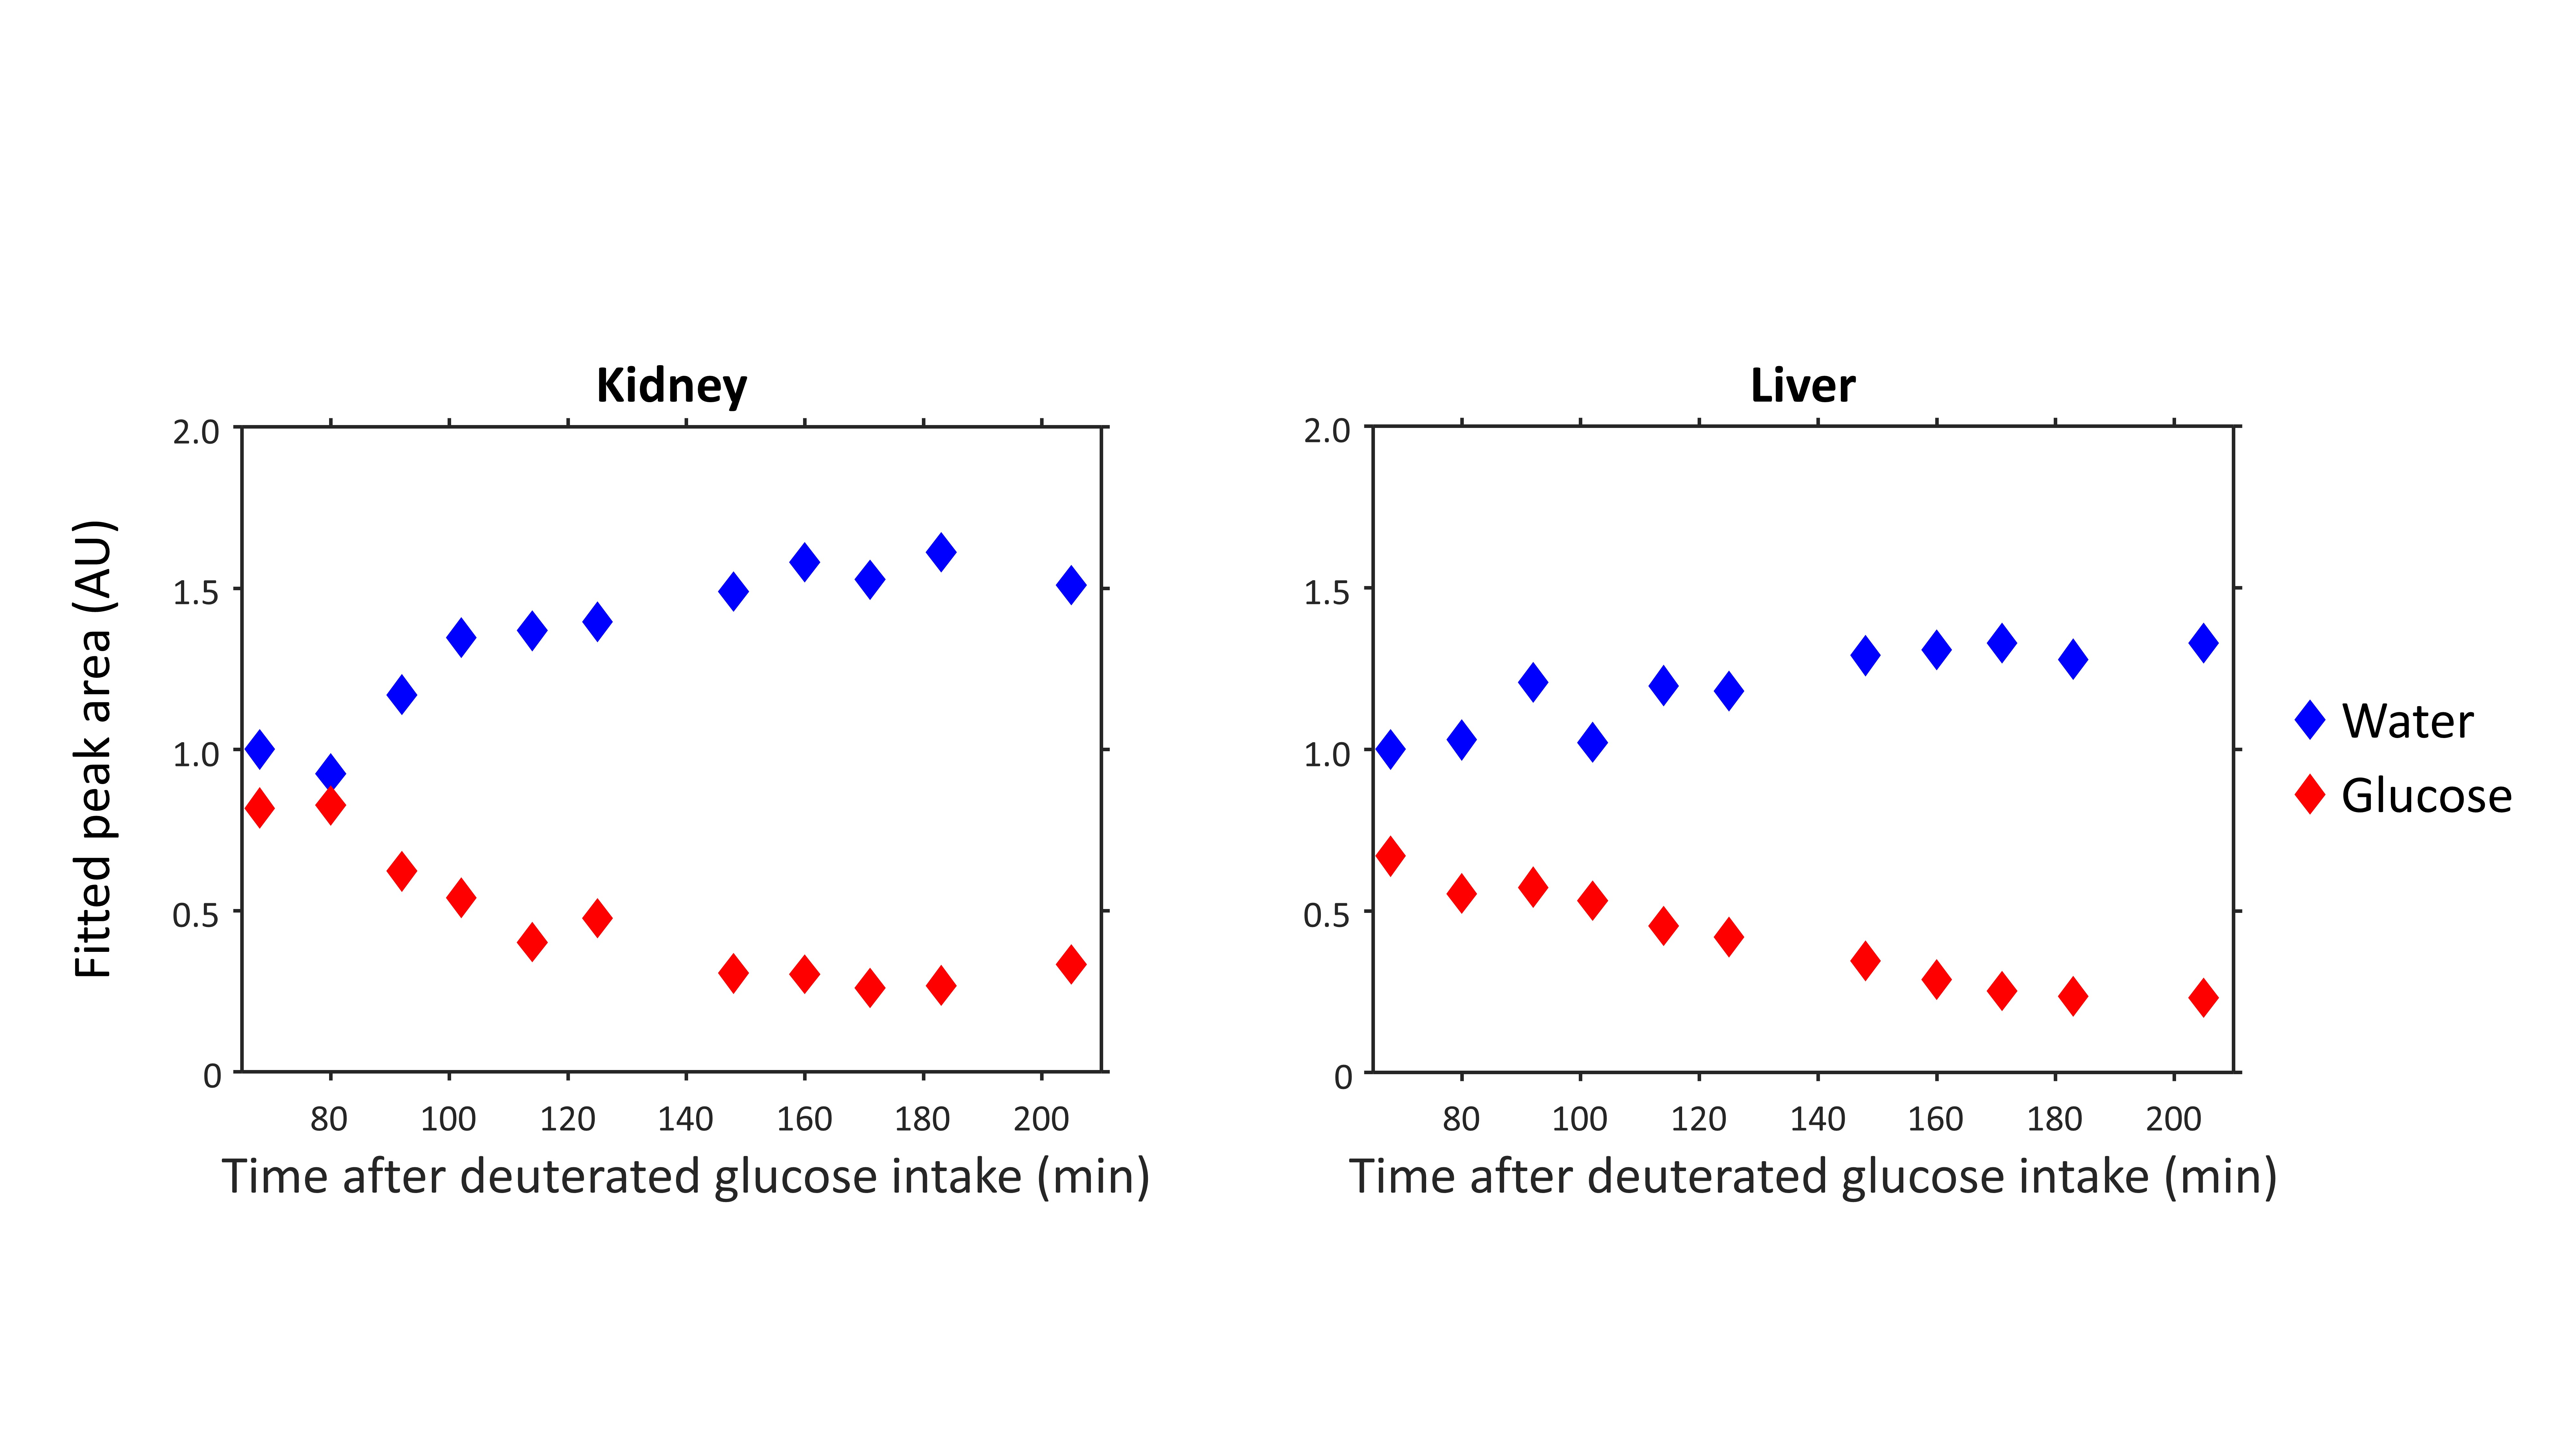
Figure 1 compares dynamic DMI data from baseline up to 130 min after deuterated glucose intake for a voxel in the right kidney and a voxel in the liver, showing similar increases in deuterated glucose and, to a lower extent, water signals in both kidney and liver. Figure 2 shows a similar comparison for the dataset obtained from 68 until 205 min after glucose intake, which had a higher spatial resolution. Here, the deuterated glucose signal gradually decays in both kidney and liver, while the deuterated water signal keeps increasing. In both datasets, the linewidths of water and glucose signals were smaller in the kidney as compared with the liver (22±6 vs 31±7 Hz for water and 22±9 vs 28±9 Hz for glucose). Figures 3 and 4 show fitted water and glucose amplitudes as a function of time in the kidney and liver (averaged over an ROI) for the two datasets. Directly after glucose administration (Fig. 3), the kinetics of glucose increase in the kidney is very similar to that in the liver. However, in the second dataset measured 68-205 min after glucose intake (Fig. 4), the decrease in glucose signal and rise in water signal seem faster in the kidney compared to the liver.Discussion and Conclusion
Using dynamic 3D DMI with a deuterium body array coil, we showed that glucose uptake was very similar in the kidney and liver. However, the dynamics of deuterated glucose disappearance as well as the deuterium labeling of water seemed faster in the kidney. As healthy kidneys contain negligible amounts of glycogen1,3, the disappearance of the deuterated glucose signal in the kidney cannot be explained by the conversion of glucose into glycogen, as is likely the case in the liver. However, we did not observe any deuterated products of anaerobic glycolysis (lactate) or oxidative glucose metabolism (glutamate).In conclusion, we demonstrated the feasibility of measuring renal glucose uptake and metabolism with dynamic 3D DMI. This technique has potential to study the role of renal glucose uptake in glucose homeostasis in diabetes and the development of diabetic nephropathy.
Acknowledgements
This work was funded by a HTSM grant from NWO TTW (project number 17134) and by a FET Innovation Launchpad grant from the EU (grant number 850488).References
1.Alsahli M, Gerich JE. Renal glucose metabolism in normal physiological conditions and in diabetes. Diabetes Res Clin Pract. 2017;133:1-9. doi:10.1016/j.diabres.2017.07.033
2.Meyer C, Stumvoll M, Nadkarni V, Dostou J, Mitrakou A, Gerich J. Abnormal renal and hepatic glucose metabolism in type 2 diabetes mellitus. J Clin Invest. 1998;102(3):619-624. doi:10.1172/JCI2415
3.Meyer C, Woerle HJ, Dostou JM, Welle SL, Gerich JE. Abnormal renal, hepatic, and muscle glucose metabolism following glucose ingestion in type 2 diabetes. Am J Physiol - Endocrinol Metab. 2004;287(6 50-6):1049-1056. doi:10.1152/ajpendo.00041.2004
4.De Feyter HM, Behar KL, Corbin ZA, et al. Deuterium metabolic imaging (DMI) for MRI-based 3D mapping of metabolism in vivo. Sci Adv. 2018;4(8):1-12. doi:10.1126/sciadv.aat7314
5.Roemer PB, Edelstein WA, Hayes CE, Souza SP, Mueller OM. The NMR phased array. Magn Reson Med. 1990;16(2):192-225. doi:10.1002/mrm.1910160203
6.Vanhamme L, Van Den Boogaart A, Van Huffel S. Improved Method for Accurate and Efficient Quantification of MRS Data with Use of Prior Knowledge. J Magn Reson. 1997;129(1):35-43. doi:10.1006/jmre.1997.1244
Figures