0126
Predicting radionecrosis and recurrent disease through Amide Proton Transfer weighted imaging in brain metastases1Department of Neuroradiology, Assistance Publique-Hôpitaux de Paris, Groupe Hospitalier Pitié-Salpêtrière-Charles-Foix, Sorbonne Université, Paris, Paris, France, 2Paris Brain Institute – Institute du Cerveau (ICM), Centre de NeuroImagerie de Recherche (CENIR), F-75013, Paris, France, 3Department of Radiation-Oncology, Assistance Publique-Hôpitaux de Paris, Groupe Hospitalier Pitié-Salpêtrière-Charles-Foix, Sorbonne Université, Paris, France, 4Siemens Healthcare SAS, Saint-Denis, Paris, France, 5Department of Research & Innovation, Olea Medical, La Ciotat, France
Synopsis
Distinguishing tumor recurrence from radionecrotic injury of pre-irradiated brain metastases is fundamental to provide optimal patient care. Unfortunately, this distinction is often hard to make even with advanced MRI multimodal protocols. This study aims to evaluate APTw imaging in predicting the differentiation between radio-induced tissue changes from tumor progression at 3T in 20 pre-irradiated metastases. Results show that APTw metrics can significantly separate these two common radiological entities (p<0.0001) and suggest the use of fluid-suppressed APTw to reach higher discriminating values.
Introduction
Stereotactic body radiation-therapy (SBRT) is one of the first-line treatment option for brain metastases, a very common pathological entity1,2. After SBRT, the differentiation between tumor progression and radionecrosis in evolving lesions is essential to guide subsequent patient management. However, disentangling between these two phenomena is impossible with visual evaluation of conventional imaging and requires complementary advanced techniques that include brain perfusion3. Sometimes this multimodal protocol is still insufficient because of intrinsic limitations of the available sequences4. Amide Proton Transfer weighted (APTw) imaging is a molecular technique that can measure the chemical exchange saturation transfer (CEST) endogenous contrast between mobile protein/peptide amide protons and bulk water5,6. One of the potential clinical applications of APTw imaging is the assessment of response to treatment, with the hypothesis that tumor hypercellularity leads to an increase in APTw signal intensity compared with lower cellular density of therapeutic remnants7,8,9. The aim of this study is to evaluate the ability of APTw imaging in the noninvasive distinction between tumor metastasis recurrence and radiation-related tissue changes at 3 Tesla (T).Methods
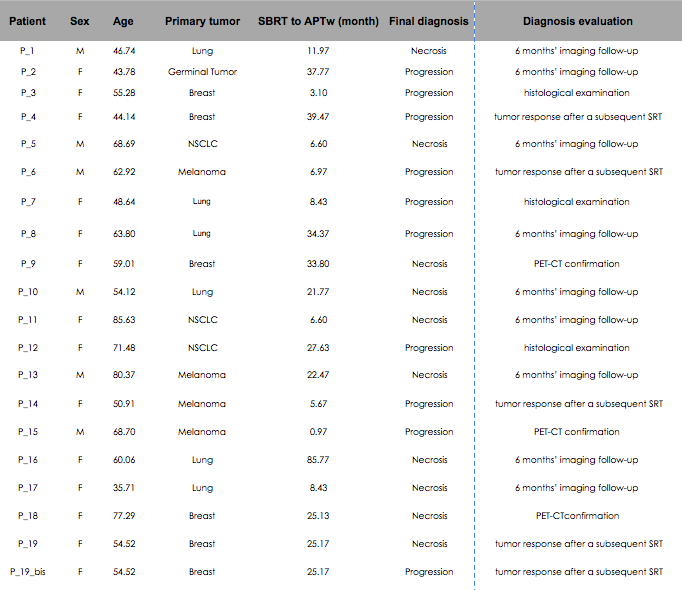
Patient population:Nineteen subjects (14 females, 59.31 ±13 years old, 22 ±19months from SBRT) were prospectively recruited with the inclusion criteria of an enlarging lesion after focal single dose of Gamma-Knife SRT for brain metastasis (see Figure1). One patient (P_19 bis) had two distant lesions that respected the inclusion criteria, therefore leading to a total of twenty lesions. Diagnosis of tumor progression or radionecrosis was assessed by either (i) histological examination or (ii) 6 months’ imaging follow-up or (iii) CT-PET confirmation (iv) tumor response after a subsequent SRT.
MRI study:
All acquisitions were performed at 3 T (MAGNETOM Skyra, Siemens, Erlangen, Germany) equipped with a 64-channel head and neck coil. The APTw sequences (WIP816B, 3:07 minutes) were acquired with a 3D snapshot-GRE5 (FOV=220×181 mm2; matrix=128×105; voxel size=2×2×5 mm3; 12 slices; GRAPPA acceleration factor=2; TE =2.00 ms; TR =4.5 ms; bandwidth=700 Hz/pixel; flip angle =6°). The average of radiofrequency (RF) amplitude, B1 value, was equal to 2.22 μT. The RF saturation consisted of 20 Gaussian pulses with duration/interpulse delay= 50/40ms (55% Duty Cycle), one off-resonance (300ppm) pre-saturation M0 volume and 25 APTw M(∆ωi) volumes with equally-spaced relative offsets ∆ωi (from -6ppm to 6ppm) from water frequency. WASAB1 sequence10 (WIP816B, 2:03 minutes) was performed for simultaneous B0 and B1 mapping. Structural axial 3D FLAIR, axial diffusion, susceptibility imaging, DSC perfusion and axial 3D T1 spin echo sequence before and after contrast injection were acquired.
Data Analysis:
Olea Sphere 3.0 software (Olea Medical, La Ciotat, France) was used to denoise APTw data, normalize them to M0, for B0 correction and to compute APTw and Fluid-Suppressed APTw map by sampling around amide relative resonance frequency as in11. It was also used to co-register APTw maps with structural sequences and to delineate regions of interest (ROIs). Lesion ROIs were drawn on APTw maps co-registered with 3D-FLAIR. Symmetrical ROIs of identical size were delineated in the contralateral normal appearing white matter (cNAWM). The average values of APTw metrics that were calculated for each voxel in the lesion ROI and in the cNAWM were used in the statistical analysis.
Statistical analysis:
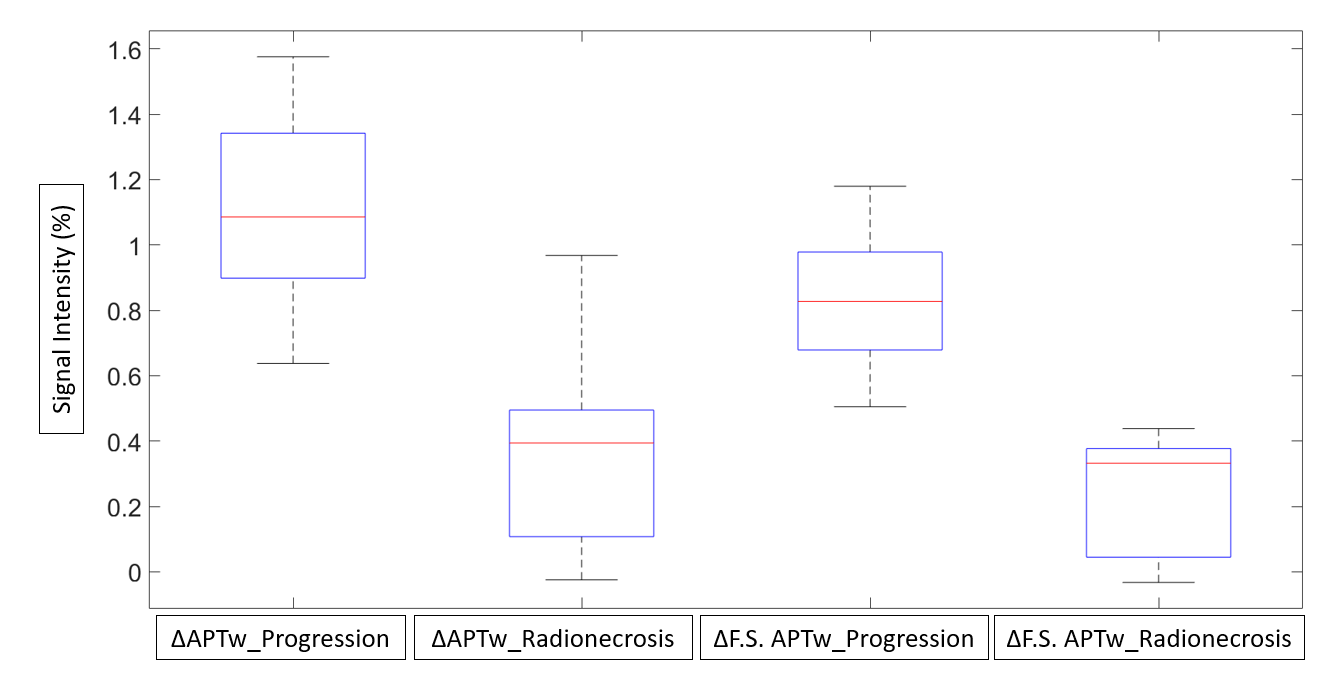
An independent Student’s t-test was performed between the two different groups (tumor progression vs radionecrosis), on the difference between the average APTw computed on the ROI in lesion normalized by subtracting the average APTw signal intensity computed on the ROI in cNAWM (ΔAPTw= APTw_lesion-APTw_cNAWM). Another independent Student’s t-test was done for the same groups after fluid-suppression (ΔF.S.APTw= F.S APTw_lesion-F.S. APTw_cNAWM). p<0.05 was set at statistically significant. MATLAB was used for this analysis.
Results and discussion
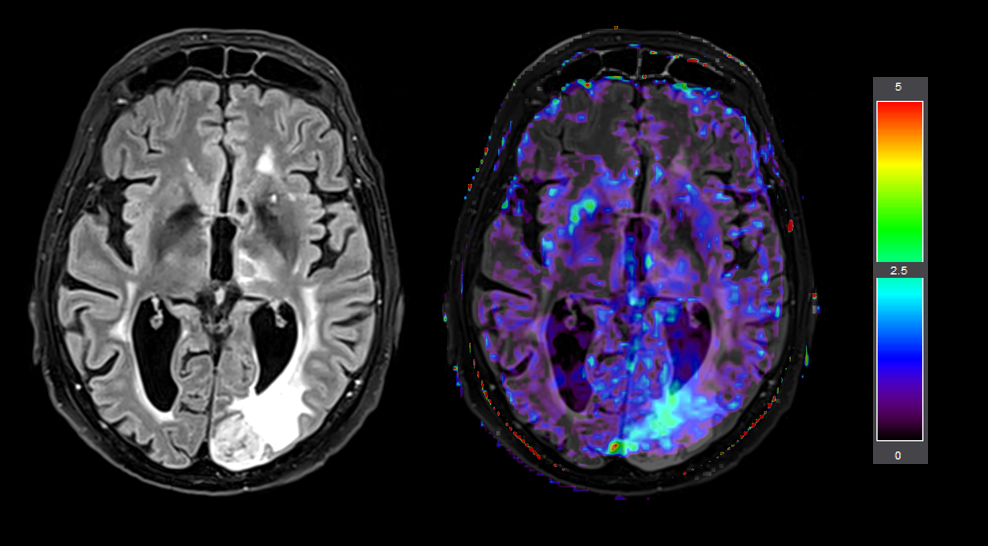
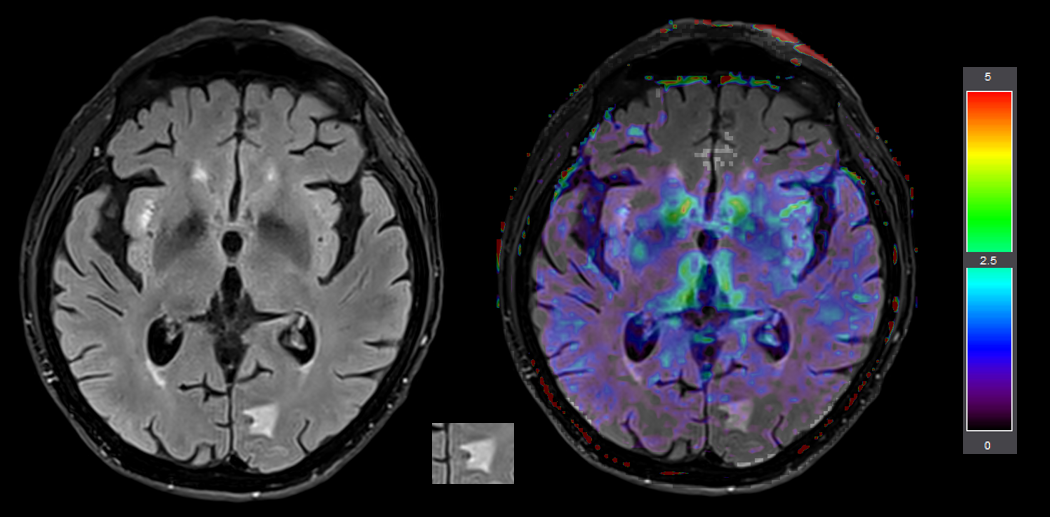
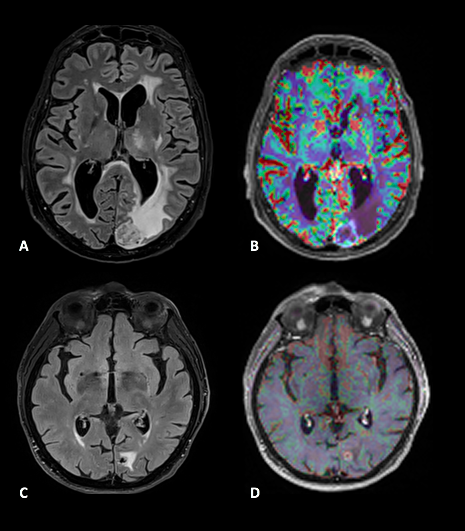
Among twenty patient’s lesions, ten lesions were consistent with radionecrosis and ten with tumor progression based on the aforementioned criteria (see details provided in Figure1). The mean ΔAPTw and ΔF.S.APTw signal intensity (in %) of the radionecrosis group was 0.3488 ± 0.2912 and 0.2267 ± 0.189 and for the tumor progression group was 1.0934 ± 0.3288 and 0.8261 ± 0.215). Both metrics (APTw and F.S.APTw) significantly differentiate progression from radionecrosis (receptively, p< 0.00004276 and p<0.0000034404). FS.APTw showed a higher discriminating value, reflected by a lower p-value and a lower variance in both the populations after fluid suppression (see boxplots of Figure2), making the discrimination capability of the APTw more robust. This is probably due to the fact that hemosiderin signal, which is frequently encountered in previously irradiated tumor, is adequately diminished in the fluid-suppressed images. These preliminary results are in line with previous preclinical7 and clinical9 works. Figure3 shows an example of a APTw map in a tumor progressing lesion (P_12) while Figure4 (P_13) is a representative case of a APTw map in a radionecrotic lesion. Interestingly, both these two condition were not detected by dynamic susceptibility perfusion imaging (Figure5), suggesting a possible increase diagnostic accuracy of APTw metrics in comparison to brain perfusion measures in posttherapeutic settings.Conclusion
The current research suggests that APTw metrics are valuable tools in the distinction between tumor recurrence and radio-induced tissue changes in brain metastasis, and emphasizes the importance of suppressing fluid signal in APTw maps.Acknowledgements
No acknowledgement found.References
1- Suh JH, Kotecha R, Chao ST, Ahluwalia MS, Sahgal A, Chang EL. Current approaches to the management of brain metastases. Nature reviews Clinical oncology. 2020 May;17(5):279-99.
2- Valiente M, Ahluwalia MS, Boire A, Brastianos PK, Goldberg SB, Lee EQ, Le Rhun E, Preusser M, Winkler F, Soffietti R. The evolving landscape of brain metastasis. Trends in cancer. 2018 Mar 1;4(3):176-96.
3- Pope WB. Brain metastases: neuroimaging. Handbook of clinical neurology. 2018 Jan 1;149:89-112.
4- Nichelli L, Casagranda S. Current emerging MRI tools for radionecrosis and pseudoprogression diagnosis. Current Opinion in Oncology. 2021 Nov 1;33(6):597-607.
5- Deshmane A, Zaiss M, Lindig T, Herz K, Schuppert M, Gandhi C, Bender B, Ernemann U, Scheffler K. 3D gradient echo snapshot CEST MRI with low power saturation for human studies at 3T. Magnetic resonance in medicine. 2019 Apr;81(4):2412-23.
6- Wu B, Warnock G, Zaiss M, Lin C, Chen M, Zhou Z, Mu L, Nanz D, Tuura R, Delso G. An overview of CEST MRI for non-MR physicists. EJNMMI physics. 2016 Dec;3(1):1-21.
7- Zhou J, Tryggestad E, Wen Z, Lal B, Zhou T, Grossman R, Wang S, Yan K, Fu DX, Ford E, Tyler B. Differentiation between glioma and radiation necrosis using molecular magnetic resonance imaging of endogenous proteins and peptides. Nature medicine. 2011 Jan;17(1):130-4.
8- Hong X, Liu L, Wang M, Ding K, Fan Y, Ma B, Lal B, Tyler B, Mangraviti A, Wang S, Wong J. Quantitative multiparametric MRI assessment of glioma response to radiotherapy in a rat model. Neuro-oncology. 2014 Jun 1;16(6):856-67.
9- Mehrabian H, Desmond KL, Soliman H, Sahgal A, Stanisz GJ. Differentiation between radiation necrosis and tumor progression using chemical exchange saturation transfer. Clinical Cancer Research. 2017 Jul 15;23(14):3667-75.
10- Schuenke P, Windschuh J, Roeloffs V, Ladd ME, Bachert P, Zaiss M. Simultaneous mapping of water shift and B1 (WASABI)—application to field‐inhomogeneity correction of CEST MRI data. Magnetic resonance in medicine. 2017 Feb;77(2):571-80.
11- Casagranda S, Mancini L, Gautier G, Peter P, Lopez B, Brandner S, de Vita E, Golay X, Bisdas S. Fluid suppression in CEST imaging affects predominantly IDH-mutant 1p/19q retained gliomas with T2-FLAIR mismatch. In ISMRM 29th Annual Meeting 2020 Aug 8.
Figures