0125
Acquisition and data processing considerations in functional metabolic imaging using CEST1NeuroSpin, CEA, Gif-sur-Yvette, France, 2Paris-Saclay University, Gif-sur-Yvette, France
Synopsis
Accelerated acquisitions with a CEST-linescan sequence coupled with the estimation of the local baseline for the analysis of the Z-spectra allow to simultaneously monitor dynamic changes at several CEST contributions induced by a controlled pH decrease. This approach can be a promising strategy for detecting functional induced metabolic changes devoid of confounding BOLD effects.
Introduction
CEST (Chemical Exchange Saturation Transfer) has been widely used to detect metabolites such as glutamate[1], creatine[2], glucose[3], lactate[4] with an enhancement of several orders of magnitude compared to 1H-MRS spectroscopy. The use of CEST to detect brain functional metabolic changes has been proposed[5,6] but its practicality remains to be demonstrated. Acquiring CEST images typically requires long repetition times in order to accommodate adequate saturation times. Moreover, monitoring multiple metabolites simultaneously implies saturating at several different frequencies increasing even further the acquisition time. Beyond these considerations, it is not straightforward to detect functional CEST metabolic changes as they are overpowered by the much stronger BOLD signal[7]. The authors of [6] acquired 3D APT-CEST volumes to detect brain pH changes in response to visual stimulation but were limited by the confounding BOLD effect. By performing numerical simulations, Roussel et al[5] have designed the optimal acquisition and processing pipeline to minimize/eliminate BOLD from the GlucoCEST signal and have successfully demonstrated the glucose consumption during electrical fore-paw stimulation in rats. In this study, we use CEST-linescan[8] (CEST-LS) to evaluate the in vivo metabolic changes on a complete Z-spectrum (-5 to 5ppm) induced by a pH decrease caused by hypercapnia[9]. Several CEST contributions, including amine (2.7-2.8 ppm) and Amide Proton Transfer (APT, 3.5 ppm), are analysed. We discuss and present strategies for detecting metabolic changes induced by functional changes using CEST.Material and methods
In vivo acquisitionsAll measurements were performed on a 17.2T preclinical scanner with a surface coil (Bruker BioSpin). Three male Wistar rats (200-250g) were scanned under isoflurane anaesthesia and controlled physiological conditions. Anatomical images of the rat brain were acquired using a T2-weighted sequence with TE/TR=11/2000 ms, in plane resolution 80*80 µm2 and slice thickness 1 mm. CEST-LS acquisitions (TE/TR=5/2500 ms) were performed in a voxel (6*3*2 mm3) positioned in the cortex close to the surface coil. The saturation module consisted of 10*100 ms Gaussian pulse with peak amplitude B1,sat=2µT, 64 offsets from -5 to 5 ppm and 80 repetitions (40 pairs of saturated /reference profiles).
Hypercapnia protocol
Three first CEST-LS scans were acquired under pure O2 and 1.5% isoflurane, the CO2 level was then raised to 30% and the isoflurane was lowered to 1%. After 5 minutes, three CEST-LS scans were acquired in the established presence of CO2. After restoring the initial situation and another 5 minutes break, three last CEST-LS acquisitions were performed.
Results
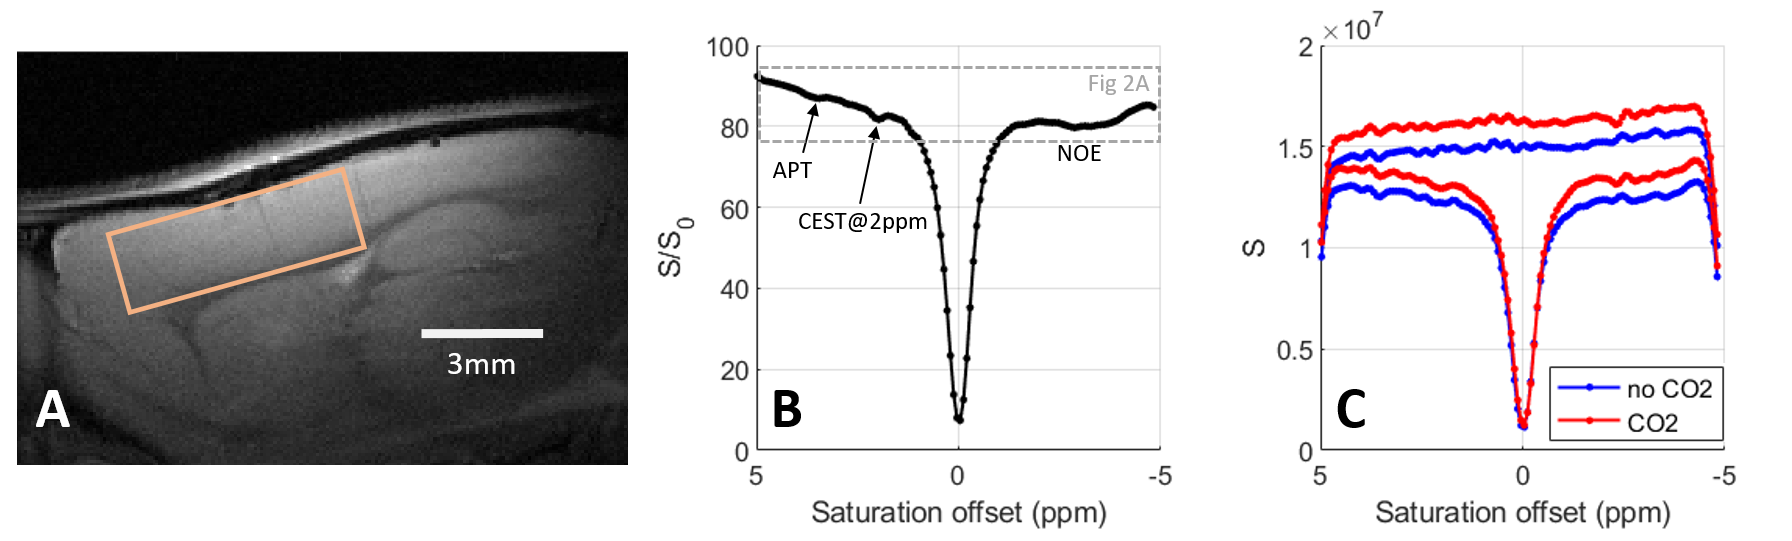
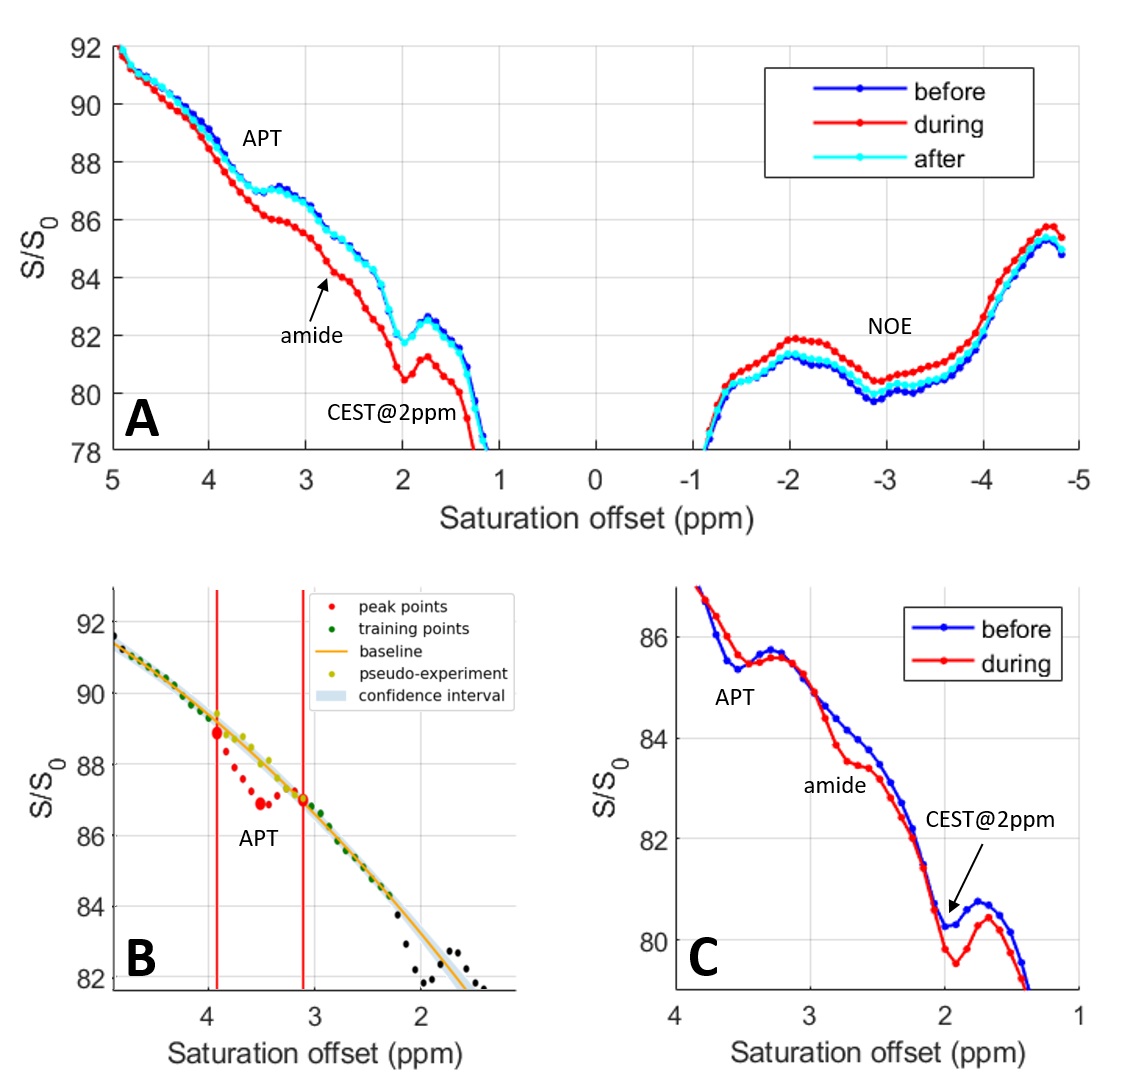
Figure 1B presents the in vivo Z-spectra obtained in the rat cortex using a CEST-LS sequence (voxel position depicted in Figure 1A). In Figure 1B, we recognize the APT, amine, 2ppm[9] and NOE (Nuclear Overhauser Enhancement) CEST contributions.Before analysing individual CEST contributions, we compared the reference and saturated profiles with and without administration of CO2. As presented in Figure 1C, both profiles show a higher signal under CO2 administration due to increased cerebral perfusion. The signal is even higher for the reference profile than for the saturated one in the downfield region (0-5ppm), explaining why the baseline is globally lower during CO2 administration in this region. The opposite effect is observed upfield where the baseline of the Z-spectrum is slightly higher with CO2. Therefore simply comparing the Z-spectra under different conditions (Figure 2A) will not reflect strictly metabolic changes as they will be overpowered by global signal modifications. To a smaller extent, such a situation can be encountered when performing task-based fMRI studies due to local increase in the MR signal. Alternative processing strategies should therefore be employed.
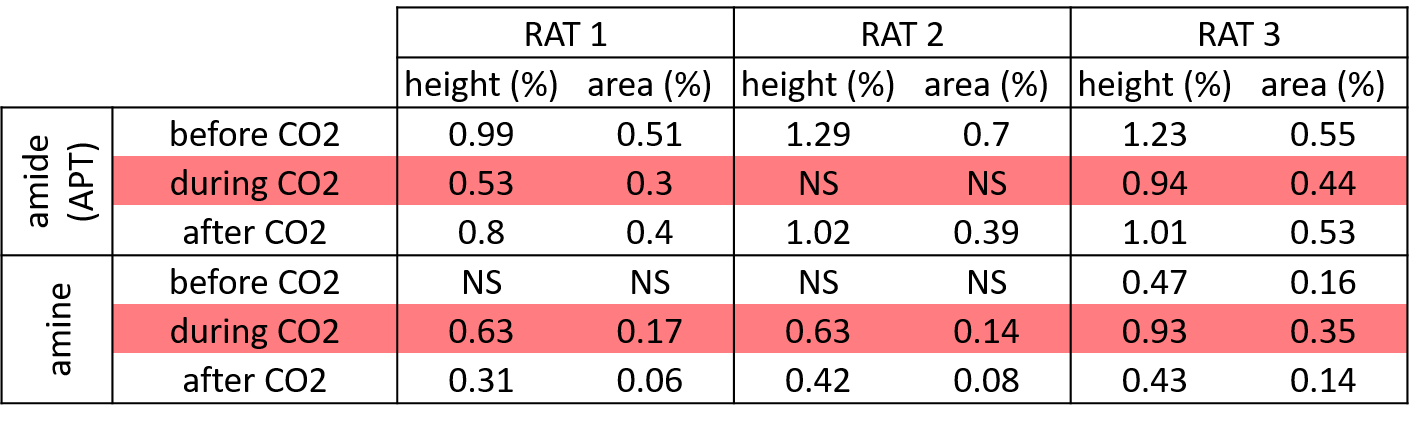
To evaluate the effect of the CO2 administration on the CEST signal, we used the PEAKIT software previously developed[10]. Briefly, PEAKIT quantifies CEST peaks by performing a local baseline estimation (Figure 2B) and is therefore minimally impacted by the global shape of the Z-spectrum. The APT-CEST results obtained are presented in Figure 3. As expected, the pH decrease induced by hypercapnia leads to a decrease in the APT-CEST contrast[12]. Both the height and area of the APT peak are divided by a factor of minimum two in presence of CO2. When the CO2 is discontinued the APT-CEST contrast is recovered (Fig 2A). No significant difference was detected in the amplitude/area of the CEST signal at 2 ppm when CO2 was added. Using PEAKIT, we also detected a difference in the amine CEST region (2.7-2.8 ppm) where the amplitude and area of the CEST peak increased by a factor of two with CO2 administration. The CEST contrast in this region is largely determined by exchangeable amine protons of relatively highly concentrated amino acids (alanine, GABA, aspartate, taurine)[11] for which the exchange rate decreases with pH, bringing them closer to the intermediate regime favorable to CEST (Figure 2C). PEAKIT does not allow to analyse the broad NOE-CEST contribution.
Conclusion
With CEST-LS, we are able to simultaneously monitor dynamic changes of several CEST contributions induced by a controlled pH decrease. Besides the high temporal resolution and good signal stability necessary to detect small metabolic changes, appropriate tactics for eliminating confounding factors (BOLD, increase in blow flow) are necessary. The peak analysis approach presented here can be employed when discrete peaks can be detected. Other strategies[5] should be sought for broad CEST contributions.Acknowledgements
This research was supported by a public grant overseen by the ANR and DFG under the project name BAMBOO. The authors thank E. Selingue for managing the animals preparation and welfare.References
1. Cai K, Haris M, Singh A, et al. Magnetic resonance imaging of glutamate. Nat Med. 2012;18(2):302-306. doi:10.1038/nm.2615
2. Haris M, Nanga RPR, Singh A, et al. Exchange rates of creatine kinase metabolites: Feasibility of imaging creatine by chemical exchange saturation transfer MRI. NMR Biomed. 2012;25(11):1305-1309. doi:10.1002/nbm.2792
3. Chan KWY, McMahon MT, Kato Y, et al. Natural D -glucose as a biodegradable MRI contrast agent for detecting cancer. Magn Reson Med. 2012;68(6):1764-1773. doi:10.1002/mrm.24520
4. DeBrosse C, Nanga RPR, Bagga P, et al. Lactate Chemical Exchange Saturation Transfer (LATEST) Imaging in vivo A Biomarker for LDH Activity. Sci Rep. 2016;6(October 2015):1-9. doi:10.1038/srep19517
5. Roussel T, Frydman L, Le Bihan D, Ciobanu L. Brain sugar consumption during neuronal activation detected by CEST functional MRI at ultra-high magnetic fields. Sci Rep. 2019;9(1):1-11. doi:10.1038/s41598-019-40986-9
6. Khlebnikov V, Siero JCW, Bhogal AA, Luijten PR, Klomp DWJ, Hoogduin H. Establishing upper limits on neuronal activity–evoked pH changes with APT-CEST MRI at 7 T. Magn Reson Med. 2018;80(1):126-136. doi:10.1002/mrm.27013
7. Ogawa S, Tank DW, Menon R, et al. Intrinsic signal changes accompanying sensory stimulation: Functional brain mapping with magnetic resonance imaging. Proc Natl Acad Sci U S A. 1992;89(13):5951-5955. doi:10.1073/pnas.89.13.5951
8. Bardin S, Lecis M, Boido D, Boumezbeur F, Ciobanu L. First in vivo detection of carnosine using CEST. ISMRM 2021, Vancouver.
9. Cai K, Singh A, Poptani H, et al. CEST signal at 2ppm (CEST at 2ppm) from Z-spectral fitting correlates with creatine distribution in brain tumor. NMR Biomed. 2015;28(1):1-8. doi:10.1002/nbm.3216
10. Lecis M, Bardin S, Ciobanu CI, Ciobanu L. PEAKIT : A Gaussian Process Regression Analysis Tool for Chemical Exchange Saturation Transfer Spectra. in press
11. Wermter FC, Bock C, Dreher W. Investigating GluCEST and its specificity for pH mapping at low temperatures. NMR Biomed. 2015;28(11):1507-1517. doi:10.1002/nbm.3416
Figures