0120
Microvascular invasion in patients with hepatocellular carcinoma: assessment with compression MR elastography1Laboratory of imaging biomarkers, INSERM UMR 1149, Paris, France, 2Center for research on inflammation, INSERM UMR 1149, Paris, France, 3Laboratory for vascular translational science, INSERM UMR 1148, Paris, France, 4Department of Radiology, University Hospital Paris Nord, Clichy, France
Synopsis
The aim of this study was to investigate the value of compression MR elastography to assess microvascular invasion in hepatocellular carcinomas. MR elastographic and T2-weighted images were acquired at end expiration and end inspiration in 52 patients with hepatocellular carcinomas. The storage and loss moduli at inspiration did not differ between tumors with/without microvascular invasion. However, the compression stiffening rate, derived from the increase of tumor storage modulus between expiration and inspiration, had good diagnostic performance (area under the receiver operating characteristic curve 0.85) in detecting microvascular invasion.
Introduction
Tumor physical abnormalities caused by cancer cells and their microenvironment influence tumor progression and response to treatment [1]. Among these physical abnormalities, high solid stress generates cellular contractile forces promoting tumor metastatic potential, including microvascular invasion (MVI) [2-5]. Solid stress is classically measured with invasive methods. Recently, compression stiffening rate, derived from MR elastography measurements under compression, has been used to assess non-invasively the solid stress in hepatic cancer models in small animals [6].The purpose of this study was to assess if compression MR elastography using different breath hold modes as stress sources [7] could be used to assess cancer invasiveness (i.e. MVI) in patients with hepatocellular carcinomas.
Methods
Acquisition: This prospective study was approved by our institutional review board. A total of 52 patients (median age, 66 years; range, 62-69 years) with hepatocellular carcinoma were imaged before surgical resection. The MRI examinations were performed on a 3.0T Philips Ingenia scanner with a 32-element torso coil. MR elastography was performed with the ‘’eXpresso’’ sequence [8] at a frequency of 50Hz (n=32) and 40Hz (n=20). Synchronized mechanical vibrations were generated with a mechanical transducer [9]. The following parameters were used: TR/TE: 89/7 ms, spatial resolution: 4.2 mm3, FOV: 420x420 mm2, slices: 8 and 4 temporal steps. Patients were instructed to hold their breath at end inspiration and end expiration. T2-weighted MR images were acquired at both breath-hold modes with TR/TE: 531/120 ms, spatial resolution: 0.59x0.59 mm2, slice thickness: 4 mm and FOV: 280x376 mm2.MRI analysis: Maps of storage (G’) and loss (G’’) moduli were obtained by the inversion of Helmholtz wave equation (Figure 1). Tumor deformation maps were calculated by applying successively a 2D rigid transformation and a 3D affine registration on the T2 images (Matlab R2020a, MathWorks, Natick, MA). Displacement fields obtained from the 3D affine transformation were extracted to compute tumor shear deformation ($$$ε$$$) using the octahedral shear strain method[10]. Stress ($$$σ$$$) was calculated with the Hooke law, as $$$σ=3.G'_{inspiration}.ε$$$. The compression stiffening rate (adimensional) was determined as the linear slope between G’ and $$$σ$$$ [6].
Histopathological analysis: Tumor resection was performed within a month of the MR elastography examinations. MVI was determined with histopathological examination of the resected tumors.
Statistical analysis: Statistical analysis was performed with Medcalc version 19.5.3 software (Medcalc, Ostend, Belgium). Unpaired t-tests were used for comparisons and the diagnostic performance in detecting MVI was assessed by calculating the area under the operating curves (AUCs). The Delong test was used for comparison between receiver operating curves. A multiple regression was performed to analyze the effect of frequency on the results, with frequency and MVI as independent variables and G’, G’’ and compression stiffening rate considered successively as dependent variable.
Results
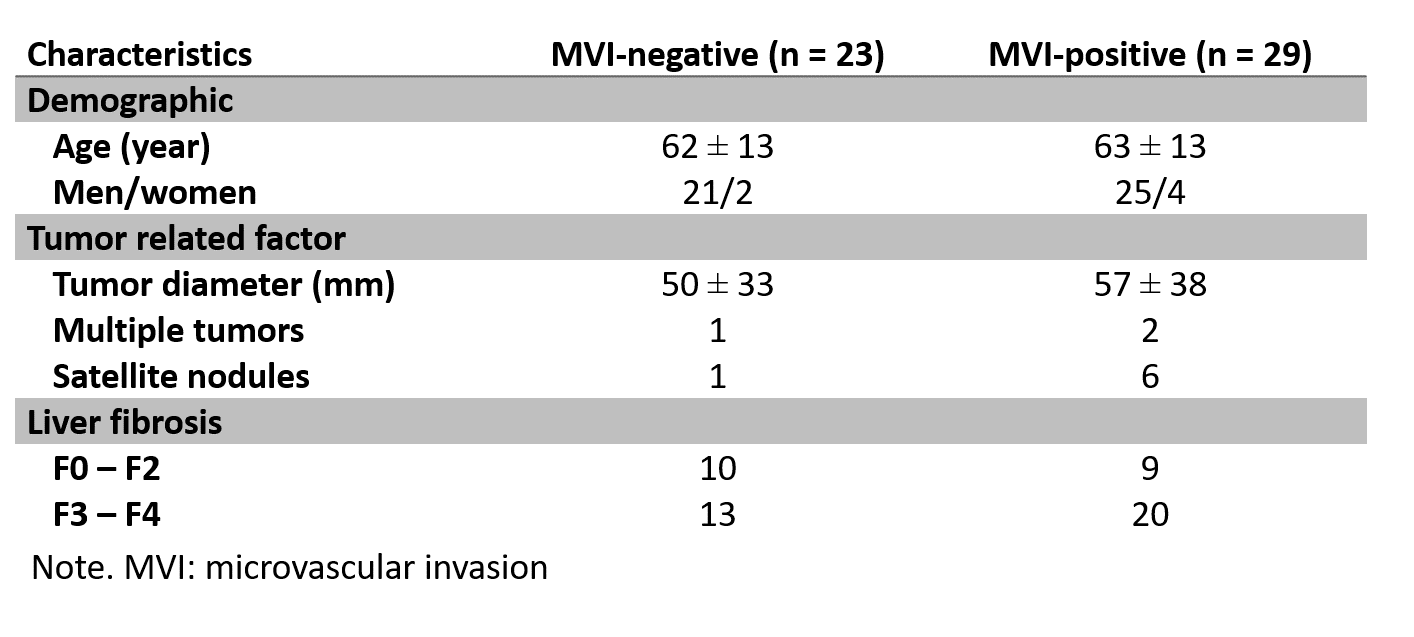
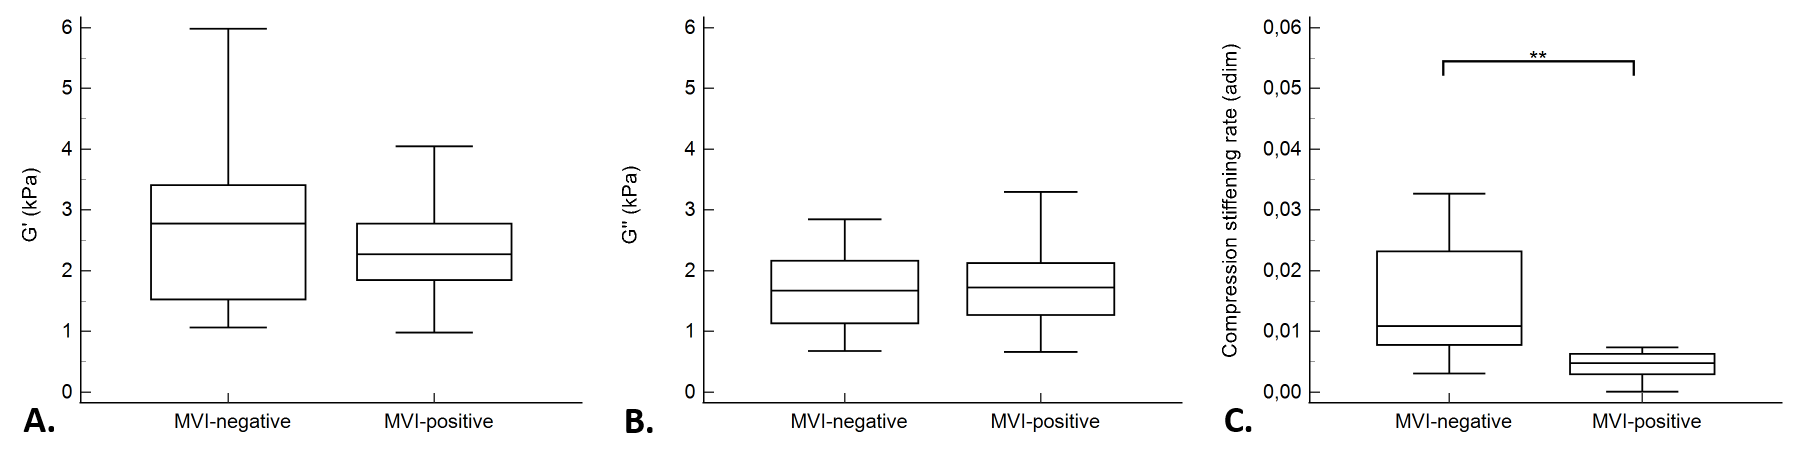
Among 52 patients, 29 participants had MVI-positive lesions and 23 had MVI-negative lesions, according to the histologic evaluation. Clinical information about the 52 participants with hepatocellular carcinoma are displayed in the Table. Tumor storage and loss moduli were significantly lower at expiration than at inspiration (G’: 2.0 ± 0.7 kPa versus 2.6 ± 1.3 kPa, p = 0.003 and G’’: 1.4 ± 0.5 kPa versus 1.9 ± 0.8 kPa, p = 0.004), (Figure 1).The storage and loss moduli at end inspiration did not significantly differ between MVI-negative and MVI-positive groups (G’: 2.8 ± 1.4 kPa versus 2.4 ± 0.8 kPa, p = 0.24 and G’’: 2.0 ± 1.1 kPa versus 1.8 ± 0.8 kPa, p = 0.55, respectively). In contrast, the compression stiffening rate was significantly higher in the MVI-negative tumors than in the MVI-positive tumors (0.02 ± 0.03 versus 0.007 ± 0.008, p = 0.006) (Figure 2).
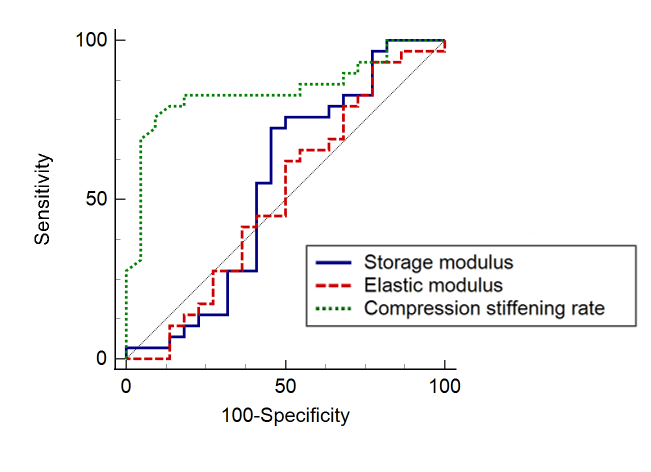
The compression stiffening rate showed high diagnostic performance in detecting MVI (AUC = 0.85, 95% CI = [0.71, 0.93], p < 0.0001), in contrast to the storage and loss moduli (AUC = 0.55, 95% CI = [0.40, 0.69], p = 0.59 and AUC = 0.51, 95% CI = [0.37, 0.66], p = 0.89, respectively) (Figure 3). The AUC of the compression stiffening rate was significantly higher than those of the storage and loss moduli (p = 0.003 and p = 0.0003, respectively). At multiple regression, MVI was only connected to compression stiffening (rpartial= -0.37, p = 0.007), in contrast G’ and G’’ were only dependent on acquisition frequency (G’: rpartial= 0.49, p = 0.0002; G’’: rpartial= 0.42, p = 0.002) (Table 2).
Discussion
The results of our study in patients with hepatocellular carcinomas confirm that the storage and loss moduli change with respiration, as already observed in previous studies in the liver [7]. Moreover, we observed that the compression stiffening rate obtained from the increase of the viscoelastic parameters at inspiration, had high performance for diagnosing MVI in hepatocellular carcinomas. The relation between MVI and compression stiffening rate may be explained by high solid stress which promotes cell infiltration and tumor invasiveness [2-4]. Indeed, we have previously shown that the compression stiffening rate of hepatocellular carcinomas in small animals is a marker of high tumor solid stress [6].Conclusion
In conclusion, our results suggest that compression MR elastography during forced inspiration and expiration might be useful as a non-invasive clinical method to assess hepatocellular carcinoma microvascular invasion.Acknowledgements
The authors wish to acknowledge S. Bendou for patient recruitment.
This project has received funding from the European Union’s Horizon 2020 research and Innovation programme under grant agreement No668039.
References
1. Nia, H.T.; Munn, L.L.; Jain, R.K. Physical traits of cancer. Science 2020, 370.
2. Tse, J.M.; Cheng, G.; Tyrrell, J.A.; Wilcox-Adelman, S.A.; Boucher, Y.; Jain, R.K.; Munn, L.L. Mechanical compression drives cancer cells toward invasive phenotype. Proc Natl Acad Sci U S A 2012, 109, 911-916, doi:10.1073/pnas.1118910109.
3. Kraning-Rush, C.M.; Califano, J.P.; Reinhart-King, C.A. Cellular traction stresses increase with increasing metastatic potential. PLoS One 2012, 7, e32572, doi:10.1371/journal.pone.0032572.
4. Parekh, A.; Weaver, A.M. Regulation of invadopodia by mechanical signaling. Exp Cell Res 2016, 343, 89-95, doi:10.1016/j.yexcr.2015.10.038.
5. Mierke, C.T. The matrix environmental and cell mechanical properties regulate cell migration and contribute to the invasive phenotype of cancer cells. Reports on Progress in Physics 2019, 82, 064602.
6. Pagé, G.; Tardieu, M.; Gennisson, J.L.; Besret, L.; Garteiser, P.; Van Beers, B.E. Tumor Solid Stress: Assessment with MR Elastography under Compression of Patient-Derived Hepatocellular Carcinomas and Cholangiocarcinomas Xenografted in Mice. Cancers (Basel) 2021, 13, doi:10.3390/cancers13081891.
7. Garteiser, P.; Page, G.; Manzi, A.P.; Vilgrain, V.; Sinkus, R.; Van Beers, B.E. Effect of breath hold mode on the storage modulus of the live in healthy individuals studied with a gravitational transducer at magnetic resonance elastography. In Proceedings of Proceedings of 27th ISMRM annual meeting, Montréal, Canada.
8. Garteiser, P.; Sahebjavaher, R.S.; Ter Beek, L.C.; Salcudean, S.; Vilgrain, V.; Van Beers, B.E.; Sinkus, R. Rapid acquisition of multifrequency, multislice and multidirectional MR elastography data with a fractionally encoded gradient echo sequence. NMR in Biomedicine 2013, 26, 1326-1335.
9. Runge, J.H.; Hoelzl, S.H.; Sudakova, J.; Dokumaci, A.S.; Nelissen, J.L.; Guenthner, C.; Lee, J.; Troelstra, M.; Fovargue, D.; Stoker, J., et al. A novel magnetic resonance elastography transducer concept based on a rotational eccentric mass: preliminary experiences with the gravitational transducer. Phys Med Biol 2019, 64, 045007, doi:10.1088/1361-6560/aaf9f8.
10. McGarry, M.D.J.; Houten, E.E.W.V.; Perriñez, P.R.; Pattison, A.J.; Weaver, J.B.; Paulsen, K.D. An octahedral shear strain-based measure of SNR for 3D MR elastography. Physics in Medicine & Biology 2011, 56, N153, doi:10.1088/0031-9155/56/13/N02.
Figures