0119
Influence of hepatic tissue water content on MRE-based biomarkers in clinical and preclinical studies1Radiology, Mayo Clinic, Rochester, MN, United States, 2Gastroenterology and Hepatology, Mayo Clinic, Rochester, MN, United States, 3Anatomic Pathology, Mayo Clinic, Rochester, MN, United States
Synopsis
The water in hepatic tissue has intracellular, extracellular matrix bound, and extracellular interstitial free fluid components, which are affected by inflammation and fibrosis. This study assessed longitudinal changes in MRE-based biomarkers and their relationship with hepatic water content in clinical and preclinical models. In clinical studies, MRE-assessed loss modulus (LM) was elevated in obese patients and in NAFLD patients with severe inflammation. In preclinical models, changes in LM correlated with water content and disease progression in non-NAFLD mice. LM significantly increased with the development of NASH. MRE-assessed viscoelasticity strongly reflects extracellular free fluid associated with inflammation.
Introduction
MR elastography (MRE)-assessed shear stiffness (SS) has been widely used in clinical practice to evaluate hepatic fibrosis as an alternative to liver biopsy (1). Our previous investigation has found that the 3D vector MRE-assessed loss modulus (LM) was significantly elevated in obese patients, which might be associated with increased interstitial fluid volume in the inflammatory process before the development of nonalcoholic fatty liver disease (NAFLD) (2). However, there is a question about the possible obesity-induced tissue volume change that may cause elevated LM, instead of interstitial fluid volume. In this study, we further explored clinical evidence in less obese patients with biopsy-proven NAFLD to support our hypothesis. It is challenging to assess fluid volume in the limited clinical biospecimen. Therefore, we performed preclinical MRE/MRI and collected liver tissue for water content measurement in two rodent models (non-NAFLD vs. NAFLD). The goal of this study was to investigate the effect of hepatic tissue composition, especially inflammation-related tissue fluid volume on MRE-assessed biomarkers, with or without the presence of steatosis.Methods
Clinical study: 6-point Dixon MRI and dual-frequency 3D vector MRE (30Hz and 60Hz) were performed on 10 non-obese controls (BMI<30kg/m2) and 33 obese patients (BMI≥30kg/m2), who were retrospectively identified from biopsy as non-NAFLD (N=24, no histologic evidence of steatosis, ballooning, or fibrosis, with no or mild inflammation) and NAFLD obese subjects (N=9, mild steatosis, severe inflammation, with varying extent of ballooning or fibrosis).Preclinical study: We included 60 rodent animals, including 35 mice with carbon tetrachloride [CCl4]-induced liver injury, 25 rats with choline-deficient high-fat diet (CDHFD)-induced nonalcoholic steatohepatitis (NASH). All animals were scanned on a 3.0T GE scanner with Dixon and MRE methods shown in previous work (3, 4). Liver samples were collected at the endpoint (Figure1) for histological analysis and water content measurement.
Statistical analysis: The Dunn nonparametric multiple comparison test with Bonferroni adjustment was used to test differences in parameters between groups. Spearman correlations were used to analyze the relationships between the MRE/MRI parameters and water content. A significance level of 0.05 was used.
Results
Table1 shows that both non-NAFLD and NAFLD obese patients had significantly increased LM when compared with healthy volunteers. The NAFLD patient group also showed a significant increase in SS when compared with non-NAFLD patients and healthy volunteers. Figure1 shows that the CCl4 mice developed severe inflammation and fibrosis after 4-weeks CCl4 administration and recovered after withdrawal. Figure2 illustrates that the hepatic water content, as well as SS and LM, increased gradually with sustained liver injuries (concurring inflammation and fibrosis) and decreased with regression. In NAFLD model, the water content of the liver was significantly lower in the NASH group when compared with controls. But the SS and LM of NASH group consistently increased through time and were significantly higher than controls (Figure3). The water content was positively correlated with hydroxyproline in the fibrotic liver, but negatively correlated with PDFF in the fatty liver with substantially decreased values (Figure4).Discussion
Multiparametric 3D vector MRE measures mechanical responses that reflect biphasic soft tissue composition and microstructure changes in disease development. In liver applications, shear stiffness is well-established to be primarily associated with the solid phase, reflecting the extracellular matrix (fibrosis) and sinusoidal resistance in interstitial space. In comparison, loss modulus is more sensitive to the changes of the fluid phase, especially mobile interstitial fluid excited at low mechanical frequencies. In previous studies, we found that LM at 30Hz was significantly elevated in obese patients and dampened after successful weight loss treatment before NAFLD development (2). In this study, we observed further evidence of consistently increased LM with severe inflammation in NAFLD patients. In our preclinical studies, LM change agreed well with progressive and regressive liver injury in CCl4 mouse model, in which hepatic water content correlated to collagen content with concurring inflammation. We believe that LM is associated with interstitial fluid volume in the inflammatory and fibrogenesis processes (free and bound water), which occurs in the interstitium instead of intracellular space.Generally speaking, biological tissue fluid involves approximately 1/3 extracellular and 2/3 intracellular fluid (5). In NASH rats, the cytoplasm of hepatocytes was occupied mainly by lipid droplets. The intracellular water fraction – which is inversely proportional to fat fraction – became the main driving factor of the overall water content of the liver. Regardless of abnormal retention of lipids within hepatocytes, we believe that the hepatic extracellular fluid volume in NASH was no less than that in healthy livers, as shown in the significantly elevated LM and SS in our rats with severe NASH. The slightly decreased LM from week 12 to 16 indicates that burnout NASH had gradually diminished inflammation. It reveals that 3D vector MRE-assessed viscoelasticity most likely reflects the extracellular composition and microstructure change without detectable effects from intracellular composition shift in viable cells with steatosis (6). This finding echoes our prior results in clinical studies that MRE-assessed liver stiffness is not affected by hepatic steatosis (7).
Conclusion
Longitudinal changes in MRE-based viscoelasticity are associated with increased interstitial fluid and accumulation of collagen in chronic liver disease progression. Loss modulus measurements have potential for independently assessing water compartmentation associated with inflammation.Acknowledgements
This study is funded by NIH grants EB017197 (M.Y.), EB001981(R.L.E.), DK115594 (A.M.A.), DK059615 (V.S.), and DoD grant W81XWH-19-1-0583-01 (M.Y.).
References
1. Singh S, Venkatesh SK, Wang Z, Miller FH, Motosugi U, Low RN, Hassanein T, Asbach P, Godfrey EM, Yin M, Chen J, Keaveny AP, Bridges M, Bohte A, Murad MH, Lomas DJ, Talwalkar JA, Ehman RL. Diagnostic performance of magnetic resonance elastography in staging liver fibrosis: a systematic review and meta-analysis of individual participant data. Clin Gastroenterol Hepatol 2015;13(3):440-451 e446. doi: 10.1016/j.cgh.2014.09.046
2. Jiahui Li AMA, Vijay H. Shah, Armando Manduca, Richard L. Ehman, Meng Yin, Corporate Authorship. Longitudinal Changes in MR Elastography-based Biomarkers in Obese Patients Treated with Bariatric Surgery. Clinical Gastroenterology and Hepatology.
3. Li J, Sehrawat TS, Chen J, Hilscher MB, Glaser KJ, Arab JP, De Assuncao TM, Simonetto DA, Mounajjed T, Manduca A, Ehman RL, Shah VH, Yin M. Quantitative assessment of portal hypertension with bi-parametric dual-frequency hepatic MR elastography in mouse models. Eur Radiol 2021;31(4):2303-2311. doi: 10.1007/s00330-020-07341-3
4. Thabut D, Routray C, Lomberk G, Shergill U, Glaser K, Huebert R, Patel L, Masyuk T, Blechacz B, Vercnocke A, Ritman E, Ehman R, Urrutia R, Shah V. Complementary vascular and matrix regulatory pathways underlie the beneficial mechanism of action of sorafenib in liver fibrosis. Hepatology 2011;54(2):573-585. doi: 10.1002/hep.24427
5. Brinkman JE DB, Sharma S. Physiology, Body Fluids: StatPearls Publishing, 2021 Jan-.
6. Frantz C, Stewart KM, Weaver VM. The extracellular matrix at a glance. J Cell Sci 2010;123(Pt 24):4195-4200. doi: 10.1242/jcs.023820
7. Chen J, Allen AM, Therneau TM, Chen J, Li J, Hoodeshenas S, Chen J, Lu X, Zhu Z, Venkatesh SK, Song B, Ehman RL, Yin M. Liver stiffness measurement by magnetic resonance elastography is not affected by hepatic steatosis. Eur Radiol 2021. doi: 10.1007/s00330-021-08225-w
Figures
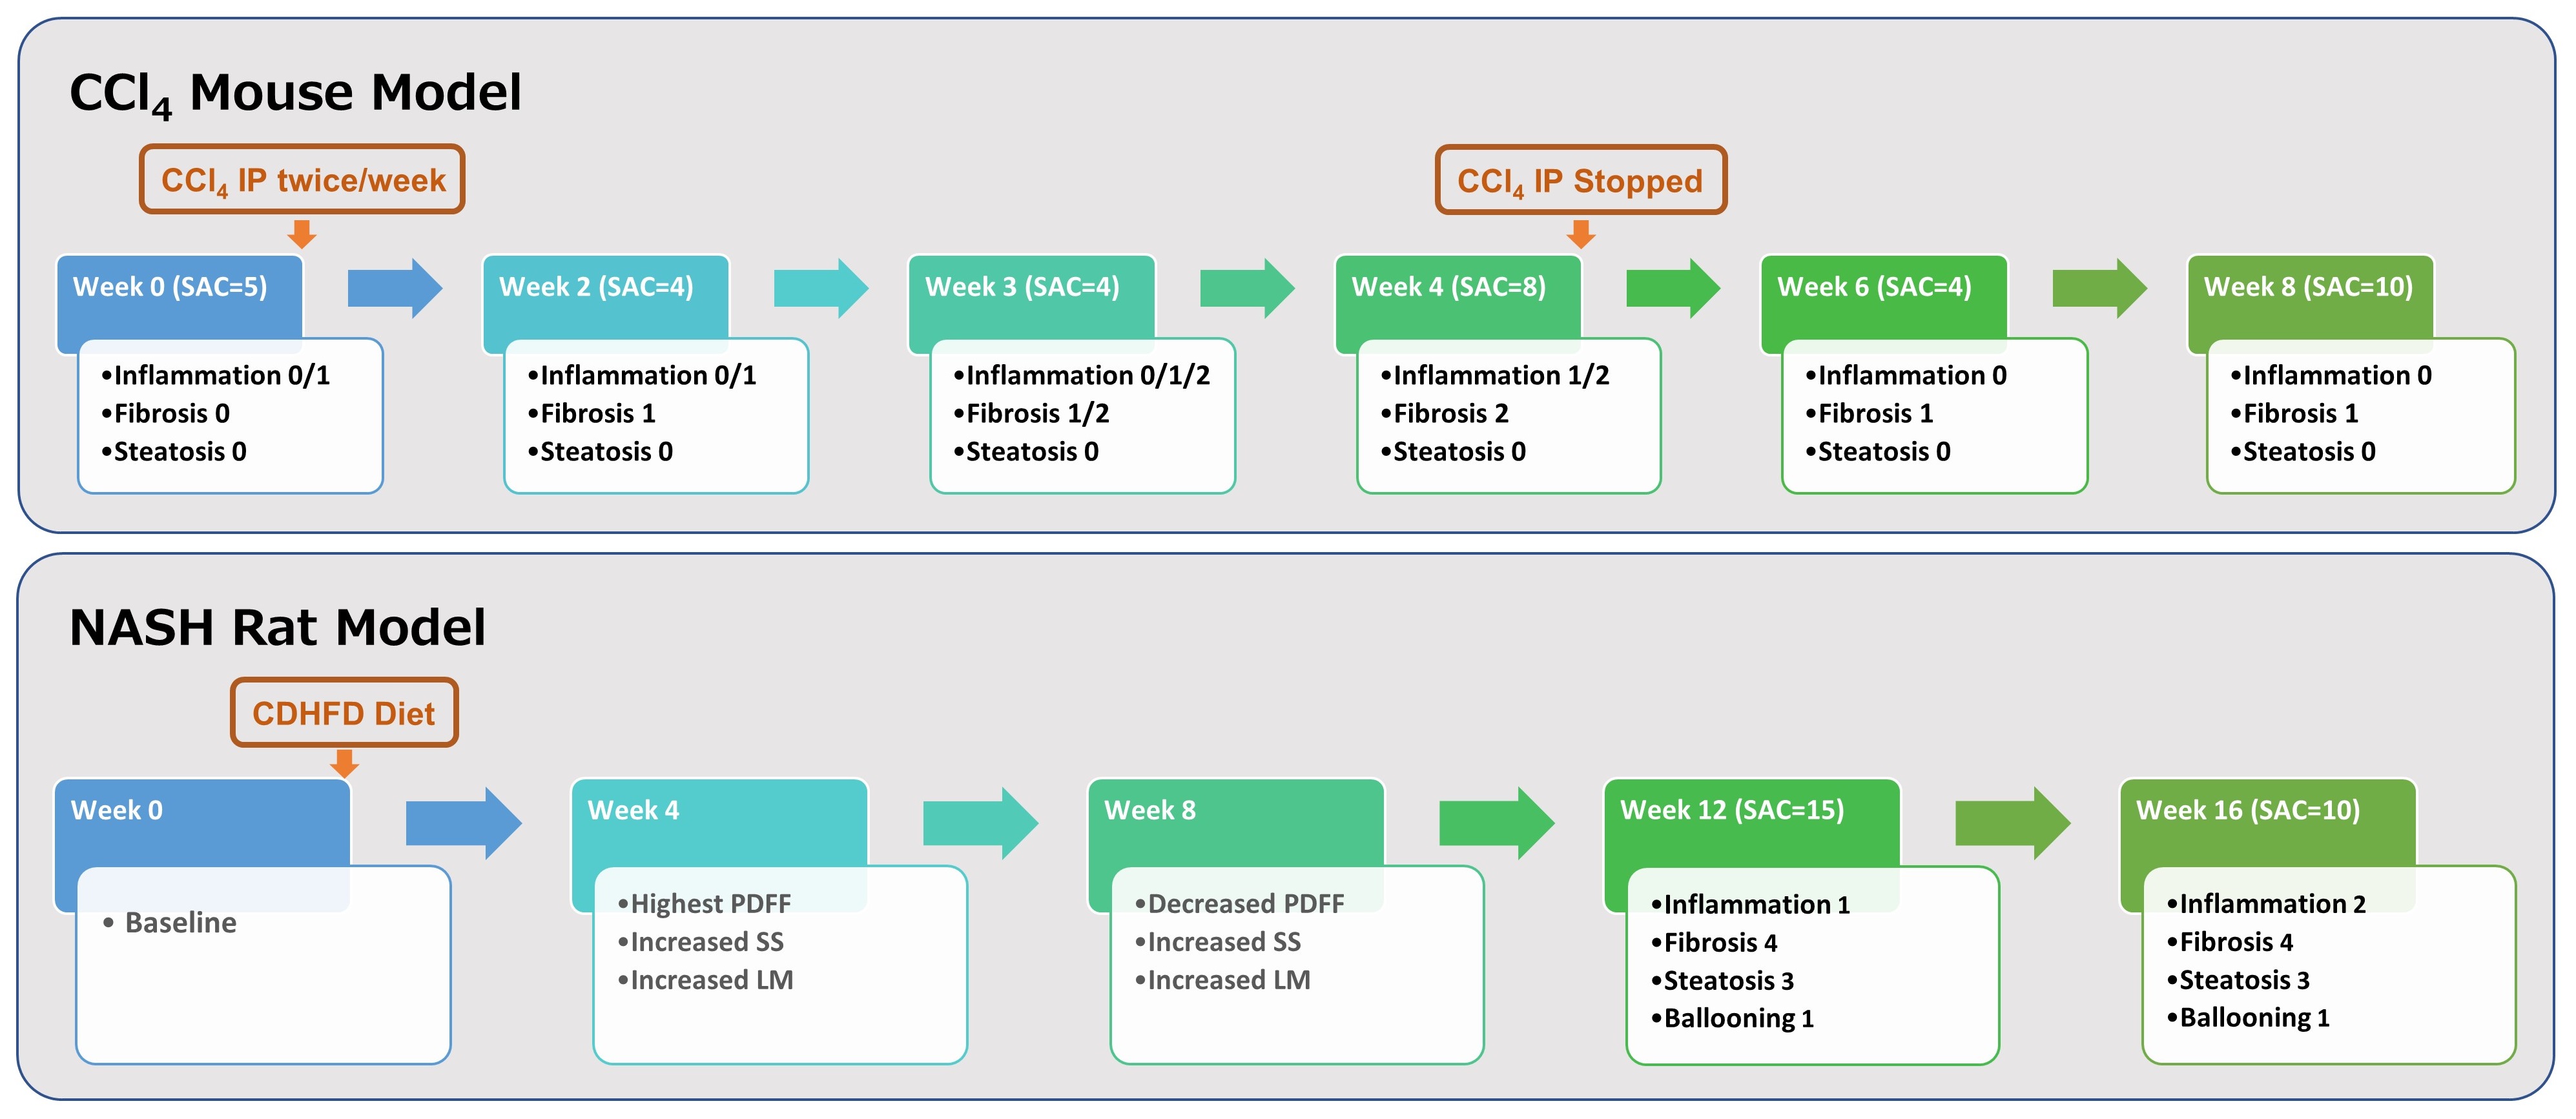
Figure 1. Histological changes in animal models PDFF, proton density fat fraction; SS, shear stiffness; LM, loss modulus. SAC, sacrifice or endpoint for animals
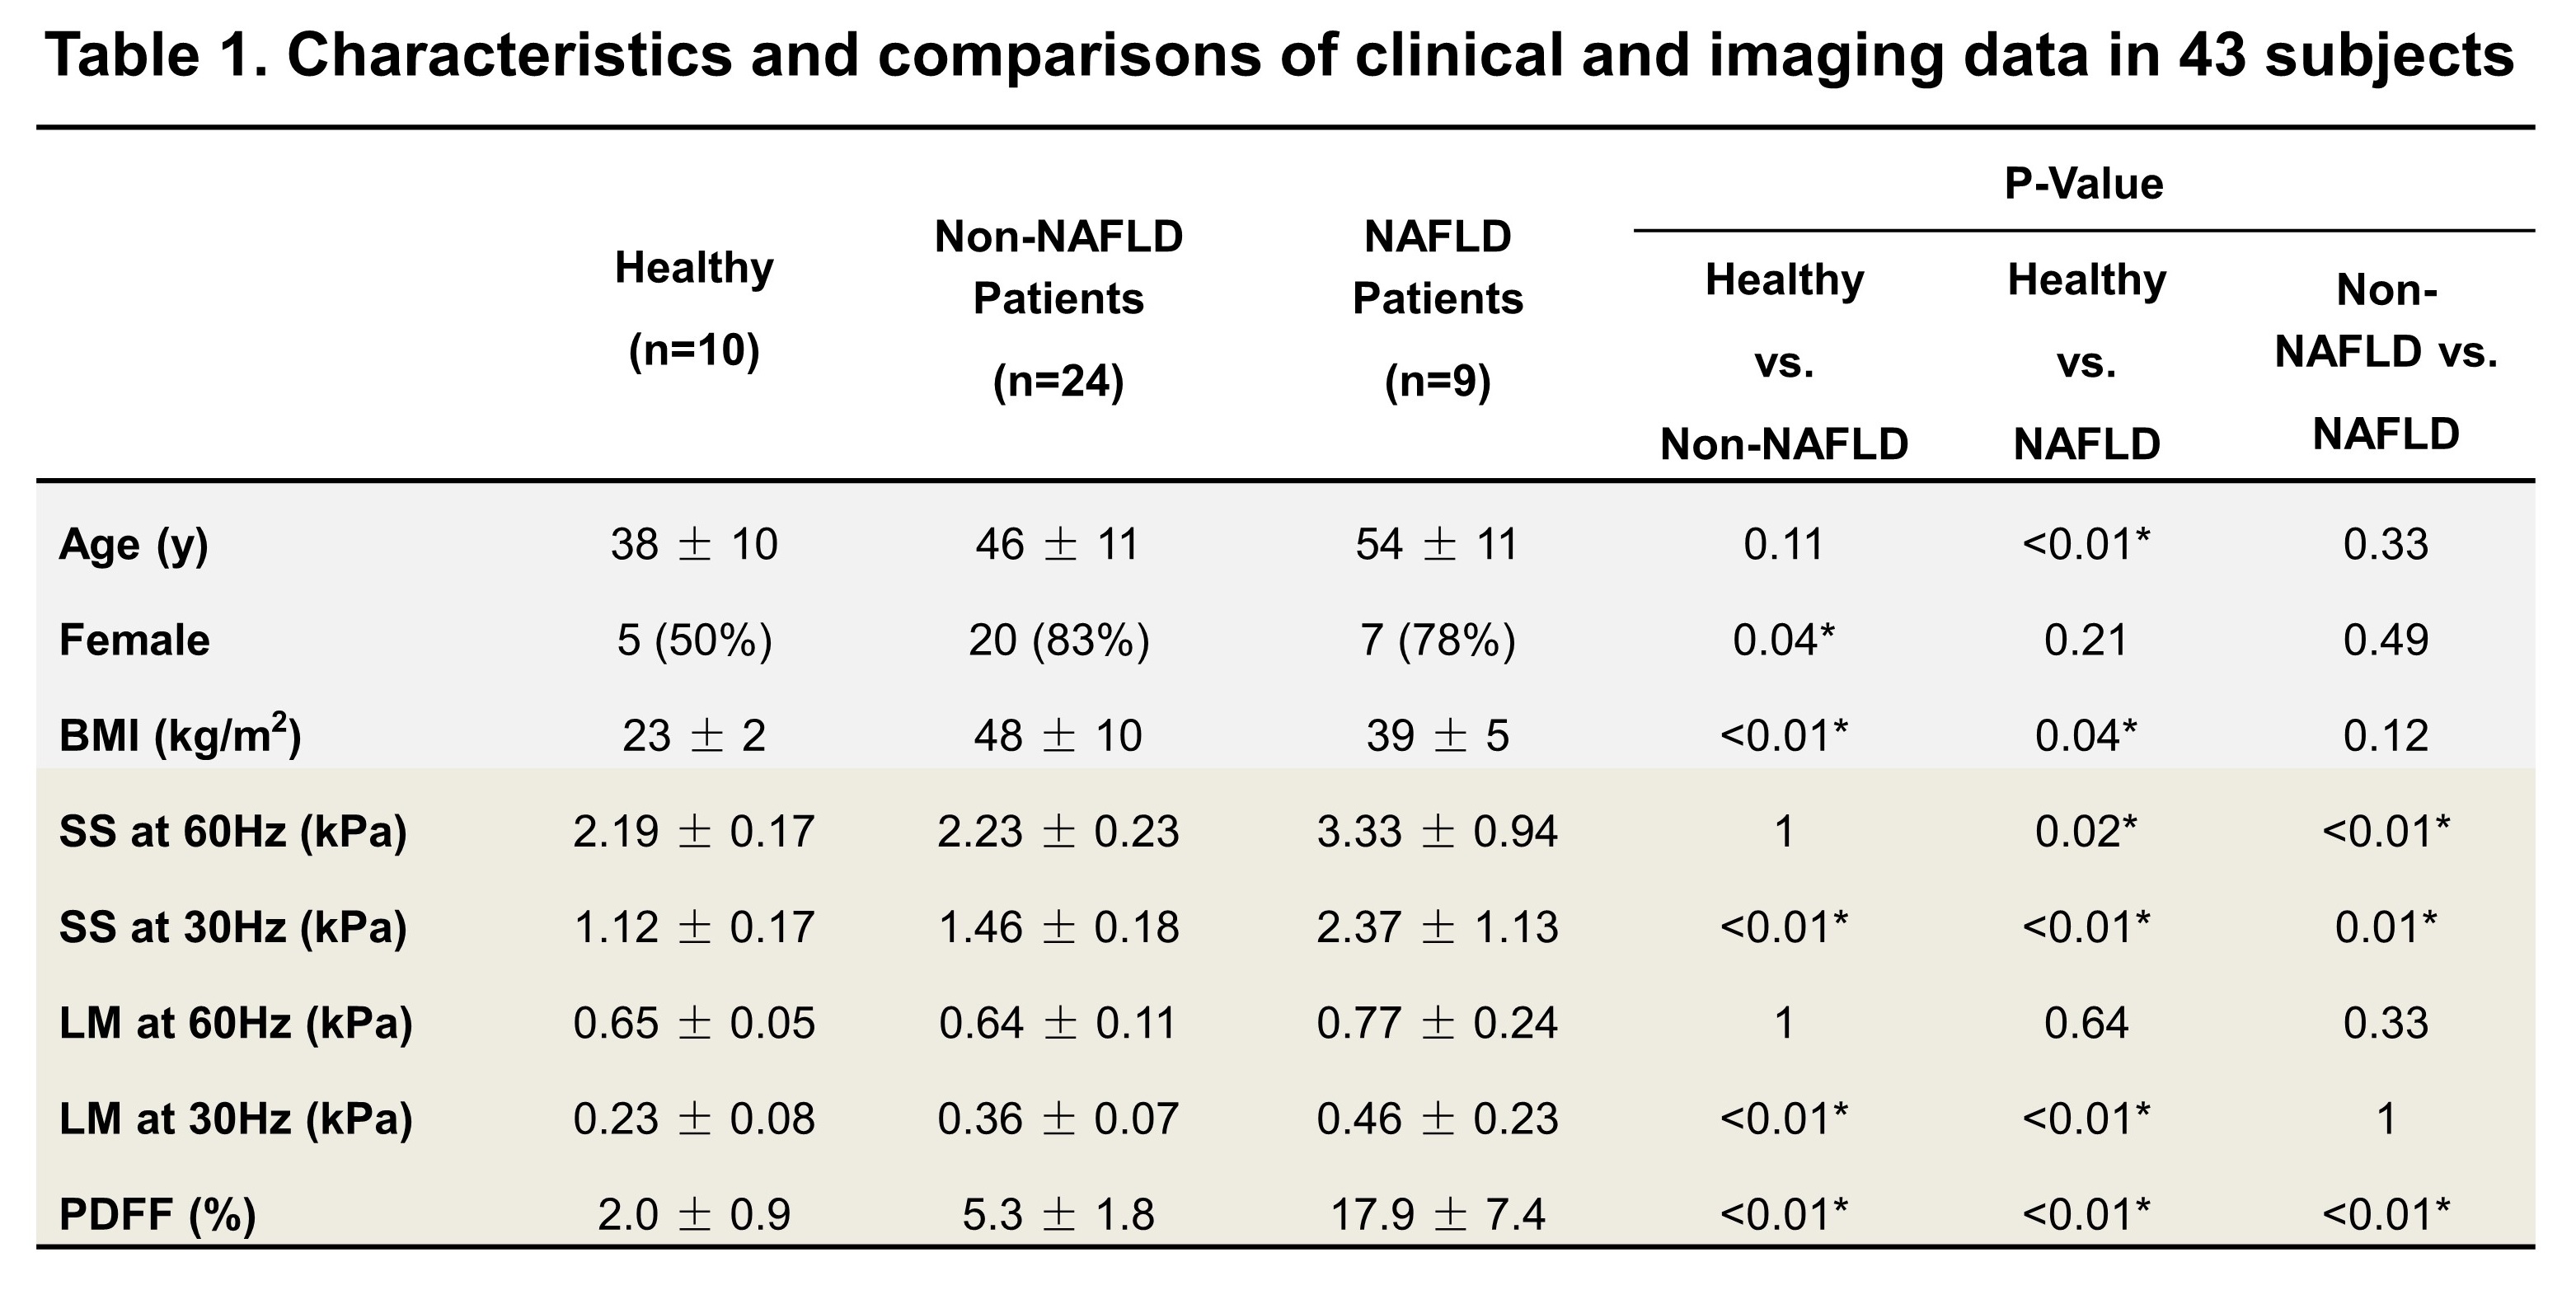
Continuous variables are reported as mean ± SD. Discrete variables are reported as the number and proportion of subjects with the characteristics of interest. BMI, body mass index; SS, shear stiffness; LM, loss modulus; PDFF, proton density fat fraction. *: p<0.05.
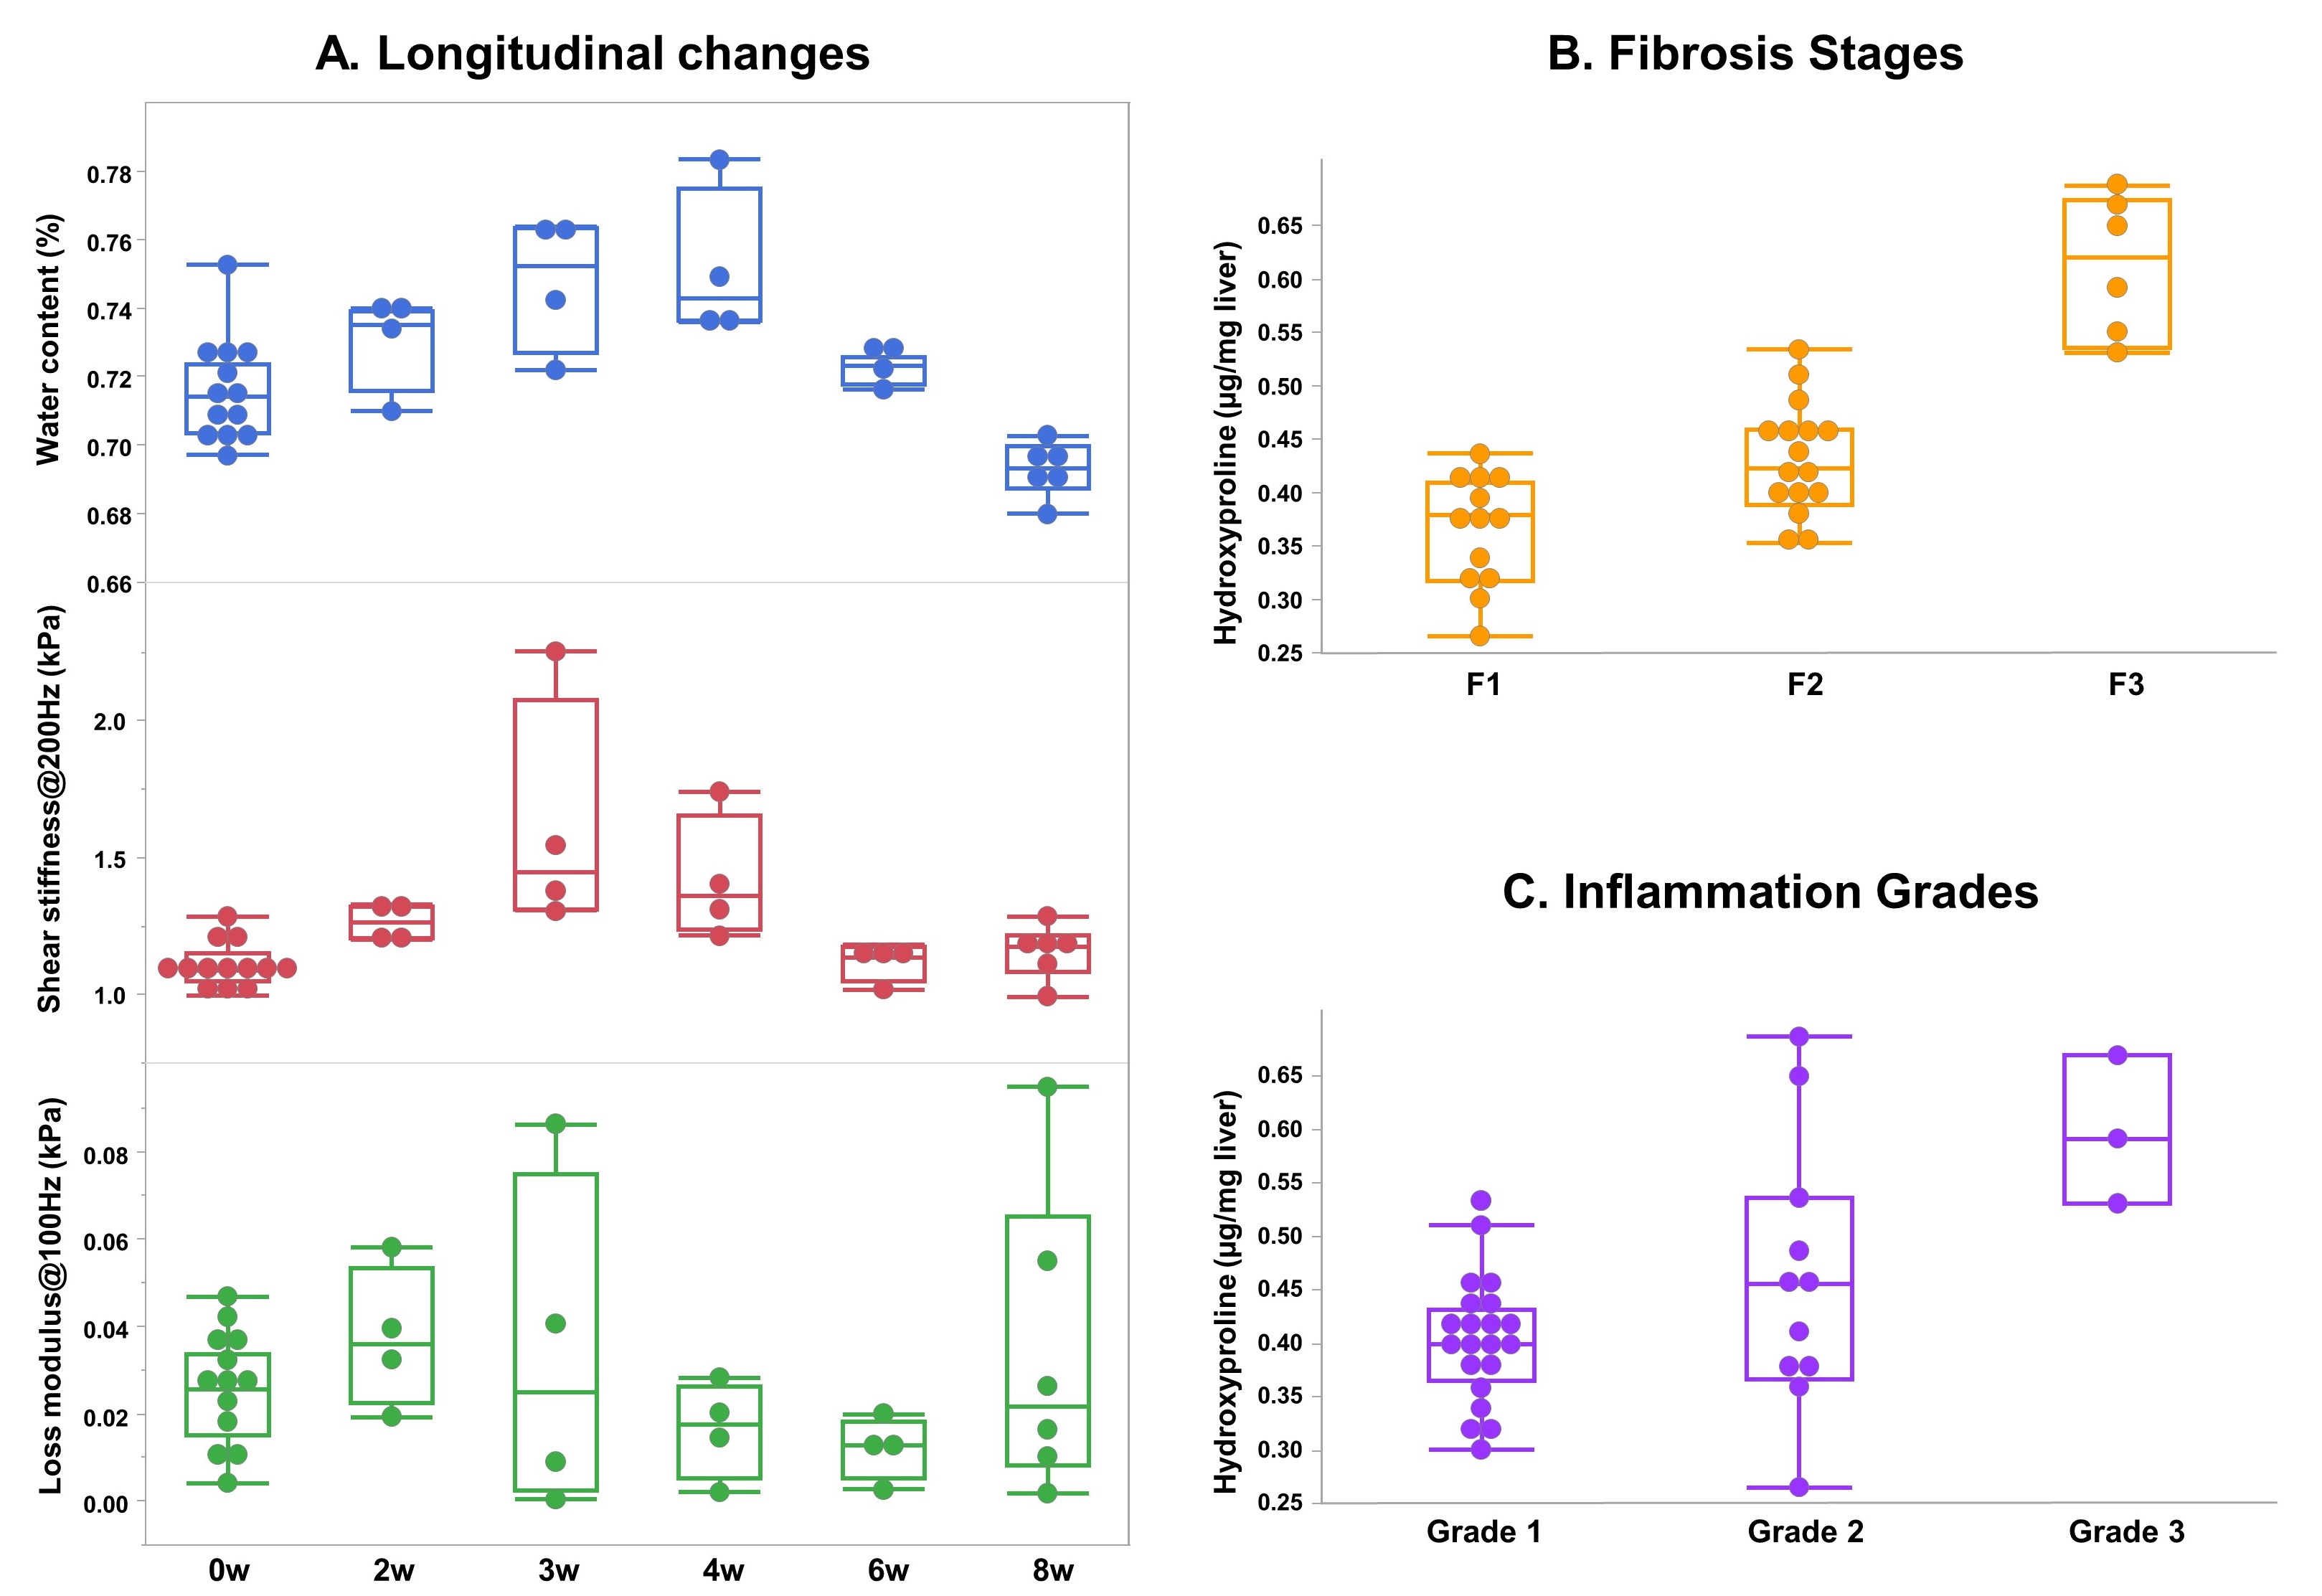
Figure 2. Changes of water content, SS, LM, and hydroxyproline in CCl4 mouse model Figure 2A. shows the longitudinal changes of water content, SS, and LM at different endpoint in CCl4 mouse model. Figure 2B and 2C show the changes of hydroxyproline with fibrosis stages and inflammation grades in all mice. PDFF, proton density fat fraction; SS, shear stiffness; LM, loss modulus.
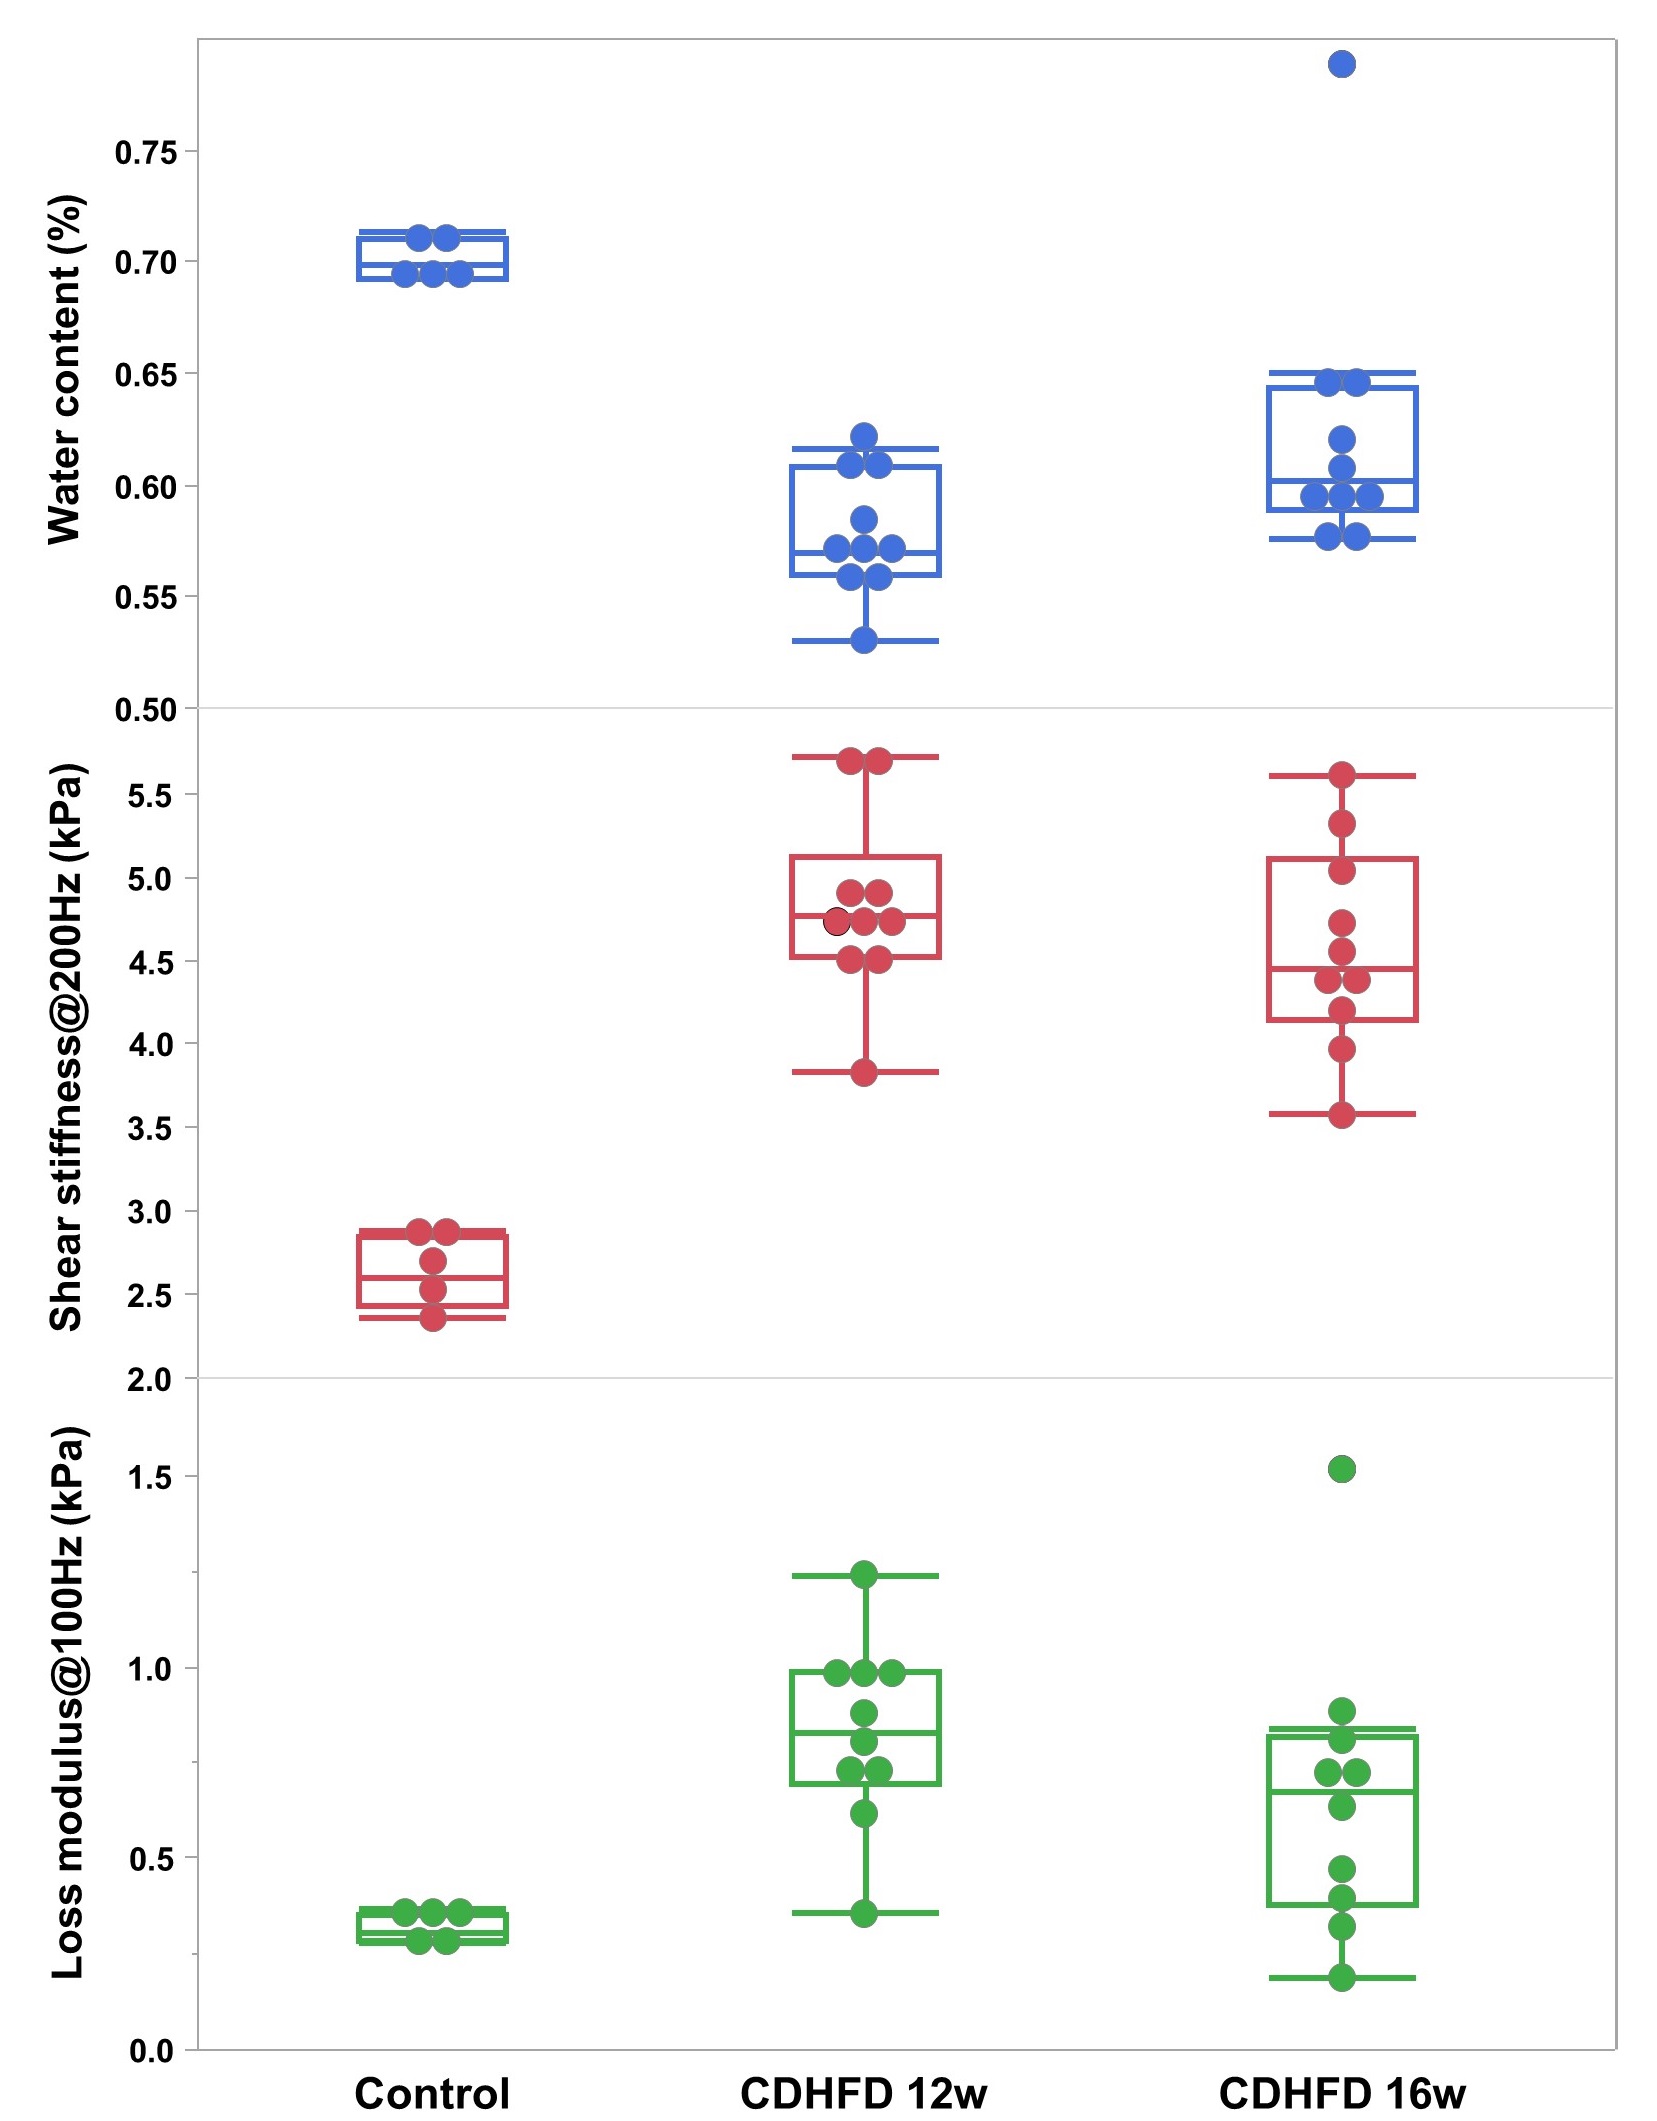
Figure 3. Group comparisons of water content, SS, and LM in NAFLD rat model
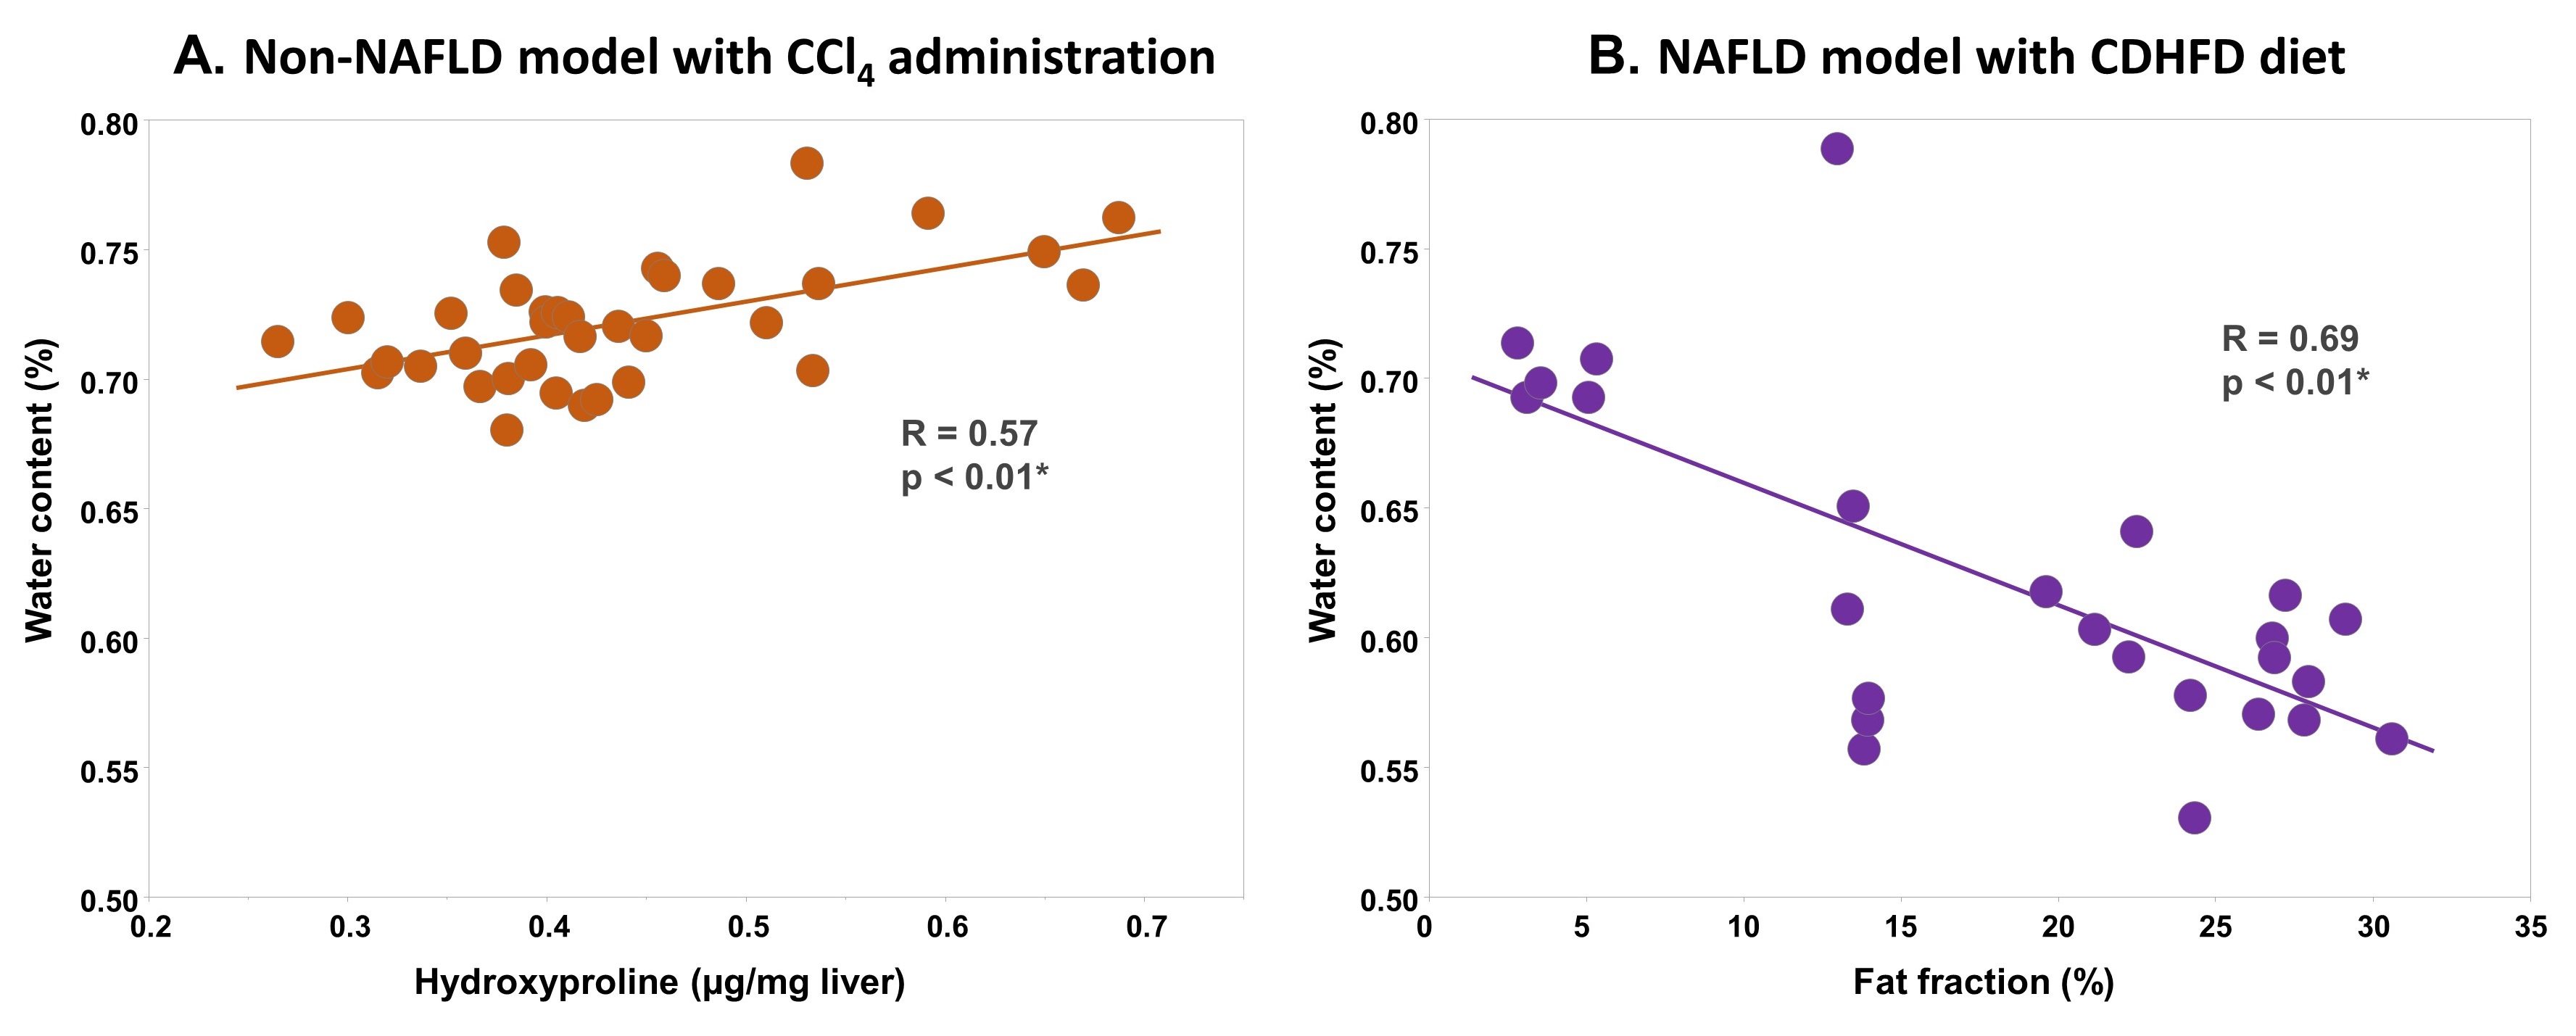
Figure 4. Correlations between water content and hydroxyproline or fat fraction