0118
Imaging the pulsatile fluid source distribution and pressure gradients in the brain using a poroelastic model and intrinsic pulsatile motions.1Dartmouth College, Hanover, NH, United States, 2Dartmouth-Hitchcock Medical Center, Lebanon, NH, United States
Synopsis
The pulsatile tissue motions from the cardiac cycle can be imaged using retrospectively gated phase contrast MRI. Modeling brain tissue as a poroelastic material allows a distribution of pulsatile fluid sources to be computed which reproduce the measured motions by estimating the RHS vector of a finite element representation of the poroelastic system. This Fluid source imaging (FSI) represents a completely new type of image parameterization that could offer unique diagnostic signatures. The associated pressure field gradients are also the driving force for interstitial fluid movement, where disruptions are thought to cause buildup of waste products which leads to dementia.
INTRODUCTION
Fluid flow within the brain is currently thought to be critical in the genesis of dementia1–6. Aberrations in interstitial fluid (ISF) flow reduce clearance of waste products from the brain through the glymphatic system, and the resulting buildup of waste products leads to dementia. ISF flow is also known to influence drug delivery to solid tumors dramatically7. Measurement methods for ISF movement are limited. The “gold standard” is intrathecal gadobutrol contrast enhanced MRI8 which is invasive and not commonly performed outside of neurosurgery9. Less invasive estimates of CSF flow made with phase-contrast MRI are related but lack a direct link to ISF flow and molecular clearance10. Intravascular Gd also correlates with molecular clearance11, but also lacks a direct link. More complex methods using MRI to estimate the spectrum of fluid flow in the brain12,13 have potential are challenging to implement in vivo. The difficulties in measuring fluid flow directly in the brain render any flow properties valuable to our understanding. Fluid flow is governed by pressure gradients and resistance to fluid flow, and accordingly, any information on either component is extremely useful to our understanding of fluid flow in the human brain. The ability of blood to flow is related to blood vessel size whereas the ability of ISF to flow is related to size of the interstitial space and the number of glycoproteins inhibiting flow. Nonetheless, the pressure source driving all fluid flows is likely to be similar: it is the cardiac pressure. Brain structures are not capable of sustaining a pressure gradient over a small distance; hence, the pressure that drives blood flow through capillaries is very close to the pressure that drives ISF flow. These conditions make pressure gradients measured using blood relevant to ISF flow as well.METHODS
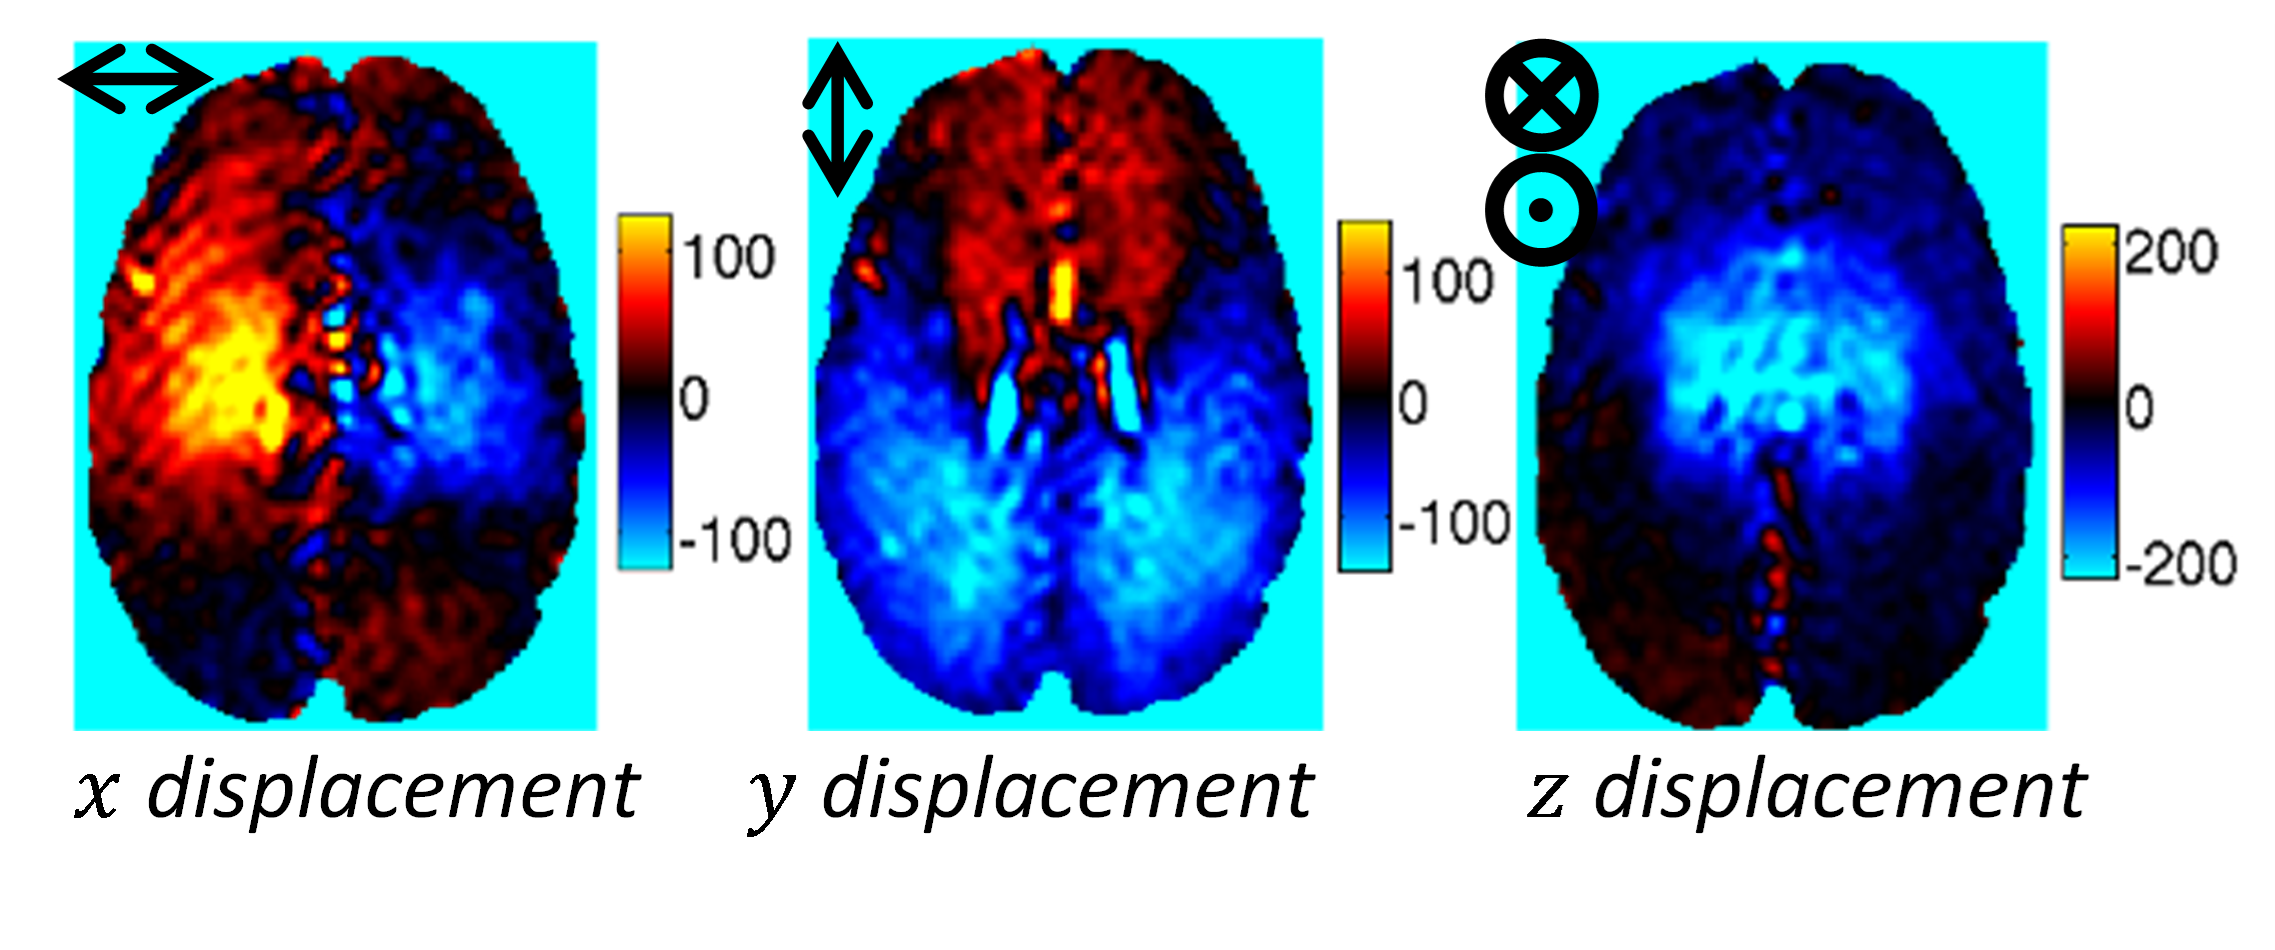
Brain tissue is modeled as a poroelastic continuum, with a porous elastic matrix fully saturated in an infiltrating pore fluid. The steady-state harmonic form representing repeated pulsatile flow14 is given by $$∇∙(μ(∇u ⃗+ ∇u ⃗^T ))+∇(λ ∇∙u ⃗ )-(1-β)∇P=-ω^2 (ρ-βρ_f ) u [1a]$$ $$∇∙(β∇P)+ρ_f ω^2 ∇∙((1-β) u ⃗ )=iωρ_f γ [1b]$$ $$β=ωϕ^2 ρ_f κ/(iϕ^2+κω(ρ_a +ϕ_p ρ_f ) ) [1c]$$ Here, the shear modulus, μ, Lame parameter, λ, and solid displacement field, u are properties of the porous solid phase, ρ, ρf and ρa are the bulk, fluid and apparent densities, and the coupling of the solid and fluid phases are described by hydrodynamic parameters including pore fluid pressure field, P, porosity, Φ, hydraulic conductivity, κ, and fluid source, γ. Fluid moves through the matrix in response to a pressure gradient, governed by the hydraulic conductivity, which is the proportionality constant in Darcy’s law, $$$q ⃗=κ∇P$$$. As the fluid moves, coupling terms in Eq 1 cause the elastic matrix to deform. Retrospectively gated phase contrast MRI can be used to measure three-dimensional pulsatile motion fields. Taking the first harmonic gives the bulk movement of tissue in response to the pulsatile flow field, illustrated in figure 1. Intrinsic actuation MR elastography (IA-MRE)15 uses these measurements to produce images of the poroelastic shear moduli and hydraulic conductivity, and assumes the fluid source term, γ, is zero. Fluid Source Imaging (FSI): Rather than estimating a mechanical property distribution that matches the computational model to the measured pulsatile data (as in IA-MRE), mechanical and hydrodynamic properties are prescribed, and the driving endogenous source distribution responsible for generation of the measured motion (γ in Eq 1) is computed on a spatial scale commensurate with the model discretization. FSI represents a completely new type of image parameterization likely associated with vascular density that could offer a unique diagnostic signature. The fluid source is estimated using Generalized least squares (GLS)16, which minimizes $$Ω=b^T W_b b+(u_c-u_m )^T W_δ (u_c-u_m )^T$$, subject to the constraint of u and b satisfying the finite element system, [K]{u}={b}. $$$W_b$$$ and $$$W_δ$$$ are weighting matrices which are the inverse prior covariances of b and the model-data misfit, $$$δ=(u_c-u_m )$$$, respectively, and can be used to control which terms of b to estimate – internal elements are body forces and fluid sources, γ, for the solid (Eq 1a) and fluid (Eq 1b) equations, respectively, whereas elements at boundary locations in the fluid equation represent unknown fluid boundary conditions. GLS is a linear problem with a direct solution possible through the method of unit responses, or a memory-efficient solution using conjugate gradient iteration.RESULTS
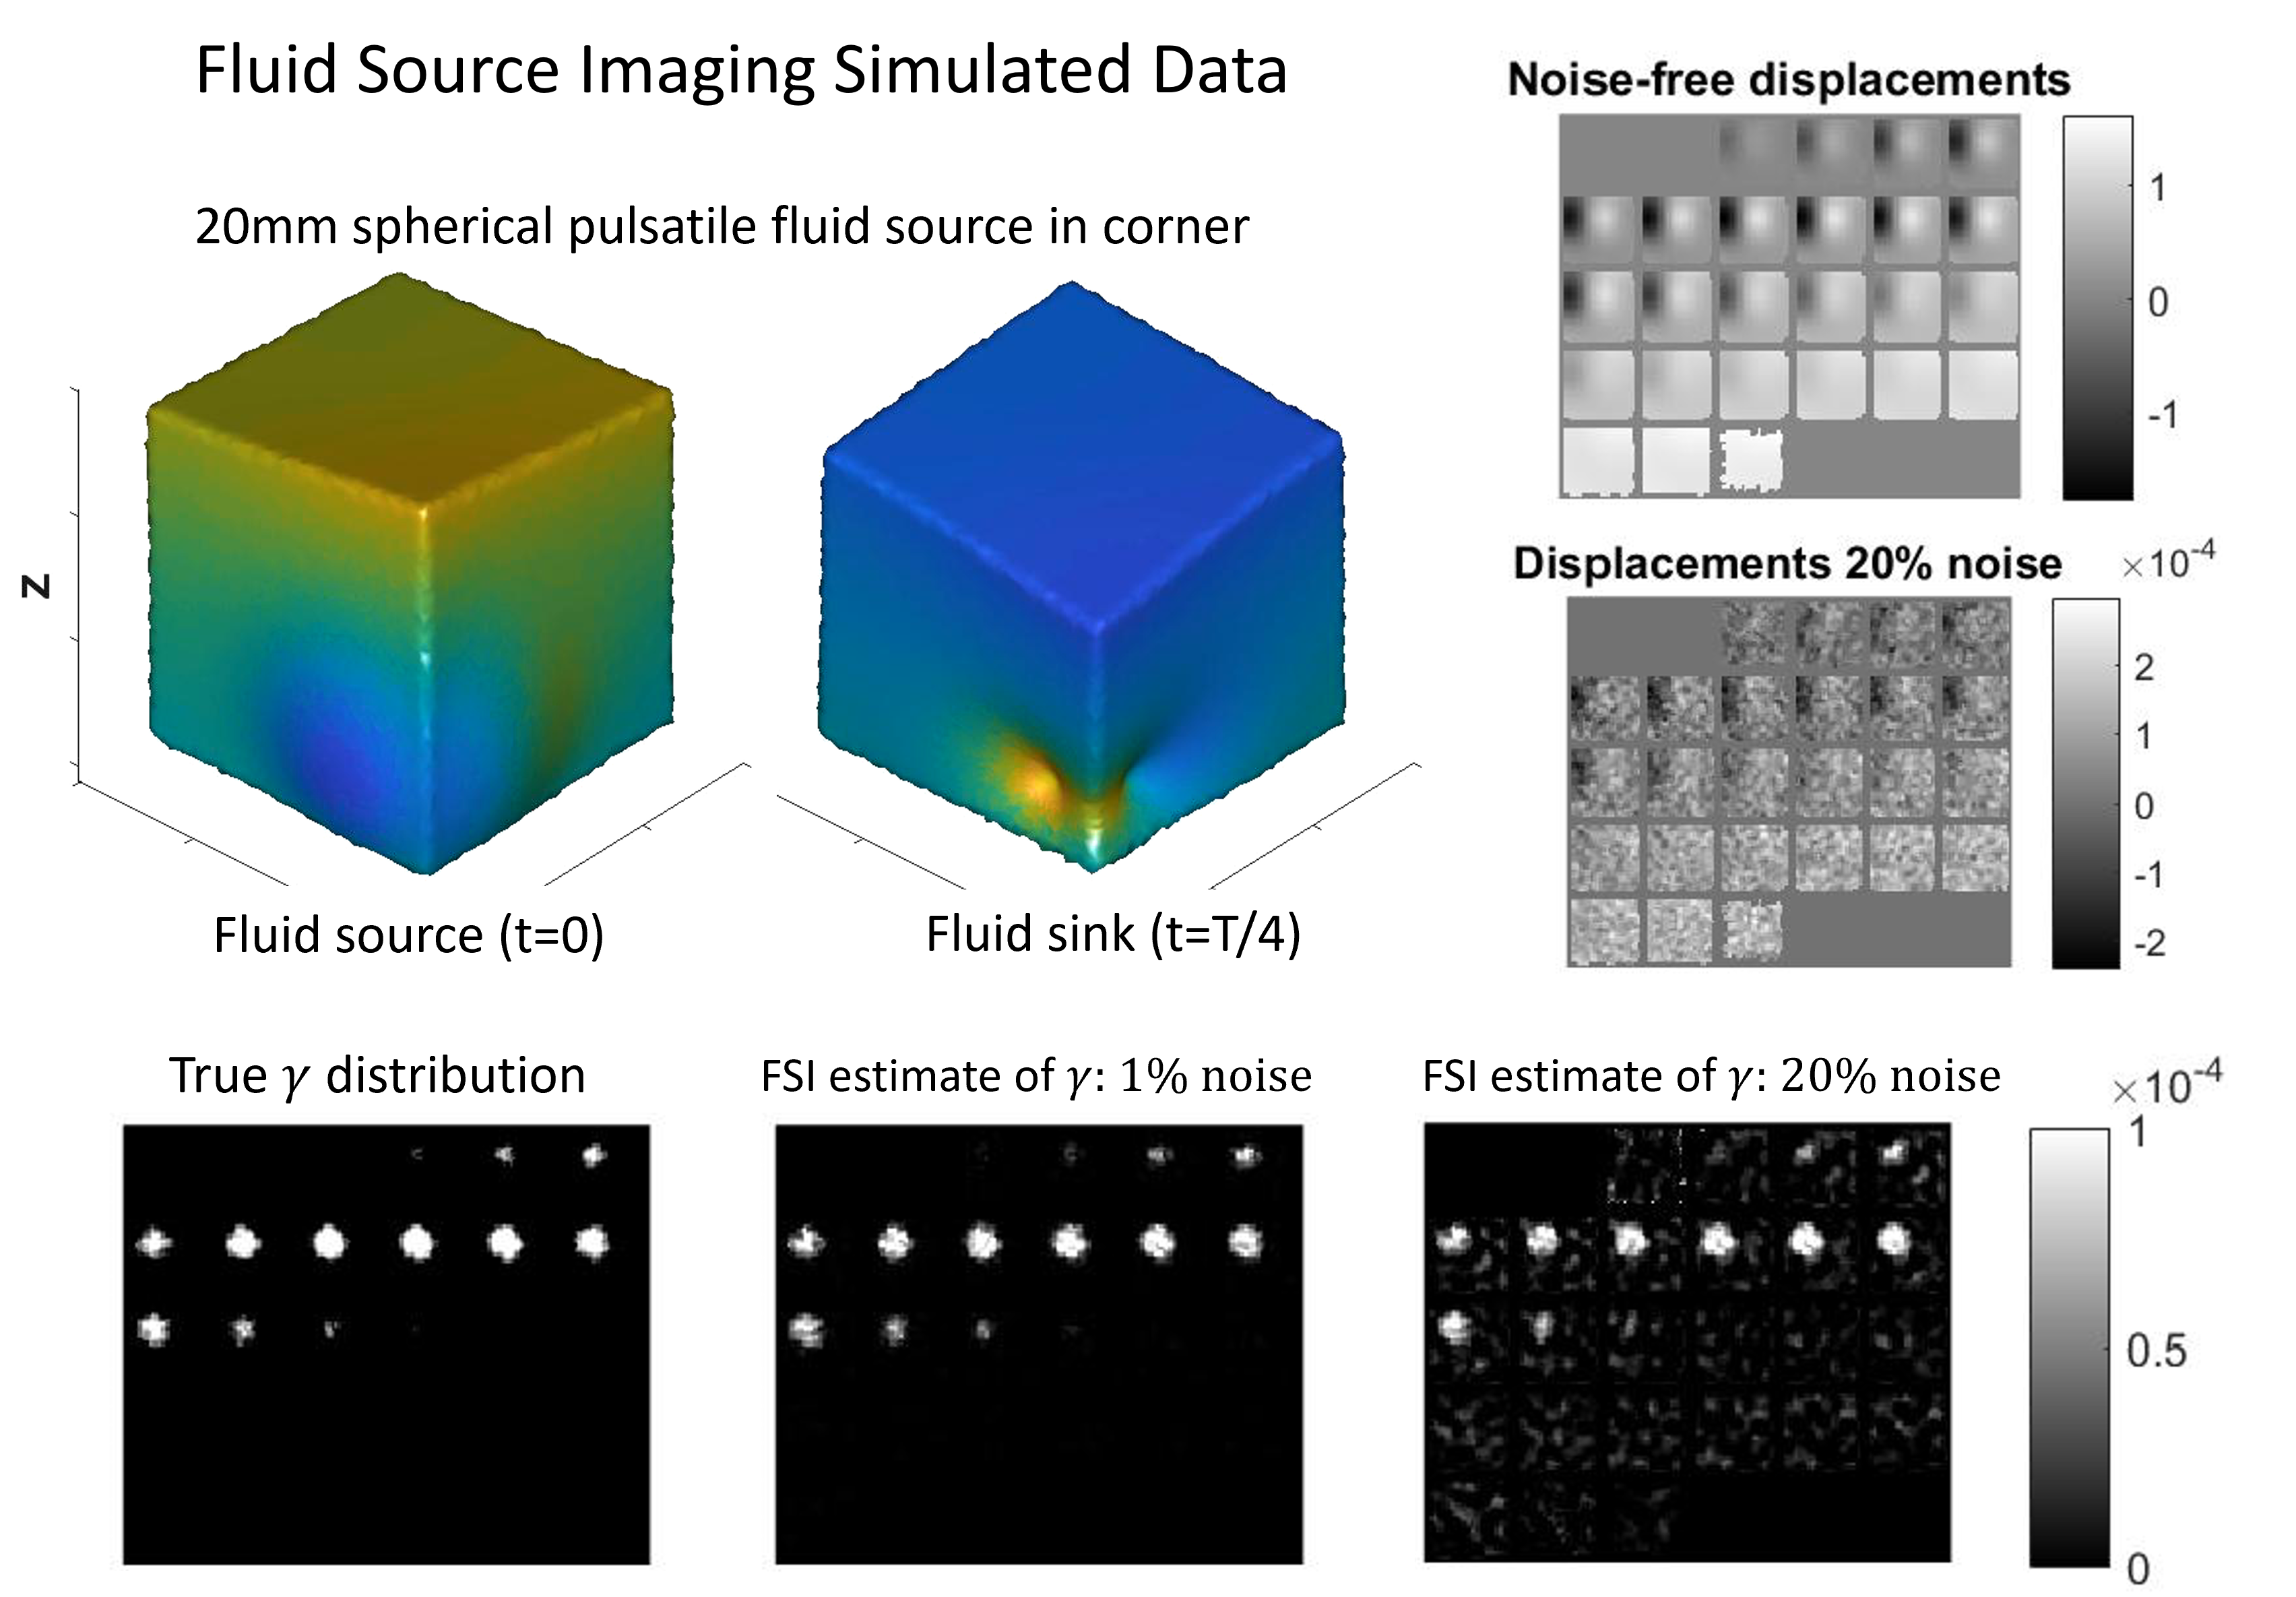
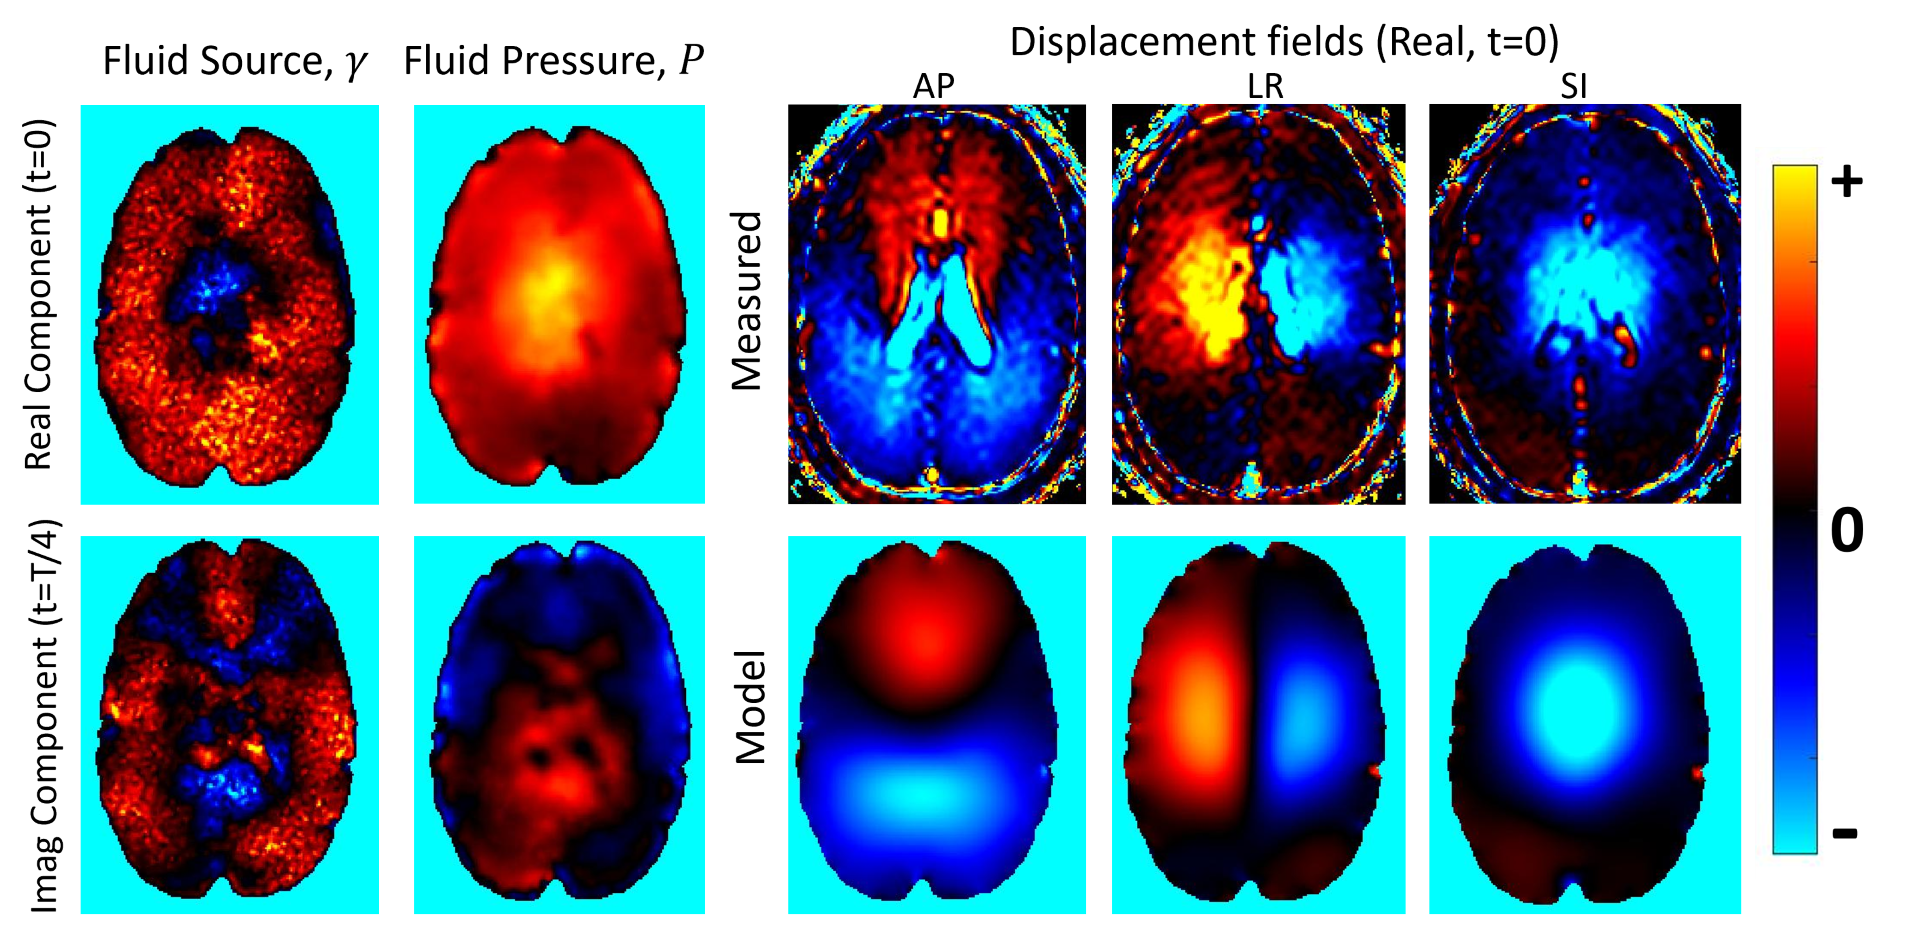
Figure 2 shows a fluid source simulation where FSI was able to accurately recover the unknown source distribution from simulated pulsatile motion data, even with 20% simulated Gaussian noise added to the motions data. Figure 3 shows FSI results in a disease-free human brain. Figure 4 shows the gradient of the associated pressure field, which is the driving force for ISF flow.DISCUSSION
Estimations of pressure gradient and interstitial fluid flow, along with the physical parameters defining their relationship are central to exploring the most widely accepted hypothesis on the genesis of dementia. Early identification of these conditions is crucial to effective interventions with next-generation therapeutic agents17,18. Estimating pressure gradients and other factors driving ISF flows noninvasively could provide new and sensitive diagnostic indicators of dementia and shed new light on the early stages of disease.Acknowledgements
R01EB018230-04References
1. Iliff JJ, Wang M, Liao Y, et al. A paravascular pathway facilitates CSF flow through the brain parenchyma and the clearance of interstitial solutes, including amyloid β. Sci Transl Med. 2012;4(147):147ra111-147ra111. doi:10.1126/scitranslmed.3003748
2. Linninger A a, Somayaji MR, Erickson T, Guo X, Penn RD. Computational methods for predicting drug transport in anisotropic and heterogeneous brain tissue. J Biomech. 2008;41(10):2176-2187. doi:10.1016/j.jbiomech.2008.04.025
3. Ribeiro EB, D’Ottaviano Cobos L, Rabelo NN, Frigeri G, Carvalho Vale FA. Intracranial pressure waveform changes in Alzheimer’s disease and mild cognitive impairment. Surg Neurol Int. 2021;12(172). doi:10.25259/SNI_48_2021
4. Ding H, Li Y, Wen M, Liu X, Han Y, Zeng H. Elevated intracranial pressure induces IL-1β and IL-18 overproduction via activation of the NLRP3 inflammasome in microglia of ischemic adult rats. Int J Mol Med. 2021;47(1):183-194. doi:10.3892/ijmm.2020.4779
5. Diomedi M, Rocco A, Bonomi CG, et al. Haemodynamic impairment along the Alzheimer’s disease continuum. Eur J Neurol. 2021;28(7):2168-2173. doi:10.1111/ene.14834
6. Tarasoff-Conway JM, Carare RO, Osorio RS, et al. Clearance systems in the brain - Implications for Alzheimer disease. Nat Rev Neurol. 2015;11(8):457-470. doi:10.1038/nrneurol.2015.119
7. Jain RK, Boucher Y, Wolmark N. Interstitial Hypertension in Human Breast and Colorectal Tumors. Cancer Res. 1992;52(22):6371-6374.
8. Eide PK, Vinje V, Pripp AH, Mardal KA, Ringstad G. Sleep deprivation impairs molecular clearance from the human brain. Brain. 2021;144(3):863-874. doi:10.1093/brain/awaa443
9. Halvorsen M, Edeklev CS, Fraser-Green J, et al. Off-label intrathecal use of gadobutrol: safety study and comparison of administration protocols. Neuroradiology. 2021;63(1):51-61. doi:10.1007/s00234-020-02519-4
10. Eide PK, Valnes LM, Lindstrøm EK, Mardal KA, Ringstad G. Direction and magnitude of cerebrospinal fluid flow vary substantially across central nervous system diseases. Fluids Barriers CNS. 2021;18(1):1-18. doi:10.1186/s12987-021-00251-6
11. Cai X. The Application of Multimodal MRI in the Identification of Neurological Biomarkers for Parkinson’s Disease and the Investigation of the Role of Glymphatic System in the Development of Parkinsonism. Published online 2020.
12. Benjamini D, Komlosh ME, Williamson NH, Basser PJ. Generalized mean apparent propagator MRI to measure and image advective and dispersive flows in medicine and biology. IEEE Trans Med Imaging. 2019;38(1):11-20. doi:10.1109/TMI.2018.2852259
13. Komlosh ME, Benjamini D, Williamson NW, Horkay F, Hutchinson EB, Basser PJ. A novel MRI phantom to study interstitial fluid transport in the glymphatic system. Magn Reson Imaging. 2019;56:181-186. doi:10.1016/j.mri.2018.10.007
14. Perriñez PR, Kennedy FE, Van Houten EEW, Weaver JB, Paulsen KD. Modeling of soft poroelastic tissue in time-harmonic MR elastography. IEEE Trans Biomed Eng. 2009;56(3):598-608. doi:10.1109/TBME.2008.2009928
15. Weaver JB, Pattison AJ, McGarry MDJ, et al. Brain mechanical property measurement using MRE with intrinsic activation. Phys Med Biol. 2012;57(22):7275-7287. doi:10.1088/0031-9155/57/22/7275
16. Lynch D. Numerical Partial Differential Equations for Environmental Scientists and Engineers: A First Practical Course.; 2004.
17. Fan DY, Wang YJ. Early Intervention in Alzheimer’s Disease: How Early is Early Enough? Neurosci Bull. 2020;36(2):195-197. doi:10.1007/s12264-019-00429-x
18. Barnett JH, Lewis L, Blackwell AD, Taylor M. Early intervention in Alzheimer’s disease: A health economic study of the effects of diagnostic timing. BMC Neurol. 2014;14(1):1-9. doi:10.1186/1471-2377-14-101
Figures