0116
Free-Breathing Liver QSM with High Isotropic Resolution Using Respiratory Motion-Resolved 3D Multi-Echo Cones MRI1Department of Medical Physics, Memorial Sloan Kettering Cancer Center, New York, NY, United States, 2Department of Biomedical Engineering, Ulsan National Institute of Science and Technology, Ulsan, Korea, Republic of, 3Department of Radiology, Memorial Sloan Kettering Cancer Center, New York, NY, United States
Synopsis
Liver quantitative susceptibility mapping (QSM) can provide a direct measurement of liver iron concentration (LIC). However, respiratory motion and rapid T2* decay are the major challenges in reliable liver QSM. To address these issues a motion-resolved multi-echo 3D cones MRI method with pseudo-random view ordering was implemented, which was then compared with a multi-echo Cartesian GRE sequence in a phantom and healthy volunteer. The proposed motion-resolved cones QSM presented strong motion-robustness in terms of image quality and ROI-based measurements in our phantom and in-vivo studies, demonstrating the feasibility of free-breathing liver QSM.
Introduction
The feasibility of breath-held liver QSM has been previously demonstrated with conventional multi-echo Cartesian GRE sequences1,2, enabling a direct measurement of liver iron concentration. Conventional GRE sequences are performed with breath-holds, challenging for children and some adults. In addition, the range of susceptibility in liver with iron overload can be orders of magnitude higher than the brain so that the existing methods with the initial TE of ~1ms would fail to capture the rapid T2* decay. Lastly, high-resolution isotropic imaging is required to prevent QSM underestimation3, impractical with conventional Cartesian sequences due to the duration of a single breath-hold, and as a result slice thickness is compromised. This work presents a motion-resolved 3D multi-echo cones MRI for free-breathing high-resolution liver QSM.Methods
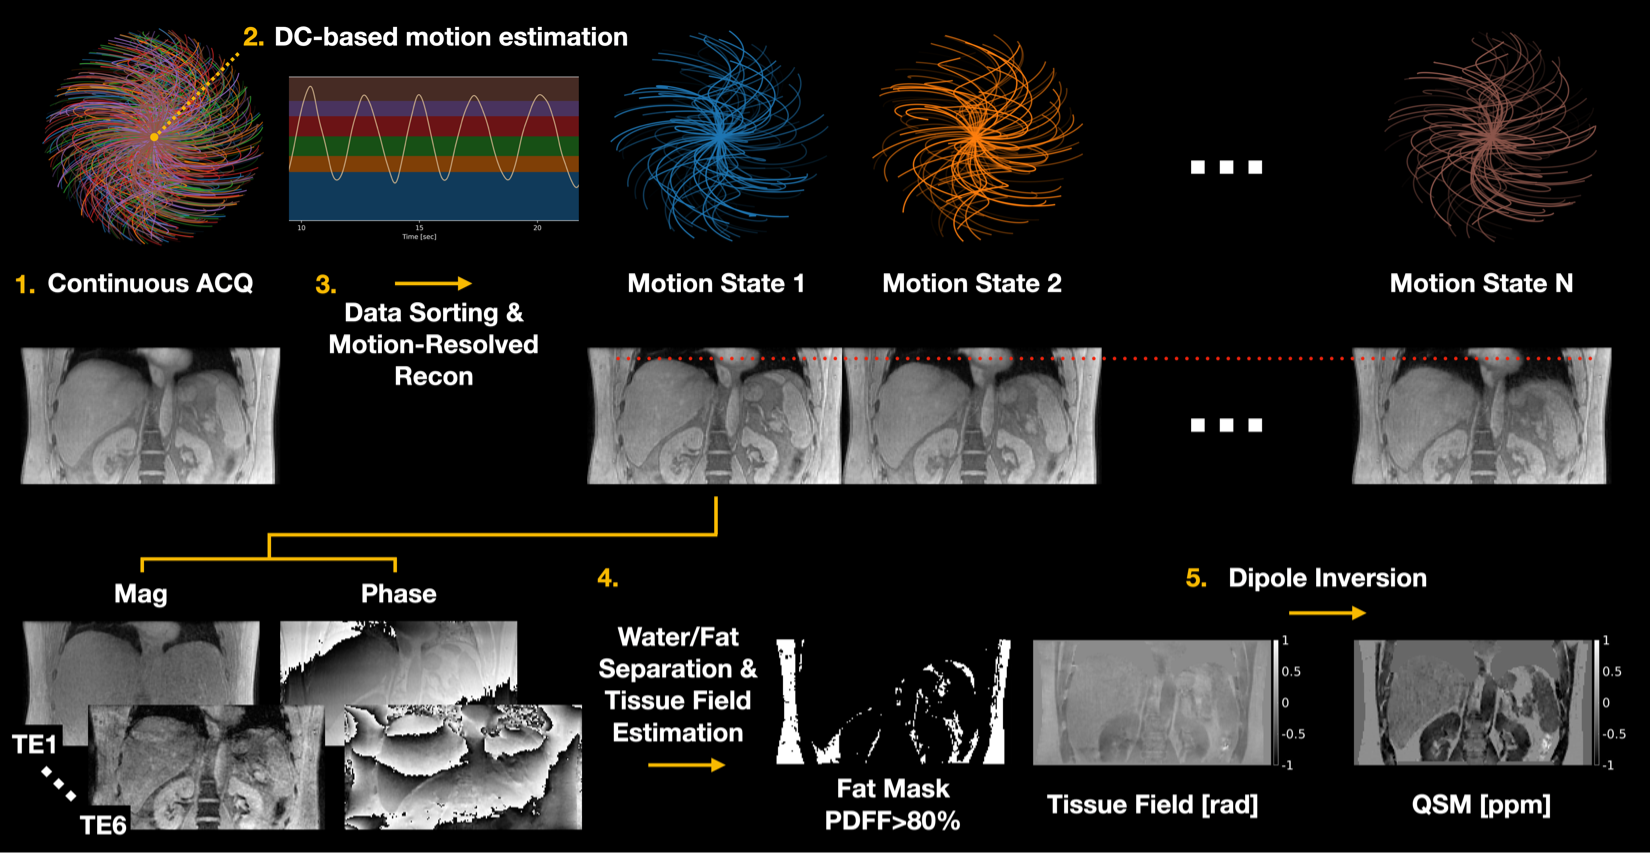
Data Acquisition and Image ReconstructionAn RF-spoiled 3D multi-echo cones MRI sequence was implemented with pseudo-random view ordering to achieve uniform k-space coverage4-6 as shown in Figure 1. Periodic motion was estimated from the k-space DC signal of the first echo. Continuously acquired cones interleaves were then binned into different motion states followed by model-based image reconstruction with temporal total variation7.
QSM Reconstruction
Complex-based nonlinear least squares fitting was performed with SPURS8 to estimate the B0-field inhomogeneity. Tissue field was then estimated from LBV9. QSM was computed by solving the following inversion problem10:
$$\hat{\chi}=Argmin_{\chi}\frac{1}{2}\|w(e^{-i(d\ast\chi)}-e^{-if})\|_2^2 +\lambda_{1}\|M_{G}\triangledown{\chi}\|_1+\lambda_{2}\|M_{fat}(\chi-\bar{\chi}_{fat})\|_2^2,$$
where $$$\chi$$$ is the desired susceptibility map, d is the dipole kernel in image space, f is the tissue field, $$$M_{G}$$$ is the gradient mask derived from the magnitude image, $$$M_{fat}$$$ is the fat mask derived from PDFF>80%, $$$\lambda_{1}$$$ and $$$\lambda_{2}$$$ are regularization parameters, and $$$\chi_{fat}$$$ is the mean of the QSM values inside the fat mask.
Phantom Experiment
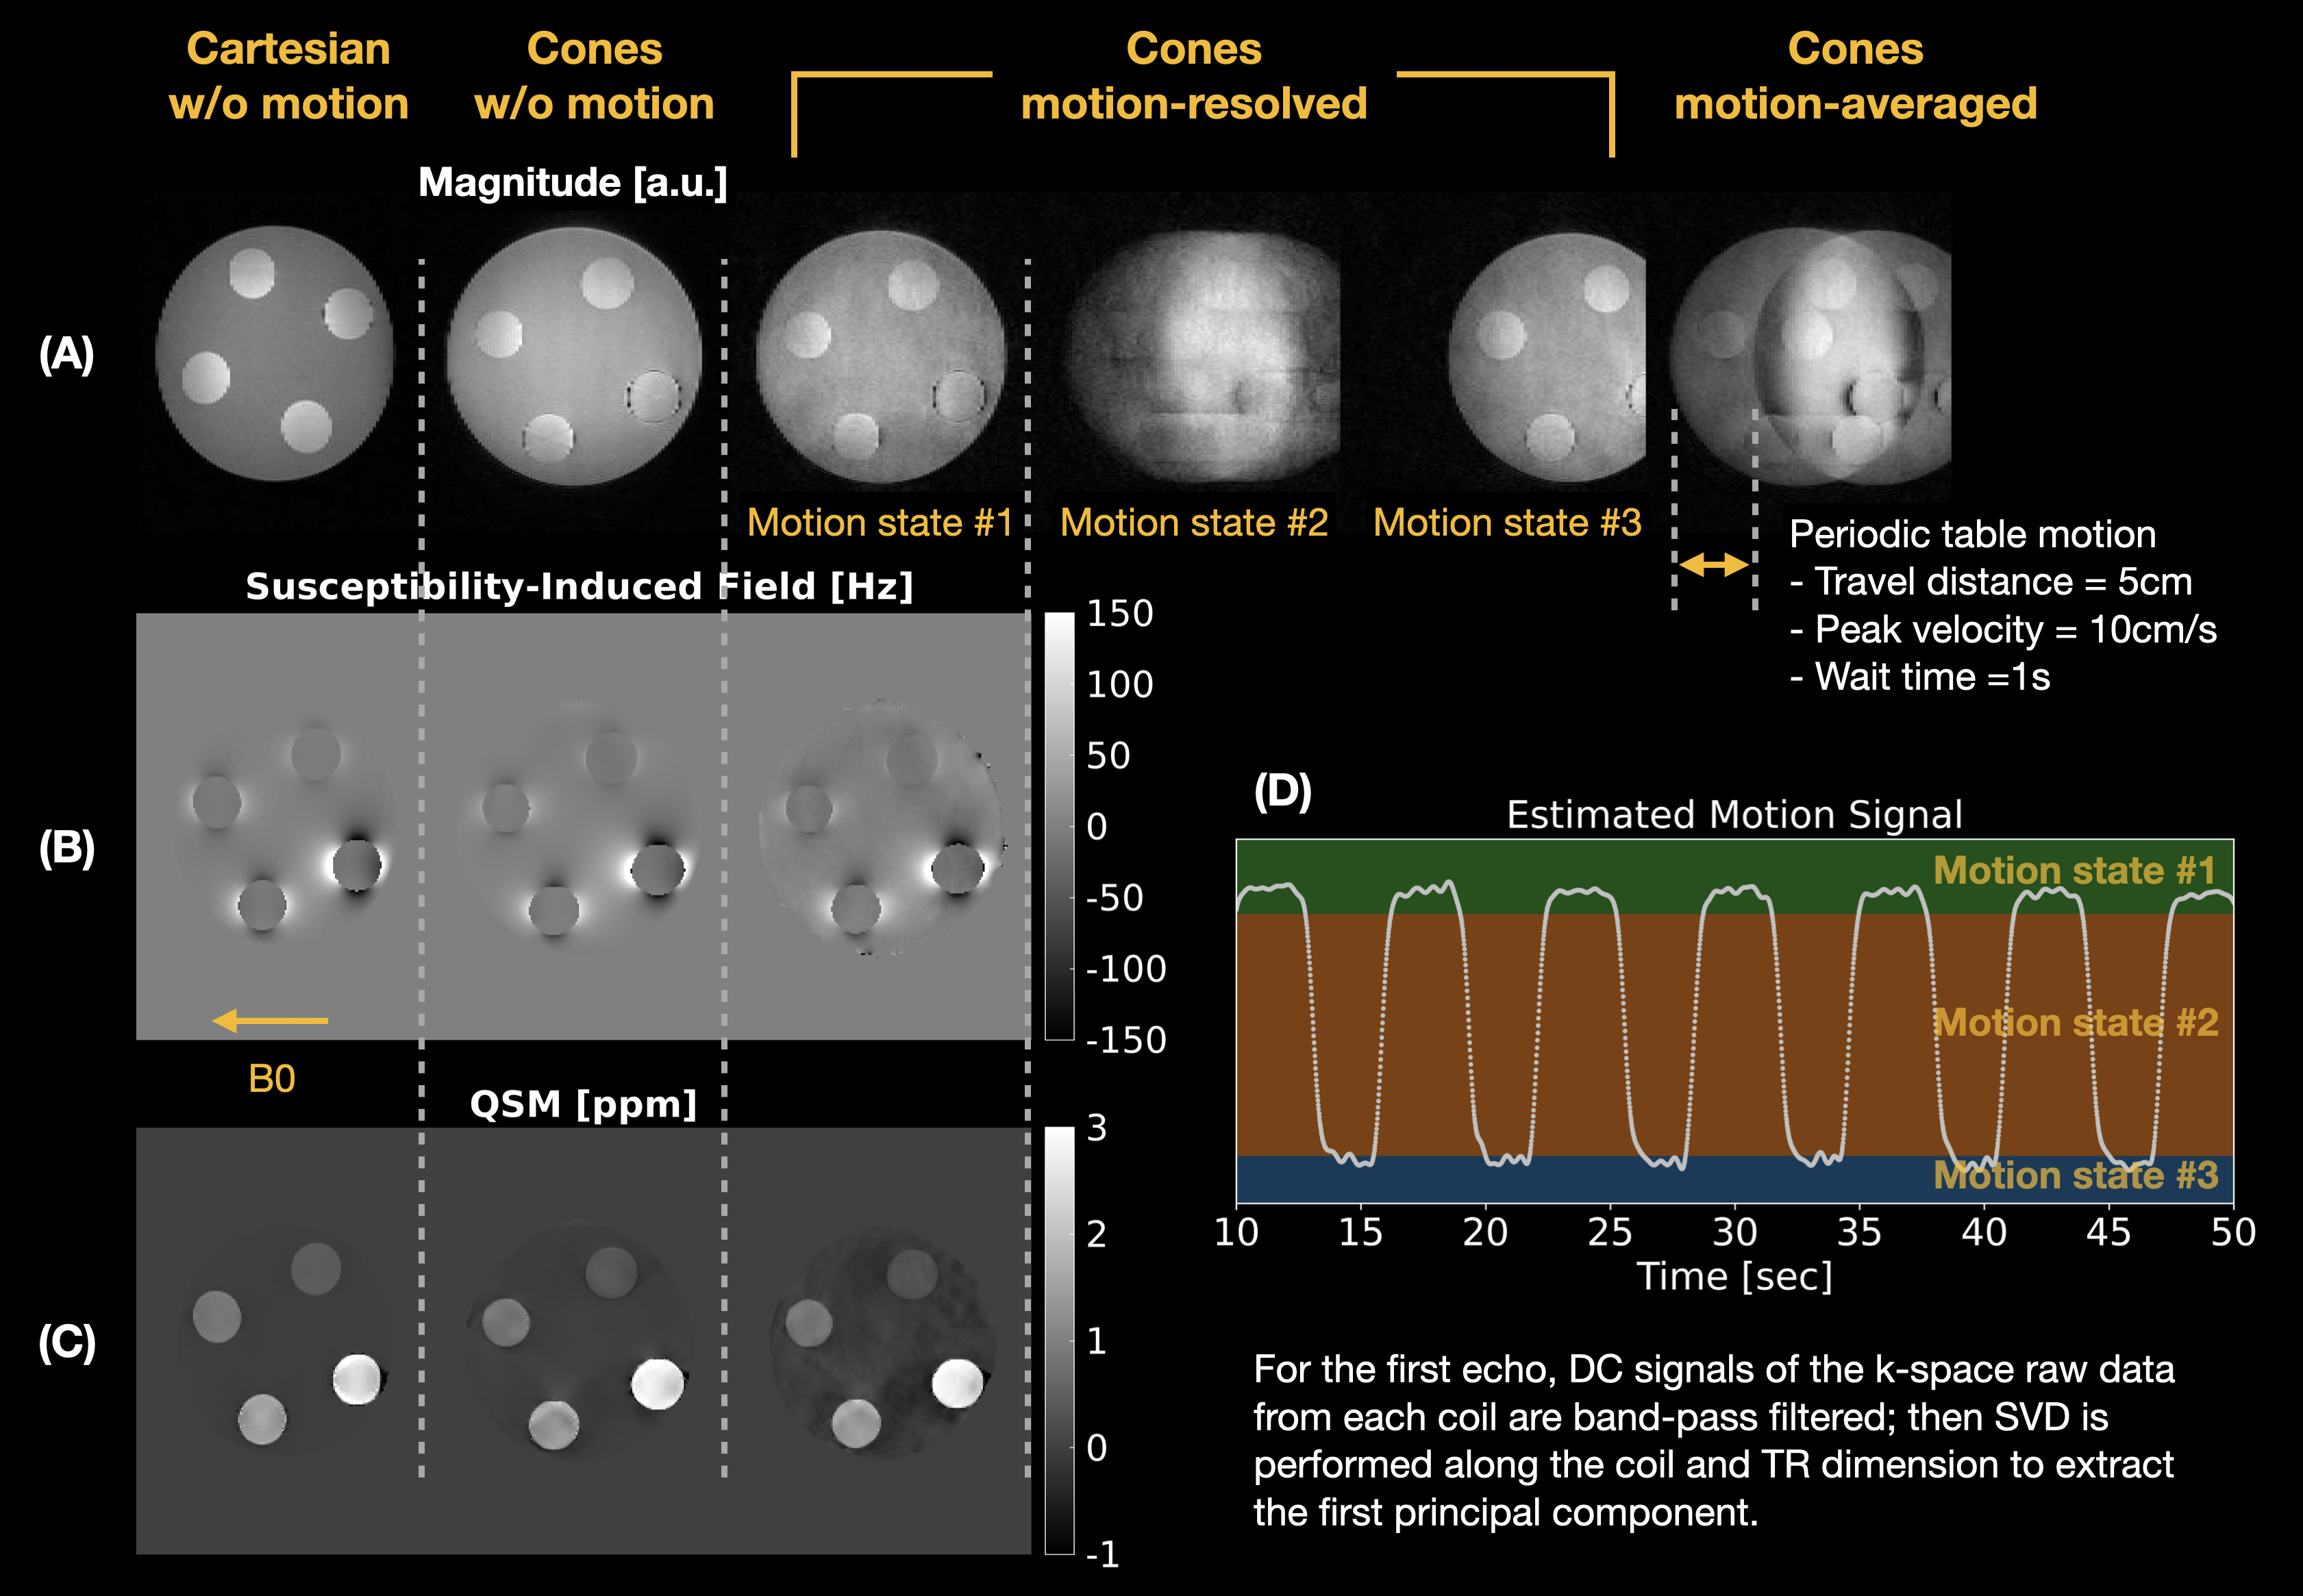
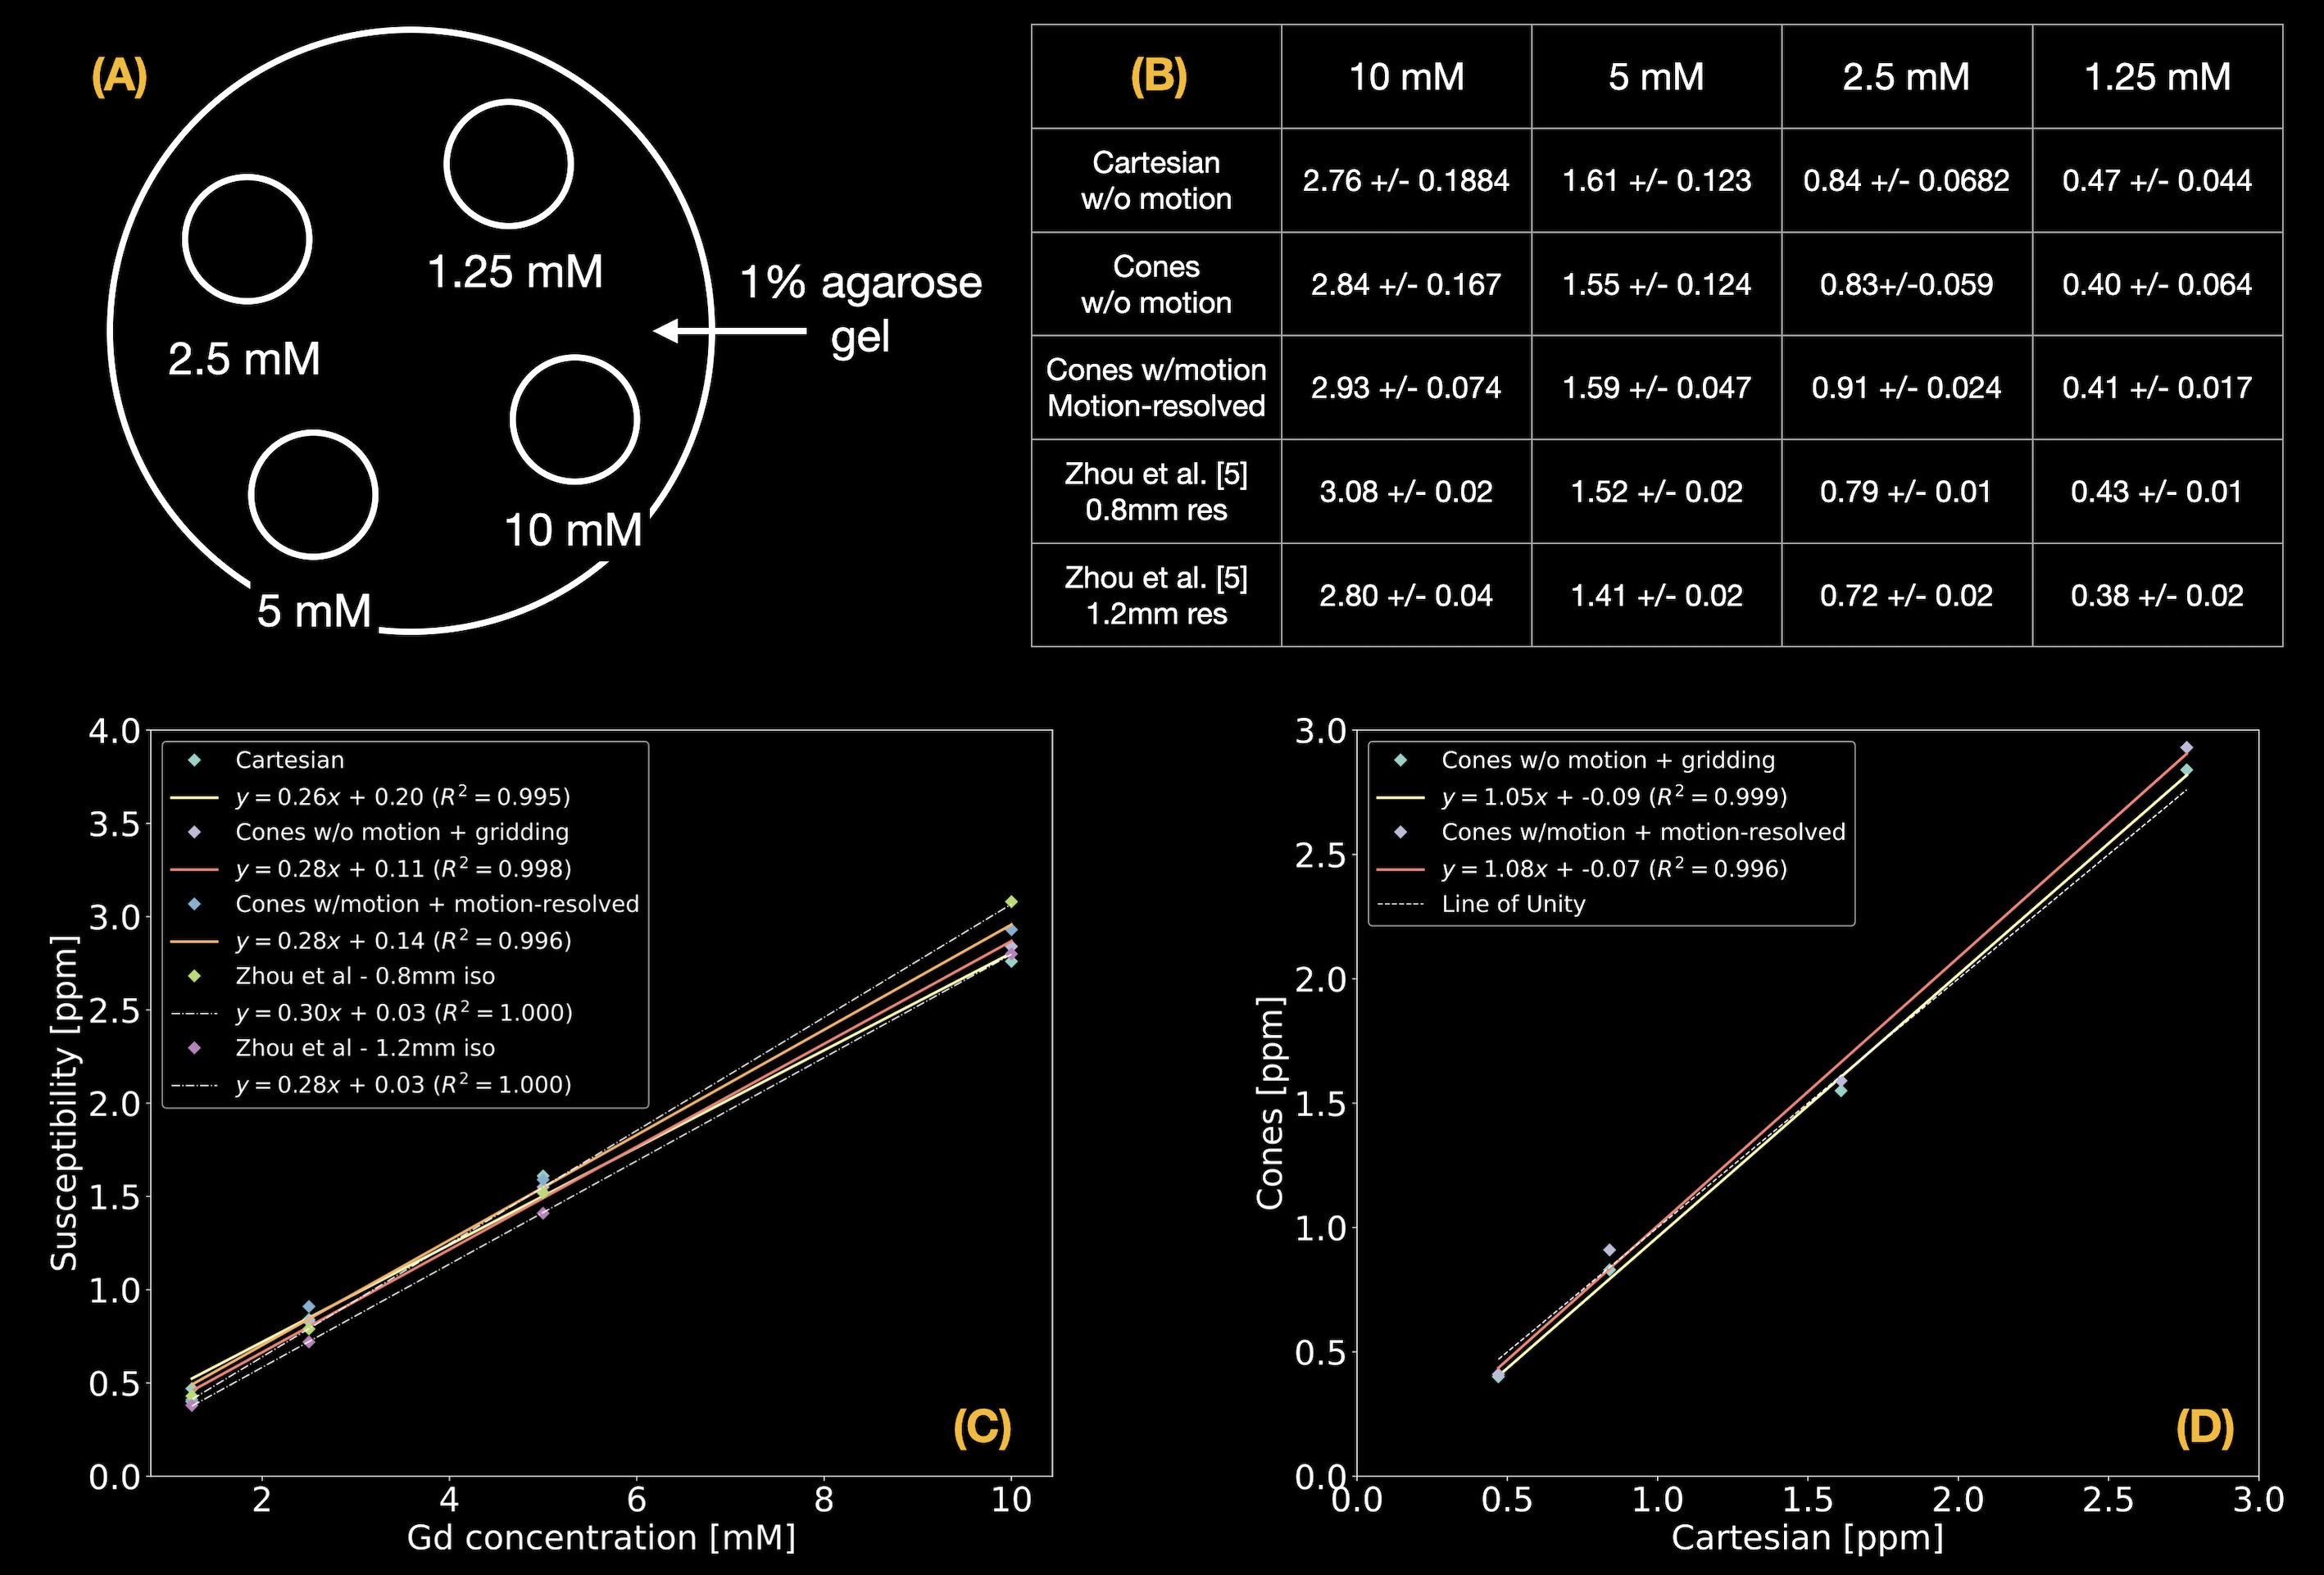
A phantom was constructed by embedding 4 latex balloons filled with serially diluted concentrations (10, 5, 2.5, and 1.25mmol/L) of gadolinium (Gadavist, Bayer Pharmaceuticals, Wayne, NJ) in a 1% agarose gel solution in a 500mL container as shown in Figure 3(A). The phantom was imaged on a 3T clinical scanner (SignaPremierXT, GE Healthcare, Waukesha, WI) using a product multi-echo 3D Cartesian GRE sequence followed by the prototype multi-echo 3D cones sequence with and without table motion as shown in Figure 2. Imaging parameters of the Cartesian acquisition were: FOV=200mm, resolution=1mm-isotropic, initial TE/TE/TR=1.1/1.02/8.3ms, #TEs=6 (ETL=3, #shots=2), FA=4°, and BW=±100kHz. Imaging parameters of the cones acquisition were: FOV=240mm, resolution=1mm-isotropic, initial TE/TE/TR=0.032/1.4/15ms, #TEs=6, FA=4°, BW=±125kHz, readout duration=~1ms, and #interleaves=~60,000. For QSM reconstruction, $$$\lambda_{1}$$$ = 0.01 and $$$\lambda_{2}$$$ = 0. ROI-based linear correlation analysis was performed, and the measurements were compared with literature values5.
In-vivo Experiment
With local IRB approval, two healthy subjects were imaged on the same 3T clinical scanner. Each subject underwent a product multi-echo 3D Cartesian GRE sequence with a breath-hold (BH Cartesian), and the prototype multi-echo 3D cones sequence with free breathing (FB Cones). Imaging parameters of BH Cartesian were (subject #2 in parenthesis): FOV=380(450)mm, in-plane acquisition resolution=2.4(2.9)×2.2(2.3), in-plane reconstruction resolution=1.7(1.5)×1.7(1.5), slice thickness=6mm, initial TE/TE/TR=0.7/0.6(0.7)/5.3(5.7)ms, #TEs=6(ETL=3, #shots=2), FA=3°, BW=±125(142.86)kHz, ACC=2×2, and scan time=~25(30) sec. Imaging parameters of FB Cones were: FOV=380(450)mm, resolution=2mm-isotropic, initial TE/TE/TR=0.032/1.4(1.5)/11.4(11.5)ms, #TEs=6, FA=3°, BW=±125kHz, cones readout duration=~1ms, #interleaves=~28,000(30,000), and scan time=~6min.
Results
Phantom ResultsReconstructed images and the estimated table motion are shown in Figure 2. The apparent SNR of cones with table motion + motion-resolved reconstruction was lower than Cartesian and cones without motion + gridding reconstruction. Overall QSM image quality was comparable with each other. ROI-based susceptibility measurements and their scatter plots reported in Figure 3 suggest that the proposed motion-resolved QSM is in good agreement with Cartesian and cones without motion as well as literature values5. The susceptibility measurements were mostly within the range of literature values of 0.8mm and 1.2mm isotropic resolution.
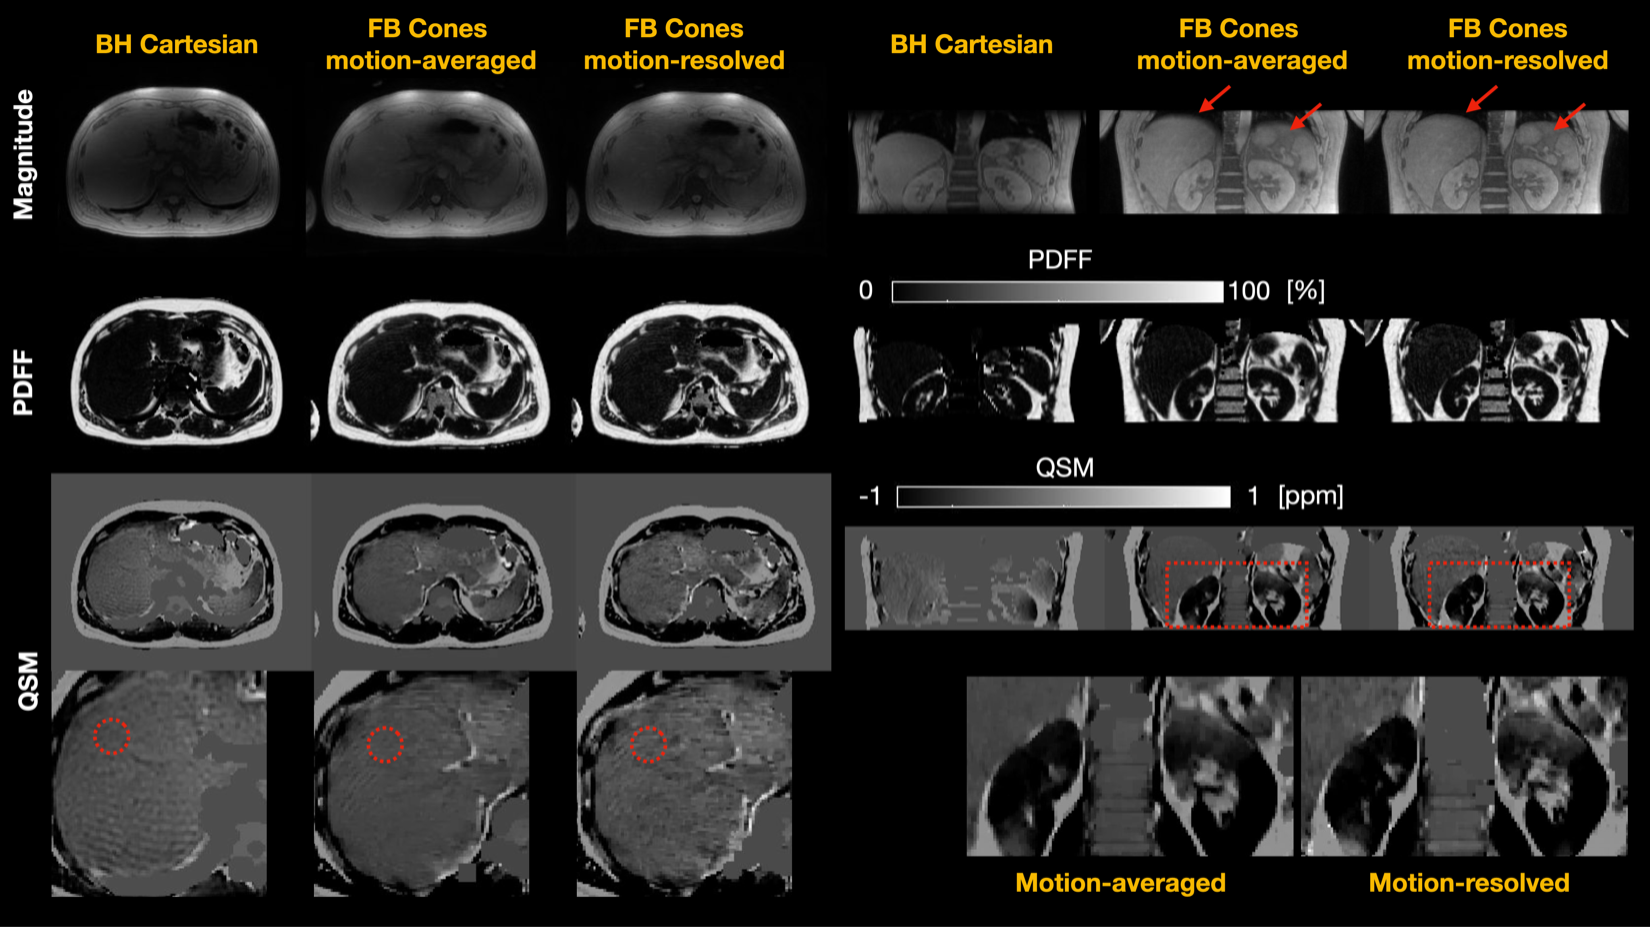
In-vivo Results
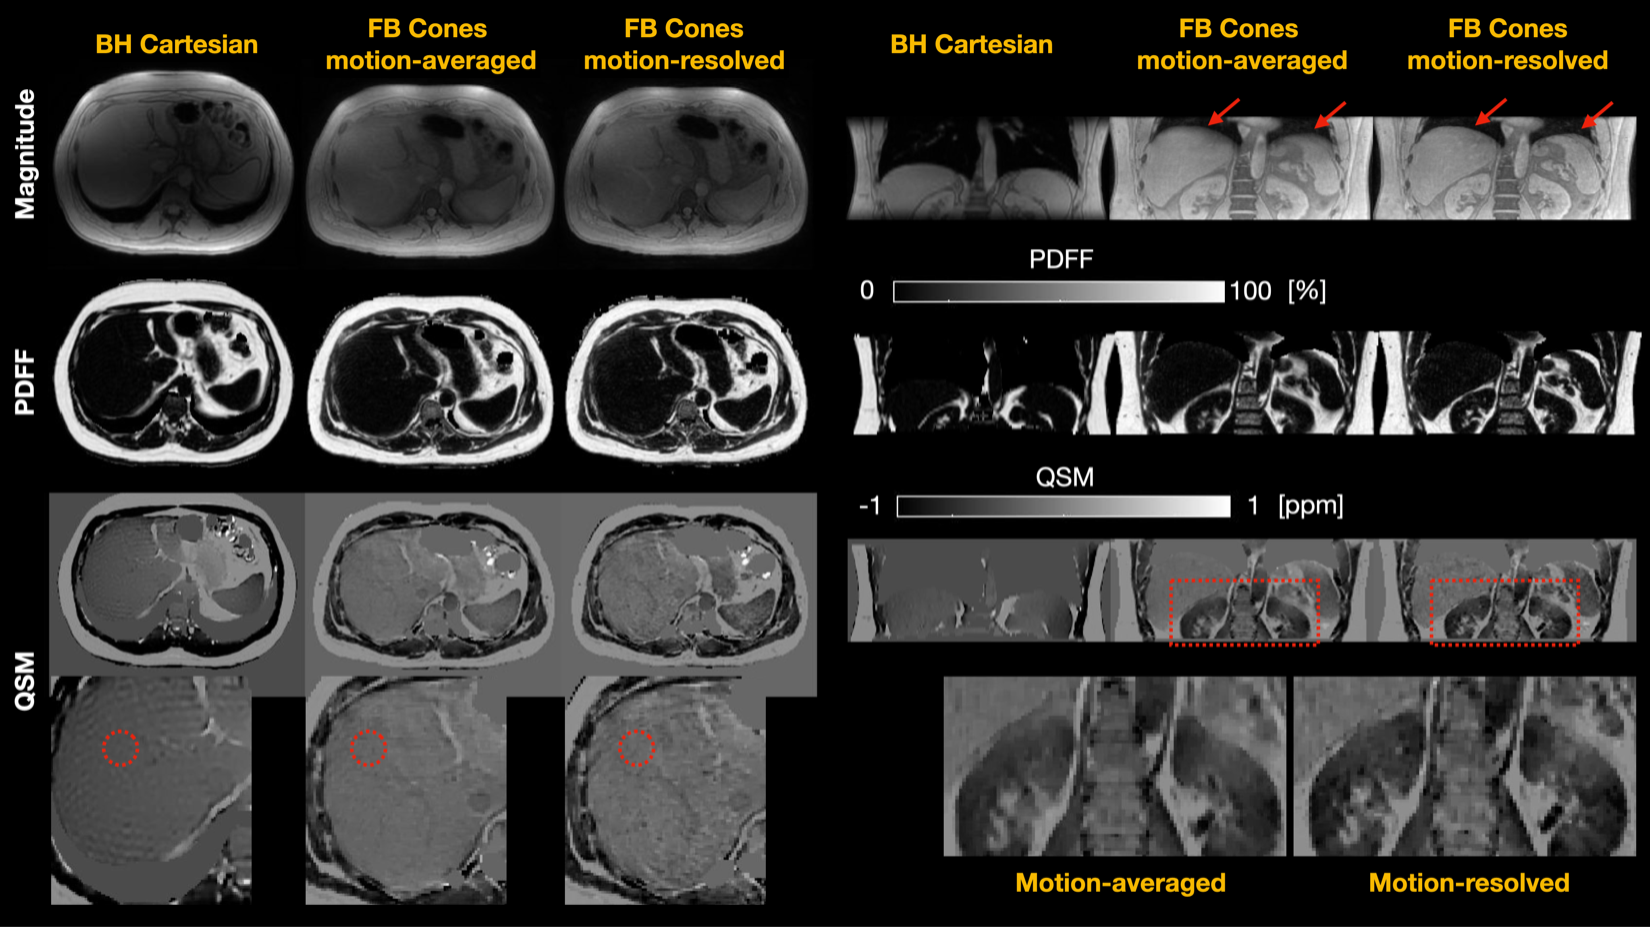
Reconstructed images for the healthy subjects #1 and #2 are shown in Figures 4 and 5, respectively. FB Cones with motion-resolved reconstruction presented improved image quality all in magnitude, PDFF, and QSM maps in axial and coronal views than FB Cones with motion-averaged reconstruction. Compared to BH Cartesian, FB Cones provided high-resolution reconstruction in coronal view. Susceptibility measurements were taken from the circular ROIs referenced to adipose fat. For the subject #1, FB Cones with and without motion-resolved reconstruction were -0.252+/-0.041 and 0.249+/-0.046, respectively. These values were greater than BH Cartesian (-0.41+/-0.026). For the subject #2, BH Cartesian, FB Cones with and without motion-resolved were -0.40+/-0.046, -0.40+/-0.041, and -0.37+/-0.053, respectively, showing a similar range of susceptibility.
Discussion
This study demonstrated the feasibility of free-breathing liver QSM with motion-resolved multi-echo 3D cones MRI, showing promising results with great motion-robustness both in phantom and in-vivo experiments. The relatively low apparent SNR of motion-resolved reconstruction may be due to suboptimized regularization parameters. Difference in QSM contrast between FB Cones and BH Cartesian in the subject #1 may be caused by suboptimized QSM reconstruction and field mapping, and discrepancy in acquisition parameters. Fat-based automatic zero referencing may be unreliable due to incorrect masking of the fat region. We will investigate time-interleaving strategy and aorta-based zero referencing2,3.Conclusion
Free-breathing liver QSM with 2mm isotropic resolution is feasible under ~6min scan time at 3T with motion-resolved multi-echo 3D cones MRI.Acknowledgements
We would like to thank Kayvan Keshari and John Humm for sharing resources to build the QSM phantom.References
[1] Sharma et al. Quantitative Susceptibility Mapping in the Abdomen as an Imaging Biomarker of Hepatic Iron Overload. MRM 2014 (doi: 10.1002/mrm.25448).
[2] Jafari et al. Rapid Automated Liver Quantitative Susceptibility Mapping. JMRI 2019 (doi: 10.1002/jmri.26632).
[3] Zhou et al. Susceptibility Underestimation in a High-Susceptibility Phantom: Dependence on Imaging Resolution, Magnitude Contrast, and Other Parameters. MRM 2016 (doi: 10.1002/mrm.26475)
[4] Gurney et al. Design and Analysis of a Practical 3D Cones Trajectory. MRM 2006 (doi: 10.1002/mrm.20796)
[5] Zucker et al. Free-Breathing Pediatric Chest MRI: Performance of Self-Navigated Golden-Angle Ordered Conical Ultrashort Echo Time Acquisition. JMRI 2019 (doi: 10.1002/jmri.25776)
[6] Kee et al. Free-Breathing R2* Mapping of Hepatic Iron Overload in Children Using 3D Multi-Echo UTE Cones MRI. MRM 2021 (doi: 10.1002/mrm.28610)
[7] Feng et al. XD-GRASP: Golden-Angle Radial MRI with Reconstruction of Extra Motion-State Dimensions Using Compressed Sensing. MRM 2016 (doi: 10.1002/mrm.25665).
[8] Dong et al. Simultaneous Phase Unwrapping and Removal of Chemical Shift (SPURS) Using Graph Cuts: Application in Quantitative Susceptibility Mapping. IEEE TMI (doi: 10.1109/TMI.2014.2361764).
[9] Zhou et al. Background Field Removal by Solving the Laplacian Boundary Value Problem. NMR Biomed 2014 (doi: 10.1002/nbm.3064).
[10] Liu et al. MEDI+0: Morphology Enabled Dipole Inversion with Automatic Uniform Cerebrospinal Fluid Zero Reference for Quantitative Susceptibility Mapping. MRM 2018 (doi: 10.1002/mrm.26946).
Figures