0115
Free-Breathing, Fat- and B1-corrected T1 Mapping of the Liver with Chemical Shift Encoded Inversion Recovery MRI1Department of Biomedical Engineering, University of Wisconsin-Madison, Madison, WI, United States, 2Department of Radiology, University of Wisconsin-Madison, Madison, WI, United States, 3GE Healthcare, Waukesha, WI, United States, 4GE Healthcare, Atlanta, GA, United States, 5Department of Medical Physics, University of Wisconsin-Madison, Madison, WI, United States, 6Department of Medicine, University of Wisconsin-Madison, Madison, WI, United States, 7Department of Emergency Medicine, University of Wisconsin-Madison, Madison, WI, United States
Synopsis
T1 relaxation is emerging as a quantitative biomarker for the diagnosis and staging of chronic liver disease. Conventional T1 mapping methods such as variable flip angle and Modified Look-Locker Inversion Recovery, fail to address confounding factors such as B1 inhomogeneities, the presence of fat, and motion. In this work, we propose a novel free-breathing T1 mapping method that addresses multiple confounding factors, combining chemical shift encoded MRI, inversion recovery and stack-of-stars sampling strategy for abdominal T1 mapping.
Introduction
Various metabolic and viral diseases, such as obesity, diabetes, non-alcoholic fatty liver disease (NAFLD) and hepatitis are known to cause chronic liver disease (CLD). The prevalence of obesity, diabetes and NAFLD have been increasing steadily in Western populations over the last 3 decades, and impacting an estimated 1 billion adults worldwide1,2.Biopsy is currently the gold standard for diagnosing CLD. Even though biopsy is a relatively safe procedure, it still carries risk of complications and is expensive3,4. Furthermore, it examines only 0.002% of the liver, resulting in high sampling variability and poor intra- and inter-observer variability4–6. Variable Flip Angle (VFA) and Modified Look-Locker Inversion Recovery (MOLLI) are among the conventional T1 mapping methods most used in the abdomen. Despite their individual strengths, namely volumetric coverage for VFA and B1 insensitivity for MOLLI, these methods require breath-held acquisitions and fail to correct for confounding factors such as proton density fat fraction (PDFF) and B1 inhomogeneities7-10.
Cartesian k-space sampling strategies used in most conventional T1 mapping methods also suffer from motion artifacts particularly in the abdomen. Breath-held image acquisitions are used to minimize motion artifacts, but this limits their use in children and adults unable to hold their breath and renders volumetric coverage impractical for conventional MOLLI applications11.
In this work, we describe the combination of chemical shift encoded (CSE)-MRI, inversion recovery and stack-of-stars k-space sampling to develop a novel free-breathing, 3D, confounder-corrected T1 mapping method for diagnosis and staging of CLD.
Theory
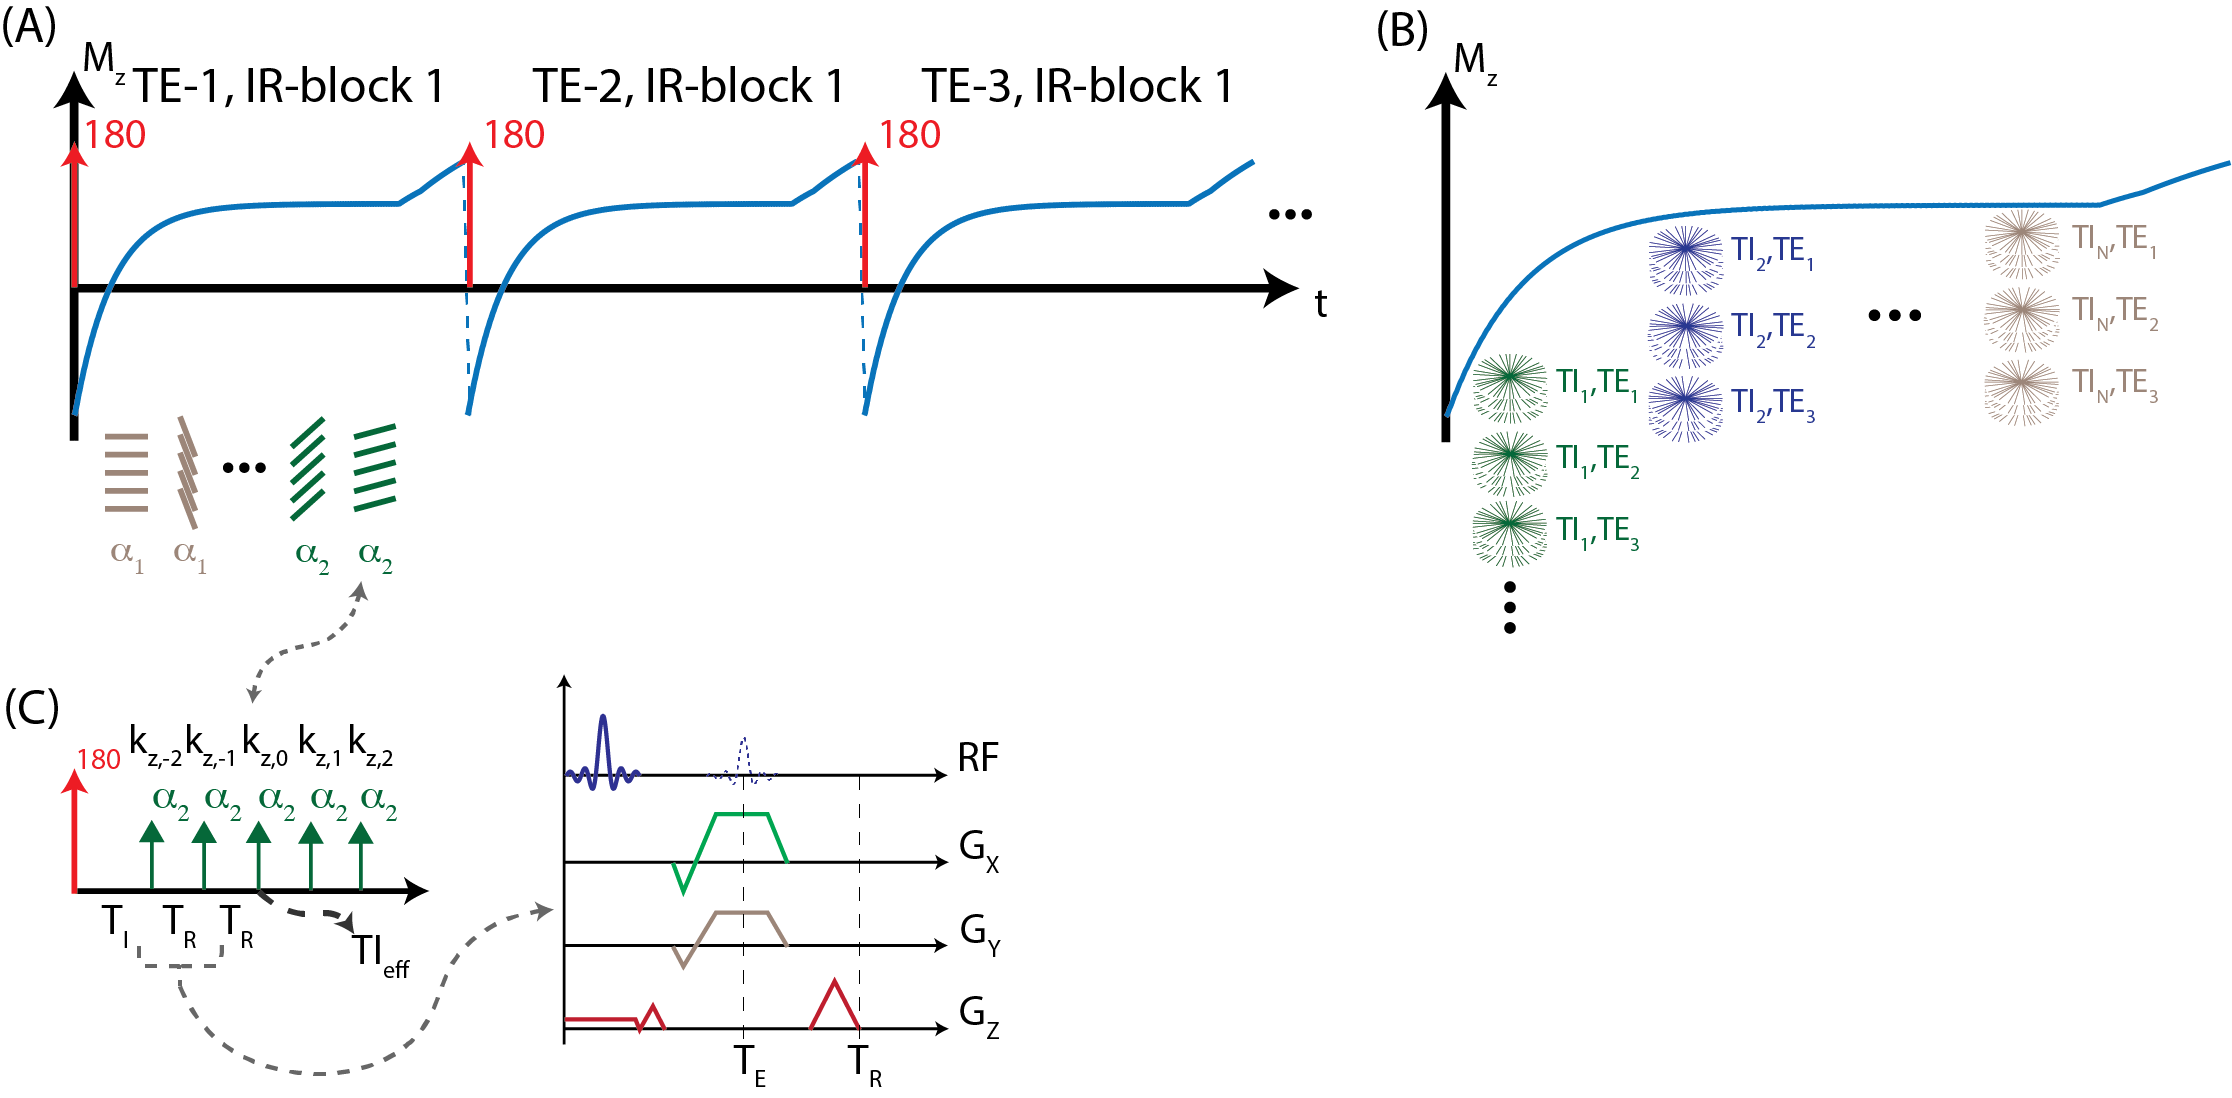
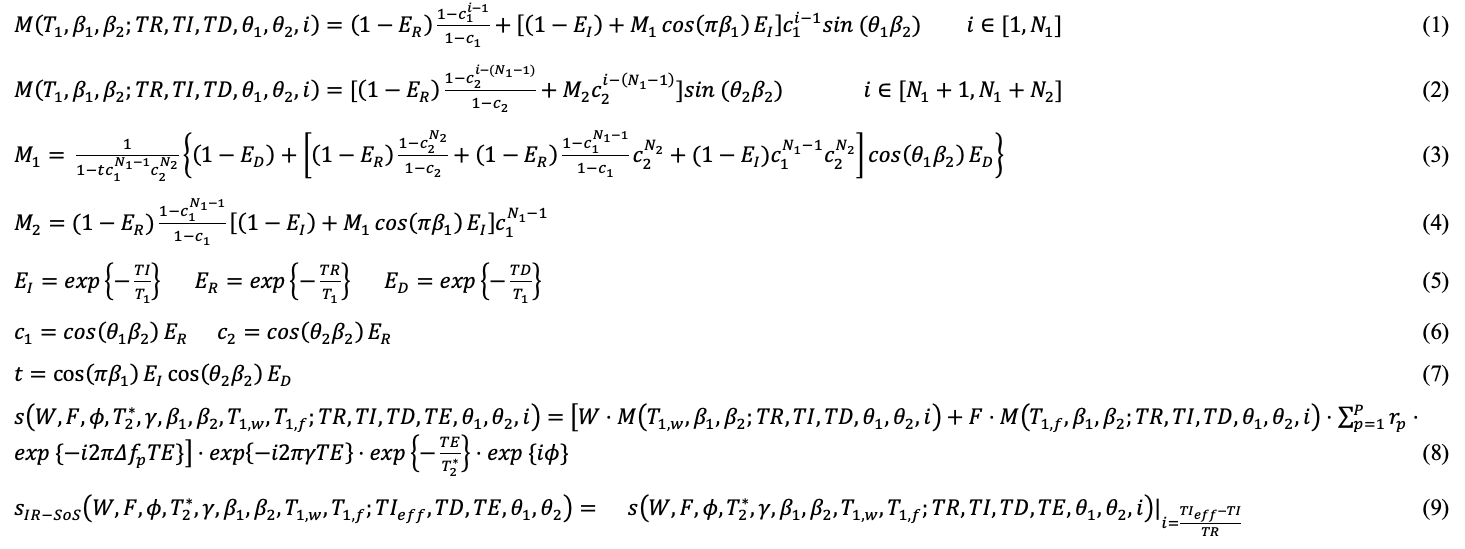
MRI Acquisition: An adiabatic, spatially non-selective inversion pulse is first applied, followed by the acquisition of a series of radial stacks with single echo readout. This acquisition scheme is repeated for three-echoes for CSE-MRI acquisition. kz-stacks were acquired along the T1 recovery with varying flip angles to facilitate correction for B1 and inversion efficiency. The magnetization preparation and acquisition scheme is illustrated in Figure 1. Projection angles are selected to i) uniformly sample each TI and TE frame and ii) create incoherent undersampling patterns in both TI and TE dimensions.Signal Model: The proposed method utilizes a 3D spoiled-gradient echo (SGRE) acquisition to encode the MR signal with i) T1 weighting using an IR magnetization preparation, ii) B0 inhomogeneity and chemical shift using a CSE acquisition, iii) B1 inhomogeneity using varying flip angles. The resulting SGRE signal is modeled as a bi-exponential signal that is the linear combination of water and fat signals to leverage both T1- and CSE-contrast to jointly estimate T1, PDFF and B1 maps. Figure 2 describes the proposed bi-exponential signal model.
Image Reconstruction: TE and TI frames were jointly reconstructed using a locally low rank reconstruction algorithm to improve SNR performance and image quality according to eq. 1:
\begin{equation}~\hat{a}_{1,2,3,..}=argmin_{a_{1,2,3,..}}~\Vert~\Omega~\begin{bmatrix}~s(TE_1)~\\~s(TE_2)~\\~s(TE_3)~\end{bmatrix}~-~F~\cdot~S~\cdot~U_k~\cdot~\begin{bmatrix}~a_1~\\~a_2~\\~a_3~\end{bmatrix}~\Vert~+~\lambda~\sum~\Vert~R_r~\begin{bmatrix}~a_1~\\~a_2~\\~a_3~\end{bmatrix}~\Vert_*~\tag{1}~\end{equation}
Where, $$$\Omega$$$ denotes Cartesian gridding operator, $$$s(TE_i)$$$ denotes radial k-space at ith echo time, $$$F$$$ is the FFT operator, $$$S$$$ is the coil sensitivity operator, $$$U_k$$$ is the subspace transform and $$$a_i$$$ is the subspace representation of ith echo image. Low rank constraints were applied on the concatenated basis coefficients of the echo images12. Basis functions for T1 relaxation behaviors were calculated using Bloch equation simulations to cover a wide range of T1 values (200-3500ms), B1 inhomogeneities (0.5-1.5) and inversion efficiencies (0.5-1). T1 mapping is achieved by nonlinear least squares fitting on the signal model outlined in Figure 2. LLR constraints are applied to subspace representations of three echoes jointly.
Methods
Phantom Imaging: Three-echo, radial stack-of-stars images were acquired on a phantom with varying T1 relaxations (300-1100ms) and PDFFs (0-30%) on a clinical 3.0T MRI system (Discovery MR750, GE Healthcare, Waukesha, WI) using a 32-channel phased array torso coil. Imaging parameters were: FOV=180x180x60mm3, resolution=0.75x0.75x1mm3, flip angle=6/3o, number of slices=60, partial Fourier readout fraction=70%, TR/TE1/TE2/TE3=6/2.2/3/3.8ms, Bandwidth=±167kHz. 12 radial stacks were acquired after each inversion pulse. Total acquisition time was 5 minutes. IDEAL_IQ (GE Healthcare, Waukesha, WI) is used as the reference measurement for PDFF13. Imaging parameters were: FOV=270x270mm2, slice thickness=10mm, resolution=1.7x1.7mm2, Bandwidth=±142kHz.Liver Imaging: Three-echo, radial stack-of-stars images were acquired in one volunteer (male, age=33) on a clinical 3.0T MR scanner (Discovery MR750, GE Healthcare, Waukesha, WI) using a 32-channel phased array torso coil. Imaging parameters were: FOV=380x380x130mm3, resolution=0.9x0.9x2.0mm3, flip angle=8/4o, number of slices=64, partial Fourier readout fraction=70%, TR/TE1/TE2/TE3=6.9/2.2/3/3.8ms, Bandwidth=±167kHz. 12 radial stacks were acquired after each inversion pulse. Total acquisition time was 10 minutes. SMART1map is used as the reference T1 mapping method. Imaging parameters were: FOV=300x300mm2, resolution=2.0x2.0mm2, TI/TR/TE=153/3.2/1ms, Bandwidth=±62kHz14.
Results
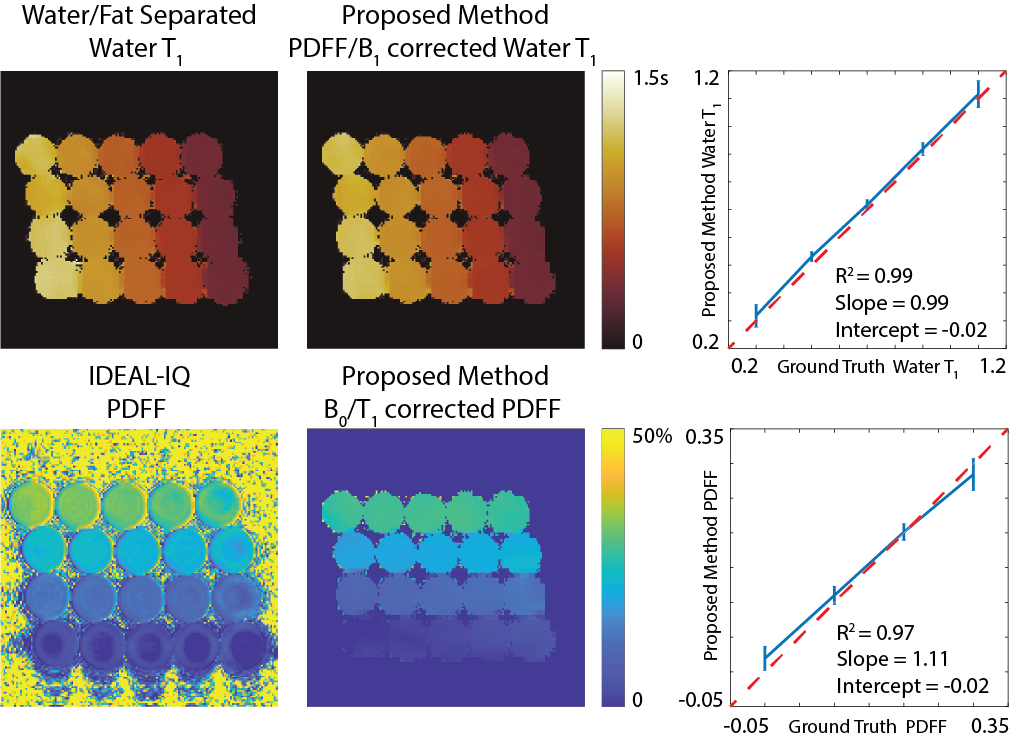
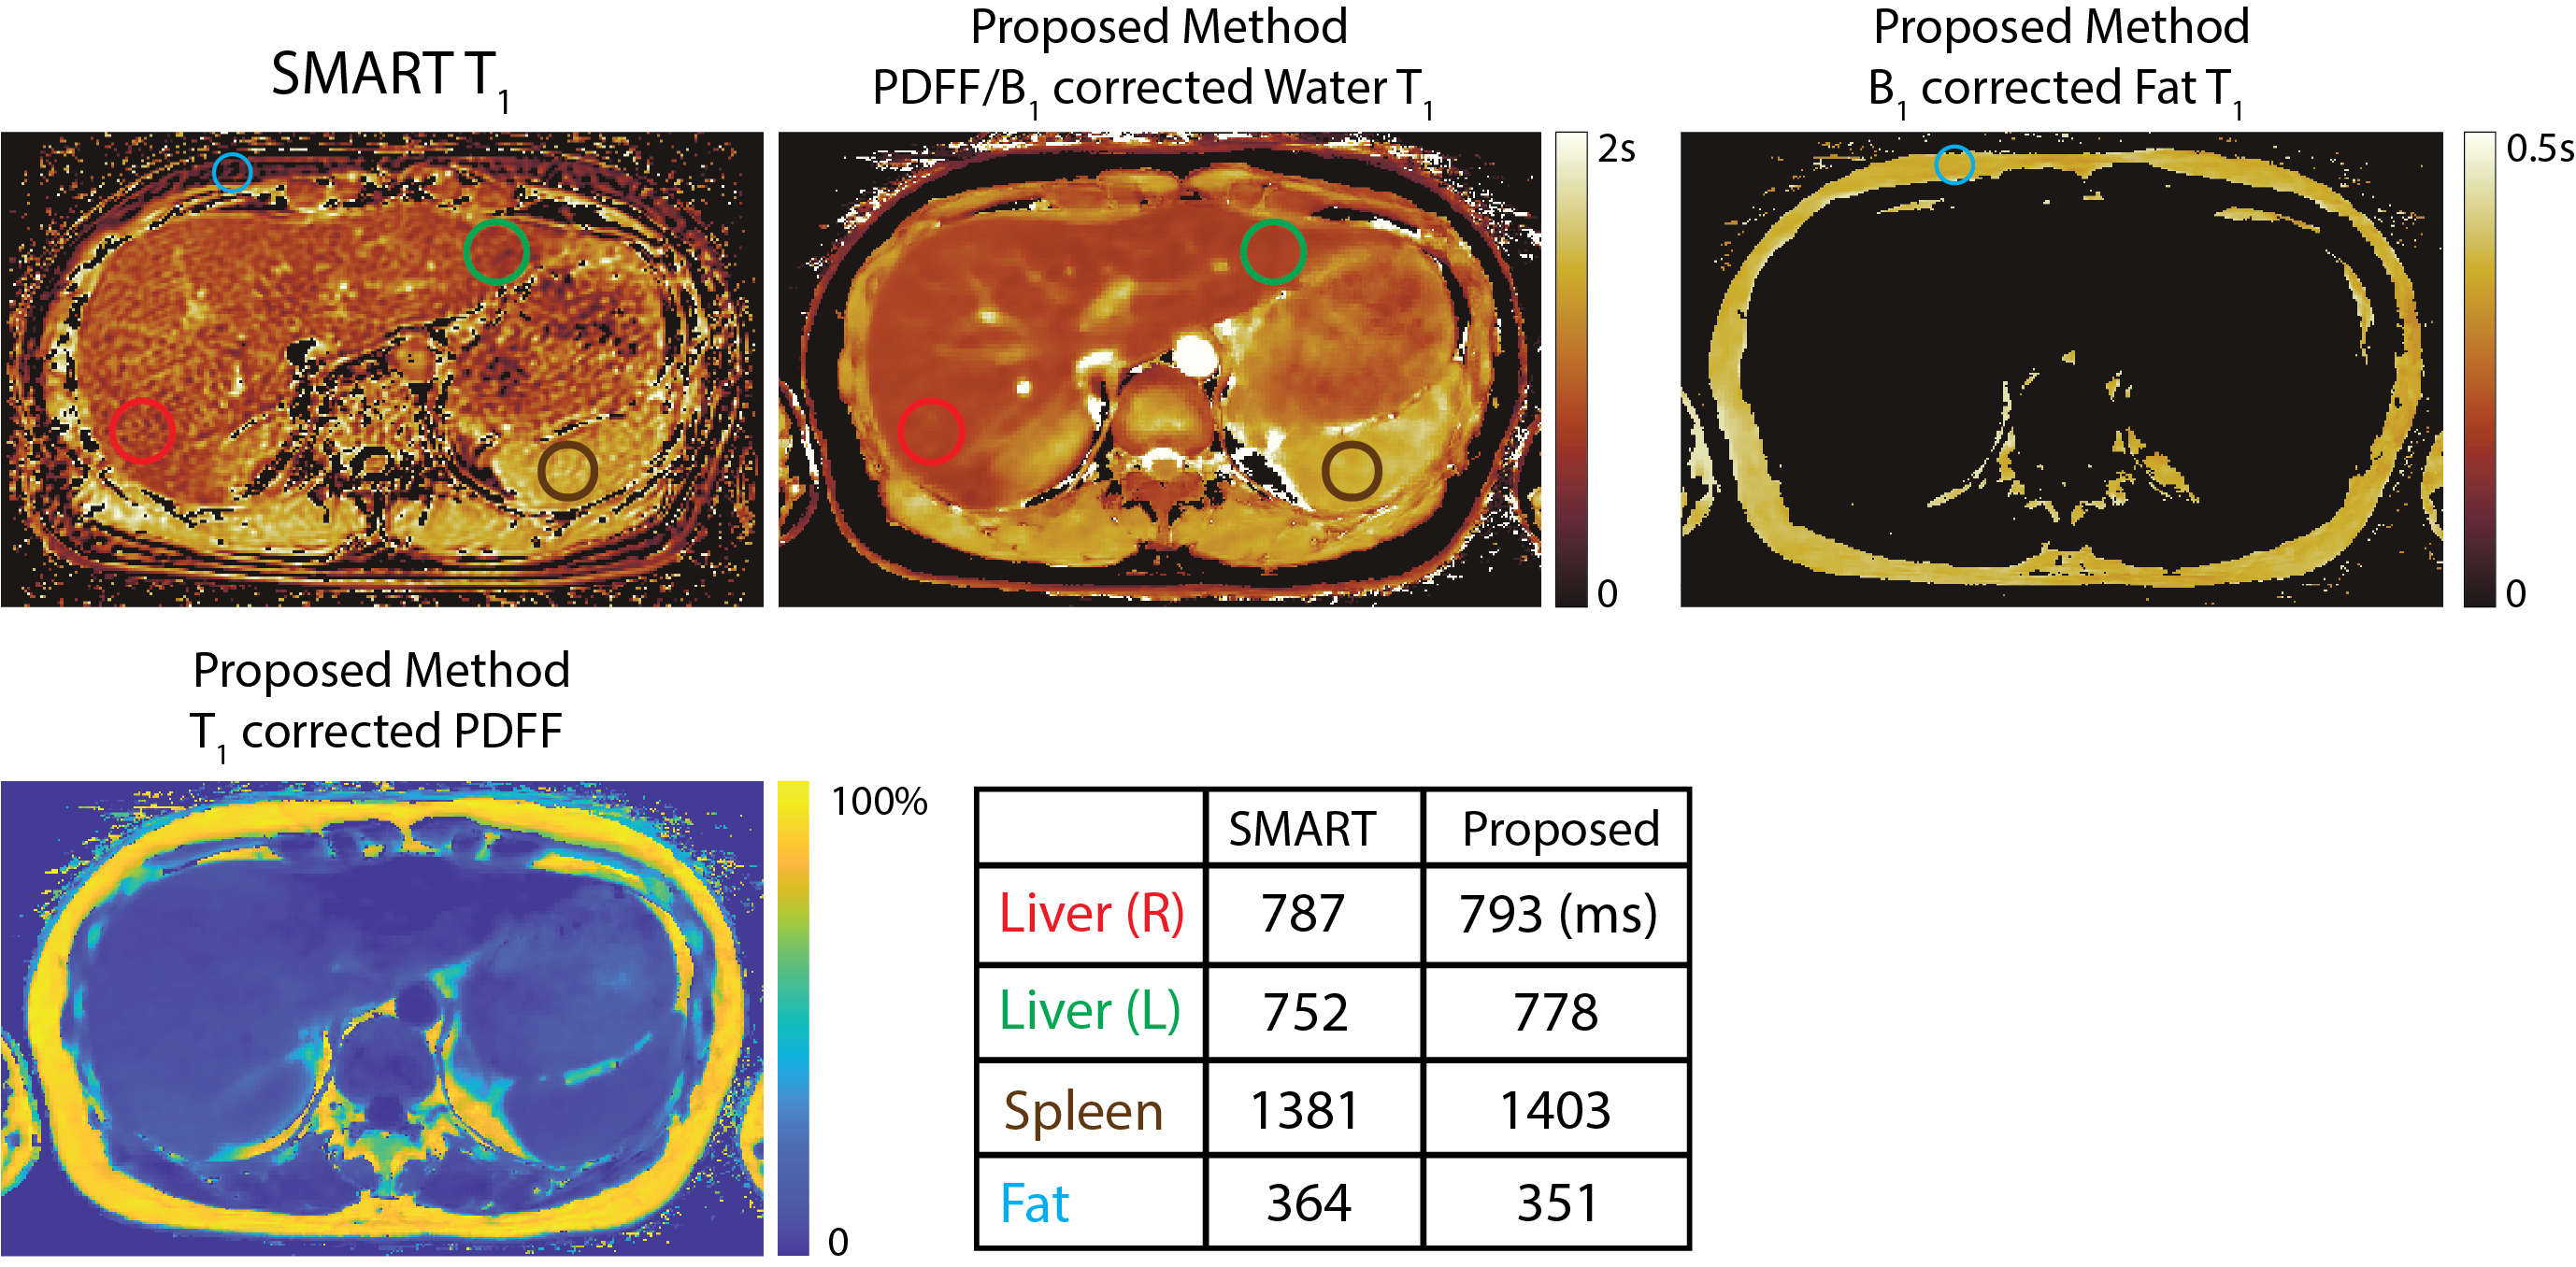
Validation of the proposed method is shown in Figure 3 with the phantom study. Estimated water specific T1 relaxation and PDFF values show linear agreement with the reference measurements obtained from water/fat separated T1 mapping and IDEAL_IQ13. Figure 4 demonstrates the results of the in vivo study and reference T1 measurements obtained via SMART1map14. Accuracy of the proposed method is confirmed via region-of-interest analysis on subcutaneous fat, liver parenchyma and spleen.Discussion
In this work, we present a novel free-breathing, 3D, PDFF/B1-corrected T1 mapping method combining CSE-MRI, IR preparation and stack-of-stars k-space sampling. Proposed method corrects for B1-related errors that occur both during the excitation and inversion pulses, and partial volume effects using a sophisticated bi-exponential signal model. Future work will include exploring effects of respiratory gating.Acknowledgements
We wish to acknowledge investigator-initiated research support from Bayer, UW Institute for Clinical and Translational Research, and the Clinical and Translational Science Award of the NCATS/NIH (UL1TR002373). Further, we wish to acknowledge GE Healthcare who provides research support to the University of Wisconsin. Finally, Dr. Reeder is a Romnes Faculty Fellow, and has received an award provided by the University of Wisconsin-Madison Office of the Vice Chancellor for Research and Graduate Education with funding from the Wisconsin Alumni Research Foundation.References
[1] S. K. Asrani, H. Devarbhavi, J. Eaton, and P. S. Kamath, “Burden of liver diseases in the world,” Journal of Hepatology, vol. 70, no. 1, pp. 151–171, Jan. 2019, doi: 10.1016/j.jhep.2018.09.014.
[2] Z. M. Younossi et al., “Epidemiology of chronic liver diseases in the USA in the past three decades,” Gut, vol. 69, no. 3, pp. 564–568, Mar. 2020, doi: 10.1136/gutjnl-2019-318813.
[3] B. Taouli, R. L. Ehman, and S. B. Reeder, “Advanced MRI Methods for Assessment of Chronic Liver Disease,” American Journal of Roentgenology, vol. 193, no. 1, pp. 14–27, Jul. 2009, doi: 10.2214/AJR.09.2601.
[4] Y. Ding, S.-X. Rao, T. Zhu, C.-Z. Chen, R.-C. Li, and M.-S. Zeng, “Liver fibrosis staging using T1 mapping on gadoxetic acid-enhanced MRI compared with DW imaging,” Clinical Radiology, vol. 70, no. 10, pp. 1096–1103, Oct. 2015, doi: 10.1016/j.crad.2015.04.014.
[5] Z. Li et al., “Assessment of liver fibrosis by variable flip angle T 1 mapping at 3.0T: Assessing Liver Fibrosis by VFA T 1 Mapping,” J. Magn. Reson. Imaging, vol. 43, no. 3, pp. 698–703, Mar. 2016, doi: 10.1002/jmri.25030.
[6] S. Pan, X.-Q. Wang, and Q.-Y. Guo, “Quantitative assessment of hepatic fibrosis in chronic hepatitis B and C: T1 mapping on Gd-EOB-DTPA-enhanced liver magnetic resonance imaging,” WJG, vol. 24, no. 18, pp. 2024–2035, May 2018, doi: 10.3748/wjg.v24.i18.2024.
[7] F. E. Mozes, E. M. Tunnicliffe, M. Pavlides, and M. D. Robson, “Influence of fat on liver T 1 measurements using modified Look-Locker inversion recovery (MOLLI) methods at 3T: Influence of Fat on Liver T 1 Measurements,” J. Magn. Reson. Imaging, vol. 44, no. 1, pp. 105–111, Jul. 2016, doi: 10.1002/jmri.25146.
[8] H.-L. M. Cheng and G. A. Wright, “Rapid high-resolutionT1 mapping by variable flip angles: Accurate and precise measurements in the presence of radiofrequency field inhomogeneity,” Magn. Reson. Med., vol. 55, no. 3, pp. 566–574, Mar. 2006, doi: 10.1002/mrm.20791.[9] D. Tamada, T. Wakayama, H. Onishi, and U. Motosugi, “Multiparameter estimation using multi-echo spoiled gradient echo with variable flip angles and multicontrast compressed sensing,” Magnetic Resonance in Medicine, vol. 80, no. 4, pp. 1546–1555, Oct. 2018, doi: 10.1002/mrm.27151.
[10] X. Wang et al., “T1-corrected quantitative chemical shift-encoded MRI,” Magnetic Resonance in Medicine, vol. 83, no. 6, pp. 2051–2063, Jun. 2020, doi: 10.1002/mrm.28062.
[11] D. R. Messroghli, A. Radjenovic, S. Kozerke, D. M. Higgins, M. U. Sivananthan, and J. P. Ridgway, “Modified Look-Locker inversion recovery (MOLLI) for high-resolutionT1 mapping of the heart,” Magn. Reson. Med., vol. 52, no. 1, pp. 141–146, Jul. 2004, doi: 10.1002/mrm.20110.
[12] J. I. Tamir et al., “T2 shuffling: Sharp, multicontrast, volumetric fast spin-echo imaging,” Magnetic Resonance in Medicine, vol. 77, no. 1, pp. 180–195, Jan. 2017, doi: 10.1002/mrm.26102.
[13] D. Hernando, J. H. Kramer, and S. B. Reeder, “Multipeak fat-corrected complex R2* relaxometry: Theory, optimization, and clinical validation: R2* Relaxometry Using Complex Reconstruction,” Magn. Reson. Med., vol. 70, no. 5, pp. 1319–1331, Nov. 2013, doi: 10.1002/mrm.24593.
[14] G. S. Slavin and J. A. Stainsby, “True T1 mapping with SMART1Map (saturation method using adaptive recovery times for cardiac T1 mapping): a comparison with MOLLI,” J Cardiovasc Magn Reson, vol. 15, no. S1, pp. P3, 1532-429X-15-S1-P3, Jan. 2013, doi: 10.1186/1532-429X-15-S1-P3.
Figures