0114
Pilot Tone-guided focused navigation for free-breathing whole-liver fat-water quantification1Department of Radiology, Lausanne University Hospital (CHUV) and University of Lausanne (UNIL), Lausanne, Switzerland, 2Department of Cardiovascular Imaging, Hôpital Cardiologique du Haut-Lévêque, CHU de Bordeaux, Bordeaux, France, 3IHU LIRYC, Electrophysiology and Heart Modeling Institute, INSERM U1045, Centre de Recherche Cardio-Thoracique de Bordeaux, Université de Bordeaux, Bordeaux, France, 4Siemens Healthcare GmbH, Erlangen, Germany, 5Advanced Clinical Imaging Technology, Siemens Healthcare AG, Lausanne, Switzerland, 6CIBM Center for Biomedical Imaging, Lausanne, Switzerland, 7Department of Diagnostic, Interventional and Pediatric Radiology (DIPR), Inselspital, Bern University Hospital, University of Bern, Bern, Switzerland, 8Translational Imaging Center, sitem-insel, Bern, Switzerland
Synopsis
A free-breathing 3D radial multi-echo GRE acquisition for whole-liver fat-water separation and quantification was proposed, which integrated retrospective respiratory motion extraction with Pilot Tone and motion-compensated reconstruction with focused navigation. The proposed framework was tested in 10 healthy volunteers at 1.5T. Post-processing of the 8 reconstructed and denoised echoes with a graphcut algorithm provided fat-water separated images and fat fraction maps of isotropic resolution. Images and maps were compared to breath-held reference 3D and 2D Cartesian acquisitions for validation of the quality of both motion compensation and fat-water separation.
Introduction
Within the non-invasive assessment of liver steatosis using fat fraction (FF), the importance of whole-organ coverage and large region of interest (ROI) selection in multiple slices has been highlighted [1], [2], to account for steatosis inhomogeneity. Multi-Echo GRE (ME-GRE) sequences provide reliable fat-water separation and quantification, after fitting the echoes to a multi-peak fat spectral model [3]. Correction for confounders such as B0 inhomogeneities, noise, and T1 bias, as well as a high number of echoes for good spectral resolution [3]–[5], are required. The latter can make high-resolution whole-liver examinations long and require repeated breath-holds. Free-breathing approaches are desirable for improved patient comfort, but can involve complex computational models with long reconstruction times.We hypothesize that by combining a Pilot Tone-guided ME-GRE acquisition with focused navigation (fNAV), an auto-focusing technique recently validated for cardiac MRI [6], motion-compensated whole-liver fat quantification with a high number of echoes is possible within an acceptable scan time, under free-breathing conditions. The images obtained with the proposed framework are compared in vivo to a gold-standard 2D 2-point Dixon sequence for fat-water separation and a 3D Cartesian ME-GRE for FF mapping.
Methods
On a 1.5T clinical scanner (MAGNETOM Sola, Siemens Healthcare, Erlangen, Germany), n=10 healthy volunteers (F=6, ages 23-39yo) who provided informed consent were scanned with a prototype 3D radial ME-GRE sequence with isotropic spatial resolution of (1.5mm)3.Data acquisition was performed during free-breathing, using a prototype free-running 3D golden angle radial trajectory [8] with 8 echoes. A 12-channel chest coil with an integrated PT generator, operating outside the MR frequency range, was used for trajectory-independent monitoring of motion. A respiratory signal was extracted from the PT data [9] and used for estimating fNAV coefficients that describe the amplitude of the respiratory motion at each spatial location. The fNAV coefficients were iteratively optimized to minimize an image quality metric (gradient entropy), then used to correct the separate echoes. Multi-contrast patch-based denoising [10] was performed on the reconstructed 4D volumes. Fat and water images and FF maps were generated using a 6-peak fat model and a maximum-likelihood graphcut algorithm [11] (ISMRM Fat/Water Toolbox [12]).
During the same examination, a 2-point Dixon VIBE sequence provided reference fat and water 2D images directly at the scanner. An anisotropic 3D Cartesian ME-GRE sequence was also acquired during breath-holding with 8 echoes, and provided sources images at the scanner that were processed with the same fitting algorithm as to provide reference fat-water separated images and FF maps. Sequence parameters are detailed in Tab.1.
The mean and standard deviation of the FF in 3 intra-hepatic ROIs was measured for both radial and Cartesian 3D acquisitions and used to perform a Bland-Altman analysis on the 10 volunteers.
Results
Respiratory PT signals were successfully extracted in all volunteers (Fig.1A), which enabled the minimization of motion-induced blurring using fNAV (Fig.1B-C), especially visible at the lung-liver interface. The average reconstruction time wih fNAV was 37min ([range 14-62]min) across volunteers. Patch-based denoising (additional computation time of 11min per 4D volume) improved the overall visual image sharpness (Fig.1C-D).The comparison of fat-water separated images to breath-held images showed the absence of motion artifacts with our technique, as well as a robust chemical species separation, without swaps (Fig.2).
In volunteer 4 (Fig.3A), the radial FF maps showed a larger granularity of the fatty regions and elevated FF in ROI1, compared to the breath-held Cartesian ones. Large standard deviations were measured in all 3 ROIs (Fig.3B). Conversely, good agreement between the two protocols was observed in volunteer 5 (Fig.3B). This was confirmed in the rest of the cohort, as a Bland-Altman analysis of the mean FF in 10 volunteers revealed an average bias of 0.09% between the Cartesian and proposed radial techniques, with 1.96 standard deviation bounds of [-2.43-2.63]% (Fig.4). Out of 10 datasets, only 2 had a mean difference across all ROIs higher than 1%, including volunteer 4 mentioned above.
Discussion
This study demonstrated the feasibility of combining a 3D radial sparse trajectory with a ME-GRE acquisition with 8 echoes using PT and fNAV, reaching isotropic clinical resolution in less than 3 minutes without introducing errors in the fat-water separation nor motion artifacts. Although differences in contrast from the Cartesian references were observed, visualisation of global liver anatomy and main hepatic and portal veins was possible.Global agreement of the parametric FF maps with the Cartesian reference in 80% of the volunteers showed the proposed method is promising, but the low FF content expected in healthy volunteers limited the evaluated range of our study. The deviation of our technique from the Cartesian reference was higher in volunteers with fat content above 5%, which will be investigated. Therefore, extended mapping validation on a standardized phantom, as well as case studies on subjects with elevated fat content would further characterize the accuracy of the technique. Additionally, this work could be extended to include R2* quantification without prolonging scan time, which would benefit iron deposition assessment.
Conclusion
This work presented a pipeline for free-breathing whole-liver fat imaging, which can be used to retrieve reliable information on the location and quantity of hepatic fat within acceptable scan and reconstruction time for a resolution of (1.5mm)3.Acknowledgements
The authors acknowledge the use of the ISMRM Fat/Water Toolbox [12] for some of the results shown in this work.
The present study was funded by the Swiss National Science Foundation (grant number #PCEFP2_194296, #PZ00P3_167871), the Unil Bourse Pro-Femmes, the Emma Muschamp Foundation and the Swiss Heart Foundation.
References
[1] K.-N. Vu, G. Gilbert, M. Chalut, M. Chagnon, G. Chartrand, and A. Tang, ‘MRI-determined liver proton density fat fraction, with MRS validation: Comparison of regions of interest sampling methods in patients with type 2 diabetes’, Journal of Magnetic Resonance Imaging, vol. 43, no. 5, pp. 1090–1099, May 2016, doi: 10.1002/jmri.25083.
[2] C. A. Campo, D. Hernando, T. Schubert, C. A. Bookwalter, A. J. V. Pay, and S. B. Reeder, ‘Standardized Approach for ROI-Based Measurements of Proton Density Fat Fraction and R2* in the Liver’, American Journal of Roentgenology, vol. 209, no. 3, pp. 592–603, Sep. 2017, doi: 10.2214/AJR.17.17812.
[3] H. Yu, A. Shimakawa, C. A. McKenzie, E. Brodsky, J. H. Brittain, and S. B. Reeder, ‘Multiecho water-fat separation and simultaneous R2* estimation with multifrequency fat spectrum modeling’, Magnetic Resonance in Medicine, vol. 60, no. 5, pp. 1122–1134, Nov. 2008, doi: 10.1002/mrm.21737.
[4] S. B. Reeder, H. H. Hu, and C. B. Sirlin, ‘Proton density fat-fraction: A standardized mr-based biomarker of tissue fat concentration’, Journal of Magnetic Resonance Imaging, vol. 36, no. 5, pp. 1011–1014, Nov. 2012, doi: 10.1002/jmri.23741.
[5] S. Meisamy et al., ‘Quantification of Hepatic Steatosis with T1-independent, T2*-corrected MR Imaging with Spectral Modeling of Fat: Blinded Comparison with MR Spectroscopy’, Radiology, vol. 258, no. 3, pp. 767–775, Mar. 2011, doi: 10.1148/radiol.10100708.
[6] C. W. Roy et al., ‘Motion compensated whole-heart coronary cardiovascular magnetic resonance angiography using focused navigation (fNAV)’, Journal of Cardiovascular Magnetic Resonance, vol. 23, no. 1, p. 33, Mar. 2021, doi: 10.1186/s12968-021-00717-4.
[7] T. Vahle et al., ‘Respiratory Motion Detection and Correction for MR Using the Pilot Tone: Applications for MR and Simultaneous PET/MR Exams’, Invest Radiol, vol. 55, no. 3, pp. 153–159, Mar. 2020, doi: 10.1097/RLI.0000000000000619.
[8] D. Piccini, A. Littmann, S. Nielles-Vallespin, and M. O. Zenge, ‘Spiral phyllotaxis: The natural way to construct a 3D radial trajectory in MRI: Spiral Phyllotaxis Radial 3D Trajectory’, Magnetic Resonance in Medicine, vol. 66, no. 4, pp. 1049–1056, Oct. 2011, doi: 10.1002/mrm.22898.
[9] M. B. L. Falcão et al., ‘Pilot tone navigation for respiratory and cardiac motion-resolved free-running 5D flow MRI’, Magnetic Resonance in Medicine, vol. n/a, no. n/a, doi: 10.1002/mrm.29023.
[10] A. Bustin, G. Lima da Cruz, O. Jaubert, K. Lopez, R. M. Botnar, and C. Prieto, ‘High-dimensionality undersampled patch-based reconstruction (HD-PROST) for accelerated multi-contrast MRI’, Magnetic Resonance in Medicine, vol. 81, no. 6, pp. 3705–3719, 2019, doi: 10.1002/mrm.27694.
[11] D. Hernando, P. Kellman, J. P. Haldar, and Z.-P. Liang, ‘Robust water/fat separation in the presence of large field inhomogeneities using a graph cut algorithm’, Magnetic Resonance in Medicine, p. NA-NA, 2009, doi: 10.1002/mrm.22177.
[12] H.
H. Hu et al., ‘ISMRM workshop on fat–water separation: Insights,
applications and progress in MRI’, Magnetic Resonance in Medicine, vol.
68, no. 2, pp. 378–388, 2012, doi: 10.1002/mrm.24369.
Figures
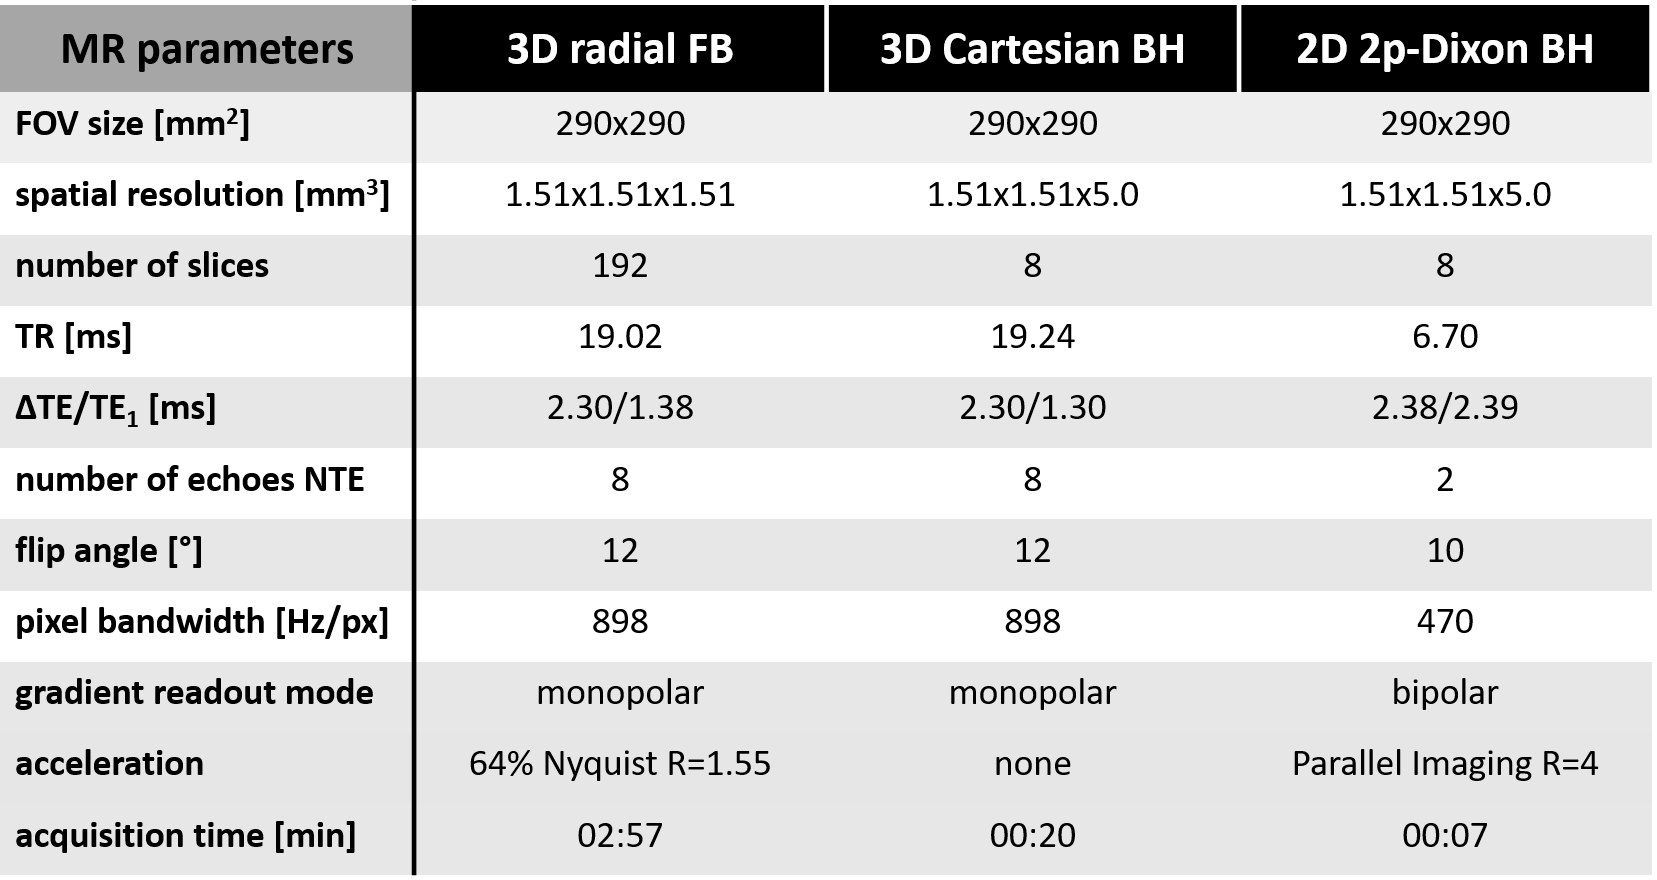
Table 1 - Acquisition parameters
The prototype free-breathing 3D radial ME-GRE sequence was acquired continuously with a phyllotaxis trajectory made of 424 interleaves composed of 22 segments each with a golden-angle rotation in between interleaves, leading to a 02:57min scan time. Parameters of the 3D Cartesian ME-GRE sequence were selected to match that of the proposed radial sequence as closely as possible, under the constraint of a breath-hold duration of 20sec. The 2p-Dixon sequence parameters were fixed as provided by the manufacturer.
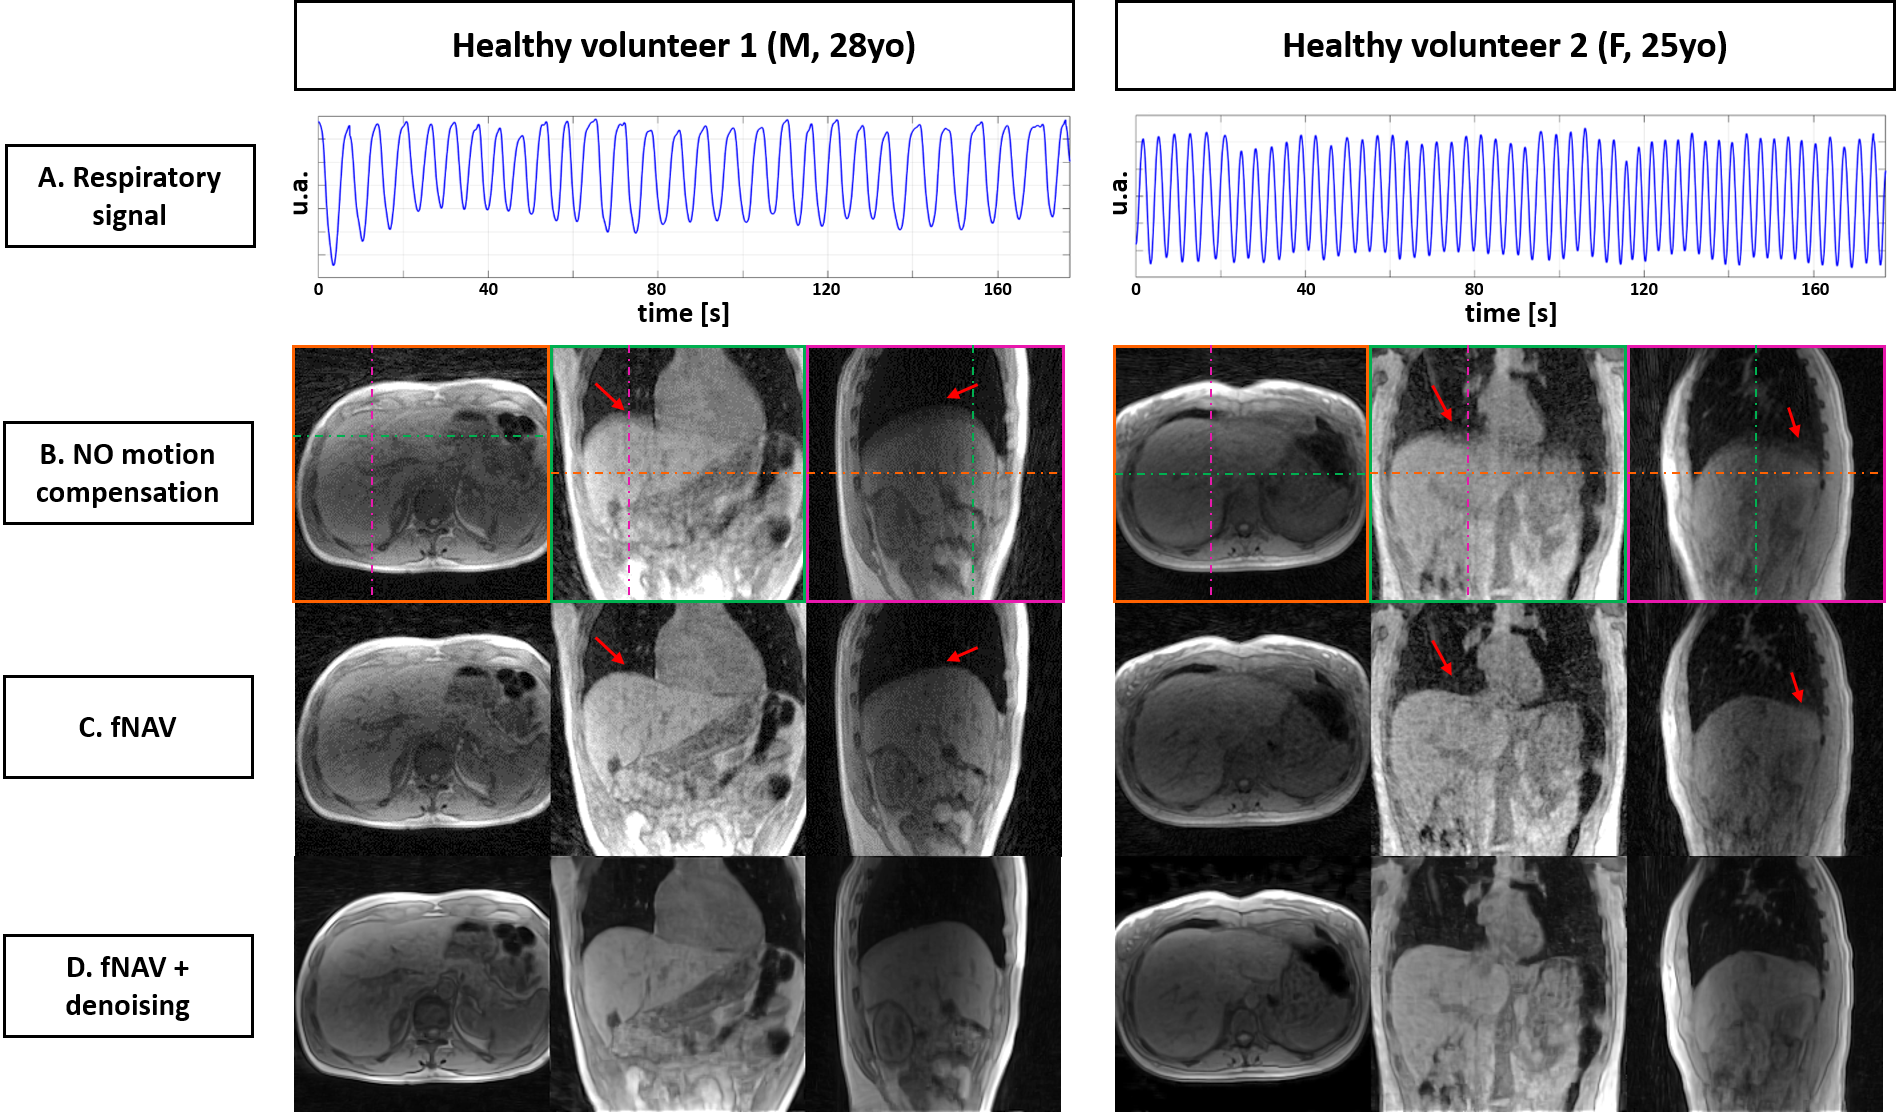
Figure 1 – Motion compensation with fNAV in 2 healthy volunteers
The respiratory signal extracted from the Pilot Tone is shown on panel A. The source images of the first collected echo with the proposed sequence are shown B. reconstructed without motion compensation, C. reconstructed with fNAV and D. reconstructed with fNAV and denoised. Visible blurring in the superior-inferior direction at the lung-liver interface affects the uncompensated images, which is corrected by fNAV (red arrows). Denoising improved overall image sharpness and quality.
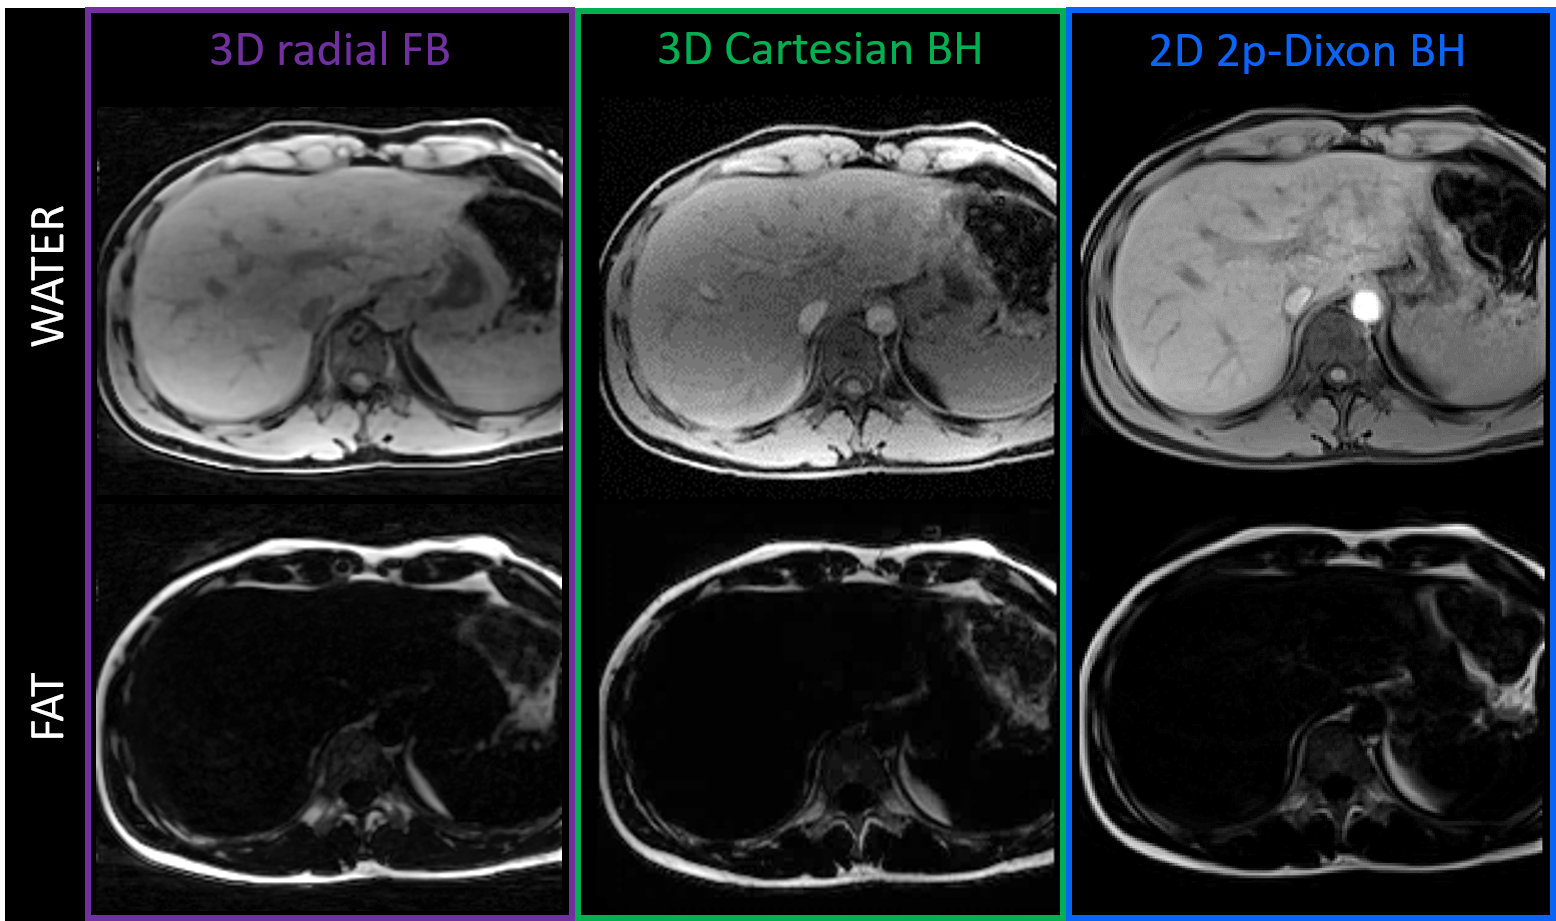
Figure 2 – Separated fat and water images in healthy volunteer 3 (M, 28yo)
Water-only (top) and fat-only (bottom) images are obtained from fitting the ME-GRE data to a 6-peak liver fat model, in the case of the 3D radial and 3D Cartesian (left and middle columns). The 2D 2-point Dixon VIBE acquisition (right column) produces separated images directly at the scanner and provides a gold-standard for fat-water separation. Good agreement and no swaps were observed, although contrast differences between 3D radial and 3D Cartesian can be seen (abdominal aorta).
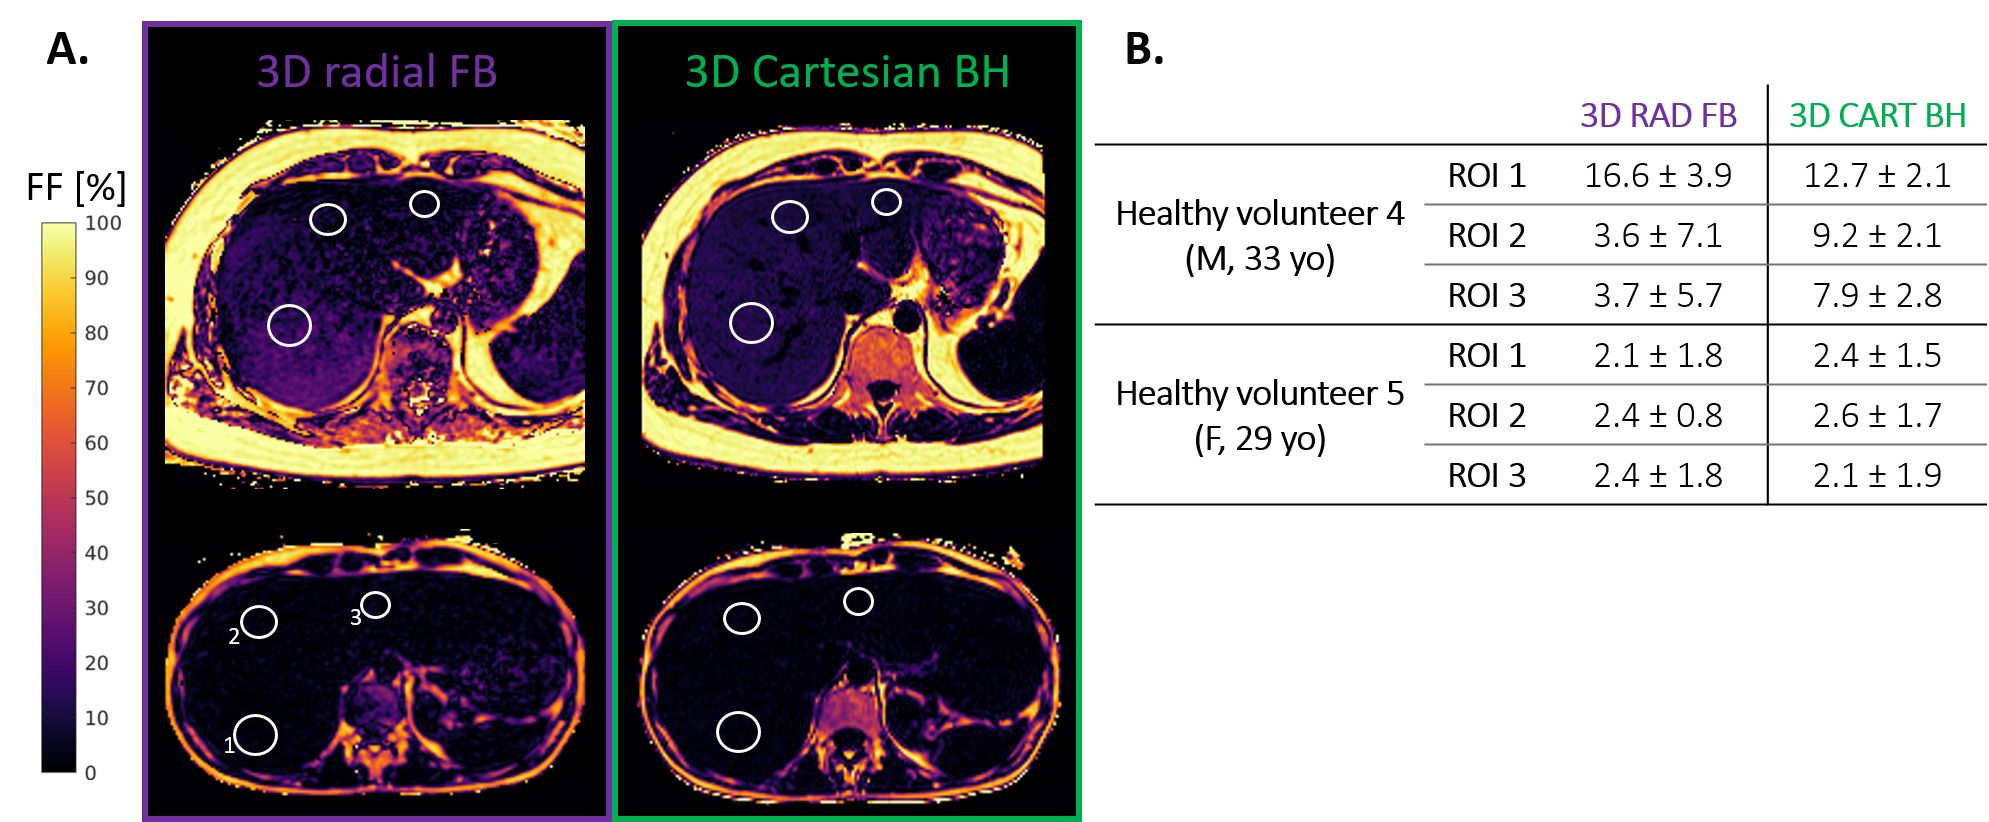
Figure 3 – Fat fraction maps in 2 healthy volunteers
A. Healthy volunteer 4 (top) and 5 (bottom). The regions of interest (ROI) used for quantitative analysis are indicated by white circles. The labels indicated on the bottom-left map are respectively: 1. Segment VII, 2. Segment IV and 3. Segment II.
B. Mean and standard deviation of the fat fraction (in %) measured across the ROI in the volumes presented in panel A, for both imaging protocols.
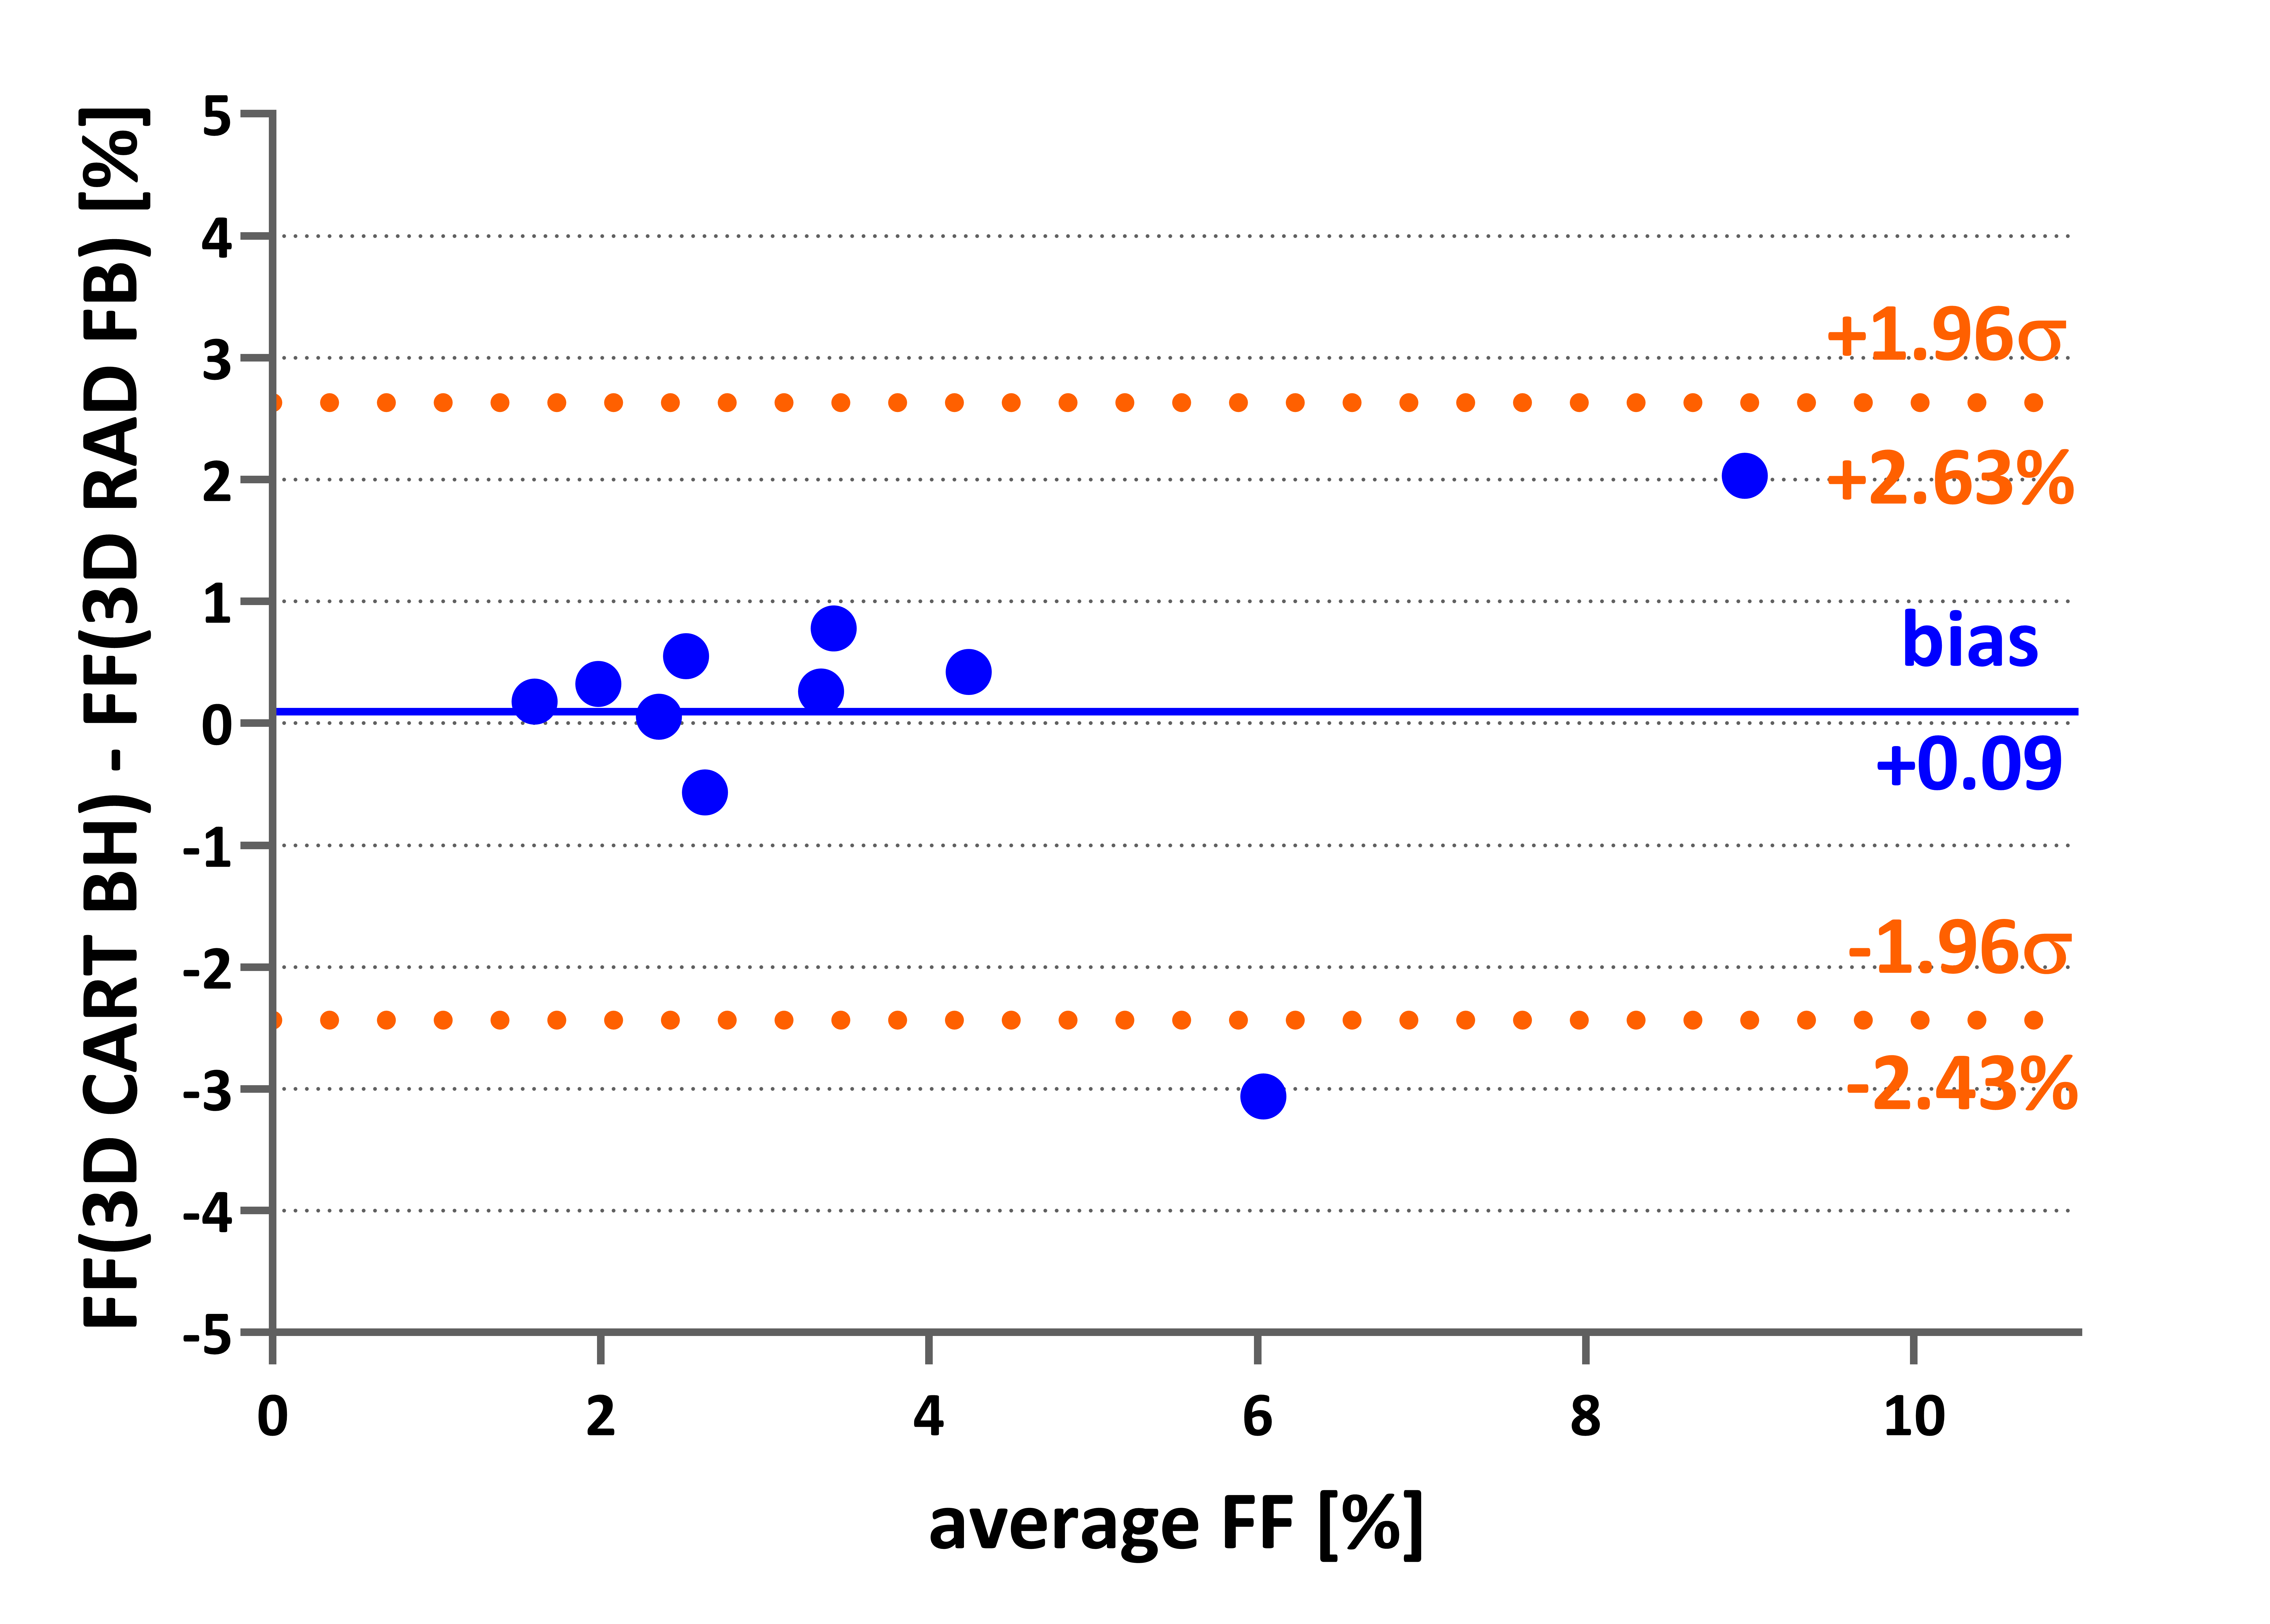
Figure 4 – Bland-Altman plot: difference between 3D radial FB and 3D Cartesian BH in 10 healthy volunteers
The 3D Cartesian ME-GRE with NTE=8 echoes analysed with graphcut provided FF maps that were compared to those obtained with the proposed 3D radial framework. A low bias is reported, with small limits of agreements between the 2 imaging protocols, mostly driven by bigger deviations observed in 2 volunteers out of 10. Difference in slice thickness (1.5 vs 5.0mm) could explain these deviations.