0113
Comparative Review of Algorithms and Methods for proton-density fat fraction (PDFF) quantification1Aix-Marseille Univ, CNRS, CRMBM, Marseille, France, 2APHM, Hôpital Universitaire Timone, CEMEREM, Marseille, France
Synopsis
An open-source toolbox has been implemented to compare state-of-the-art open-source fat-water separation algorithms over synthetic multi-echo data. Data varied in fat-fraction, B0, SNR, number of echoes and echo spacings. Most algorithms proved to be biased for 3 echoes data. For 5 echoes and more, six algorithms were comparable, but two algorithms proved to be inaccurate. Echo spacing scheme impacted quantitative limits of agreements. For proton-density fat-fraction(PDFF) quantification in the extreme ranges, graph-cut approaches provided similar results while IDEAL-CE provided more reliable results. Interestingly, the toolbox also revealed PDFF/T2* quantification to be sensitive to the choice of the fat spectrum.
Introduction
Chemical shift encoded MRI(CSE-MRI) techniques have become the reference for quantitative in vivo evaluation of fatty depots. Mapping the proton-density fat fraction(PDFF) is a refined non-invasive biomarker1 to assess tissue adiposity in the liver2, bone marrow and other organs. To obtain this quantitative biomarker, advanced methods of fat-water signal separation have been developed. The 2012 ISMRM Fat-Water MRI Workshop benchmarked these algorithms on a multitude of in-vivo datasets3. A decade later, new algorithms have emerged without continued or renewed comparison. Therefore, the purpose of this work was to address the performances of state-of-the-art Fat-Water reconstruction methods for PDFF and T2* quantification.Methods
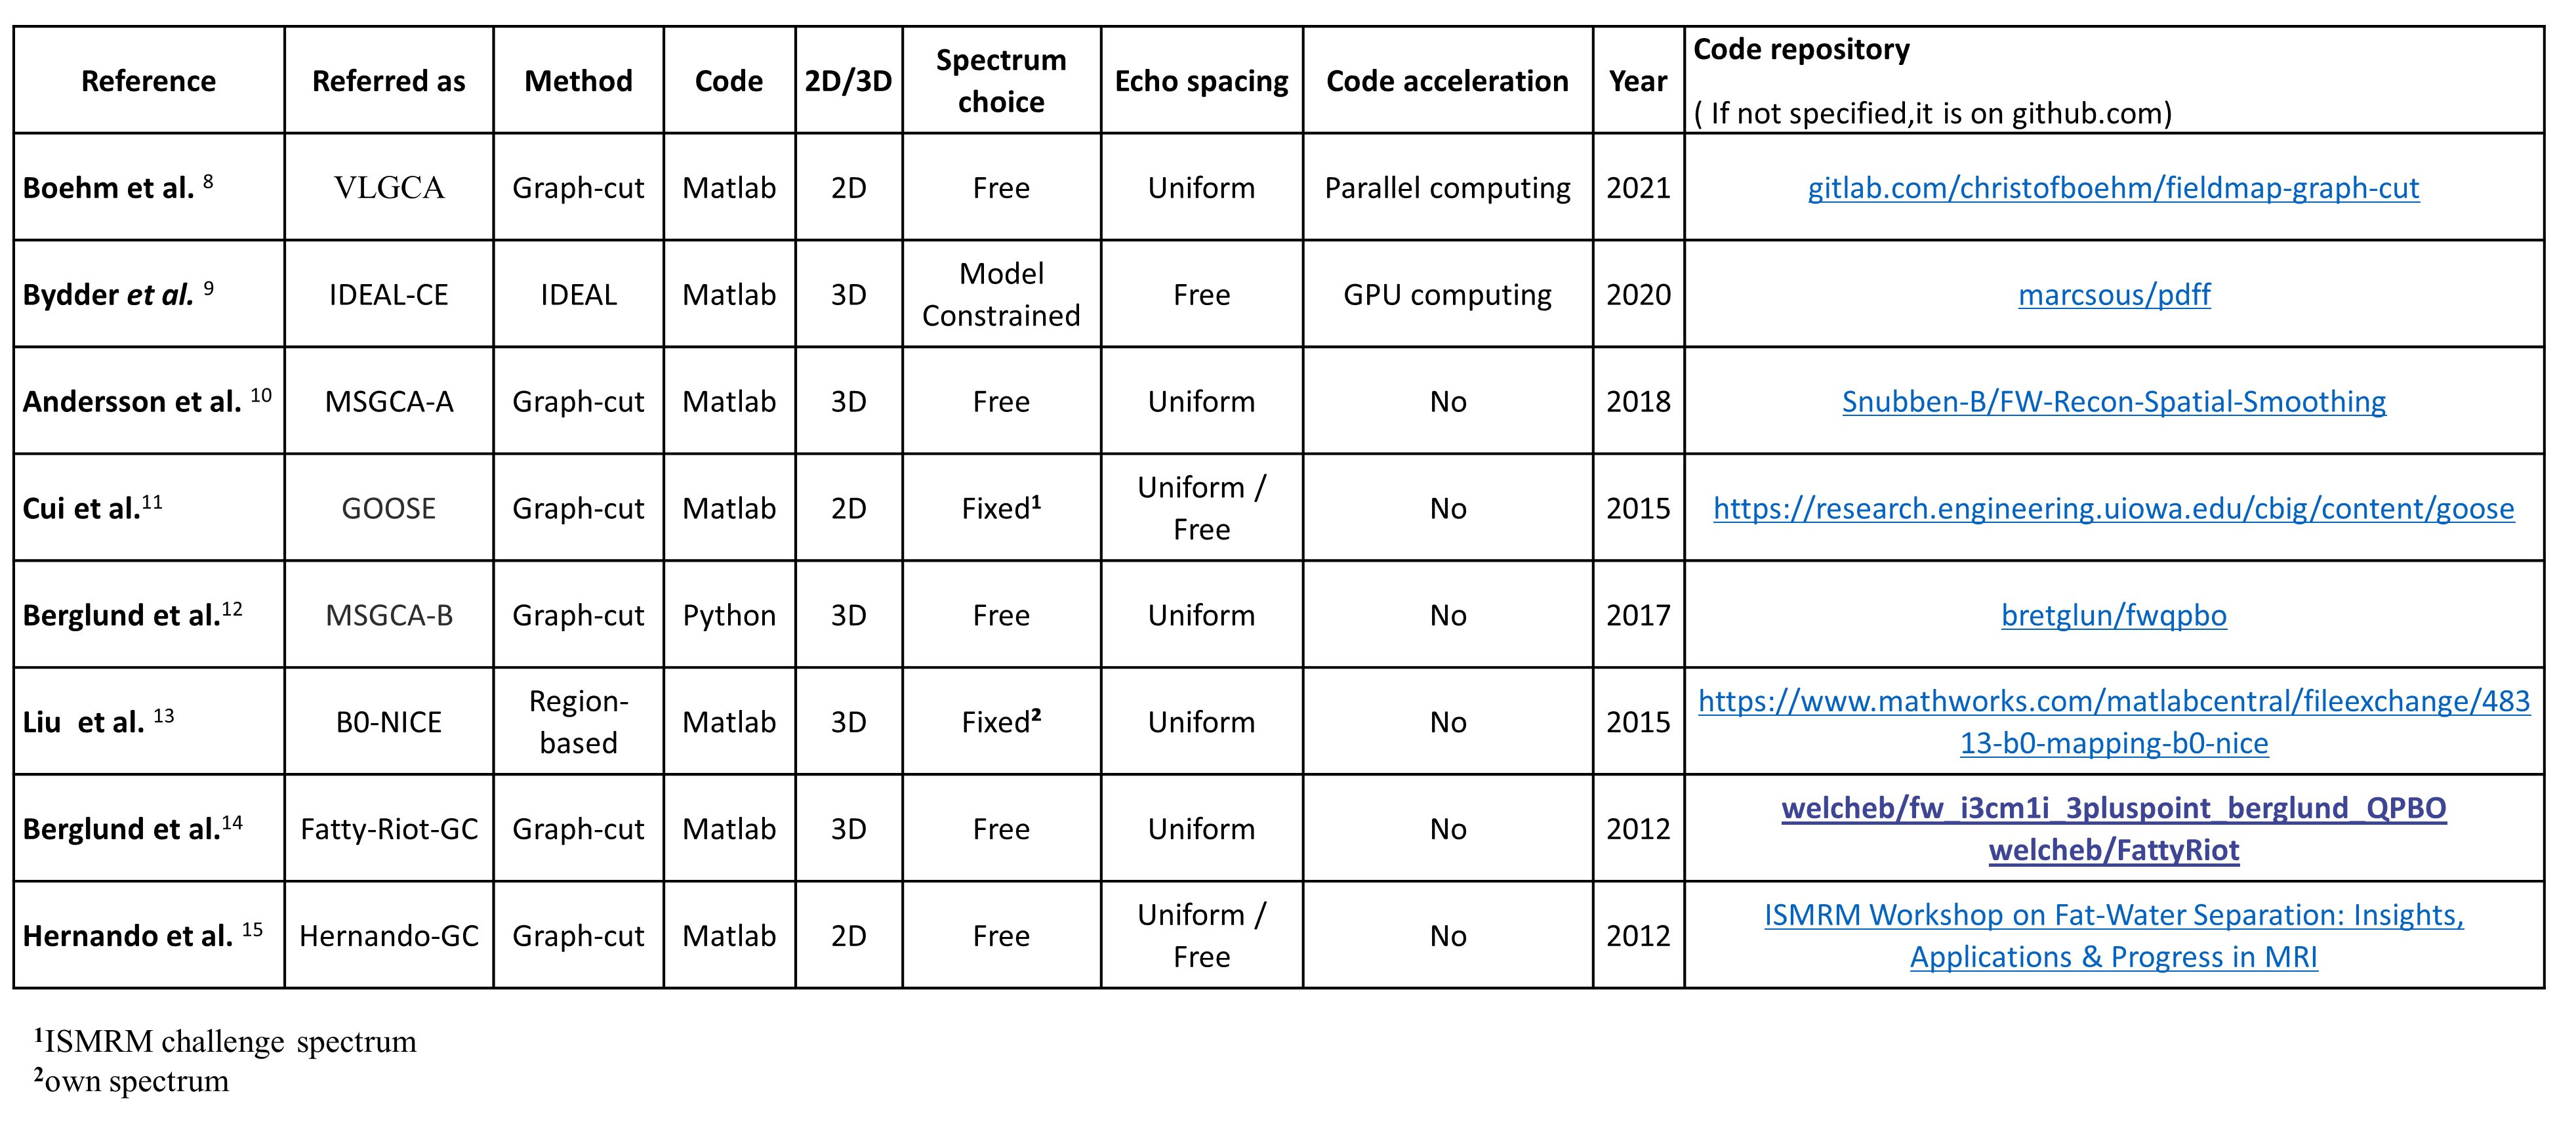
An open-source toolbox available both in Python and Matlab was implemented to assess and numerically compare the performances of recent open-source Fat-Water separation algorithms(Fig1), including Hernando et al4’s original graph-cut method(Hernando-GC), the ISMRM challenge winner leveraging quadratic pseudo-Boolean optimization graph-cut(Fatty-Riot-GC5), the multi-scale approach graph-cut(MSGCA-B6), enhanced later with spatial smoothing(MSGCA-A7), the Globally optimal surface estimation (GOOSE8) and Variable Layer graph cut (VLGCA9), a region-based approach (B0-NICE10) and an IDEAL constrained estimation (IDEAL-CE11).In addition, an extensible fat spectrum library was implemented to plug a variety of human fatty tissues spectra12–14 with each algorithm.
To evaluate the algorithms’ performances, synthetic CSE-MRI volumes were modeled with PDFF=0-100(x-axis), uniformly distributed B0=-300:6:300Hz(y-axis), 100 repetitions(z-axis) and a constant T2*=20ms. Gaussian noise was added to obtain SNR=50:10:100. Different numbers of echo times(NTE=3,5,7,9) and echo spacing schemes(realistic minimal, IDEAL and in/out-of-phase) were considered.
The comparison followed the guidelines provided by the Quantitative Imaging Biomarkers Assessment15. The discretization of B0 fields was set at 2Hz-steps for all graph-cut algorithms. The bias, precision and limits of agreement(LOA) of parameter models (PDFF, B0, T2*) were evaluated .The computational times of the algorithms were recorded. The algorithms’ discrepancies were demonstrated practically on challenging in vivo datasets. Finally, synthetic signals were simulated with a subcutaneous fat spectrum but processed with either the same spectrum or with the liver spectrum(NTE=9) to probe the algorithms’ sensitivity to different spectra.
Results
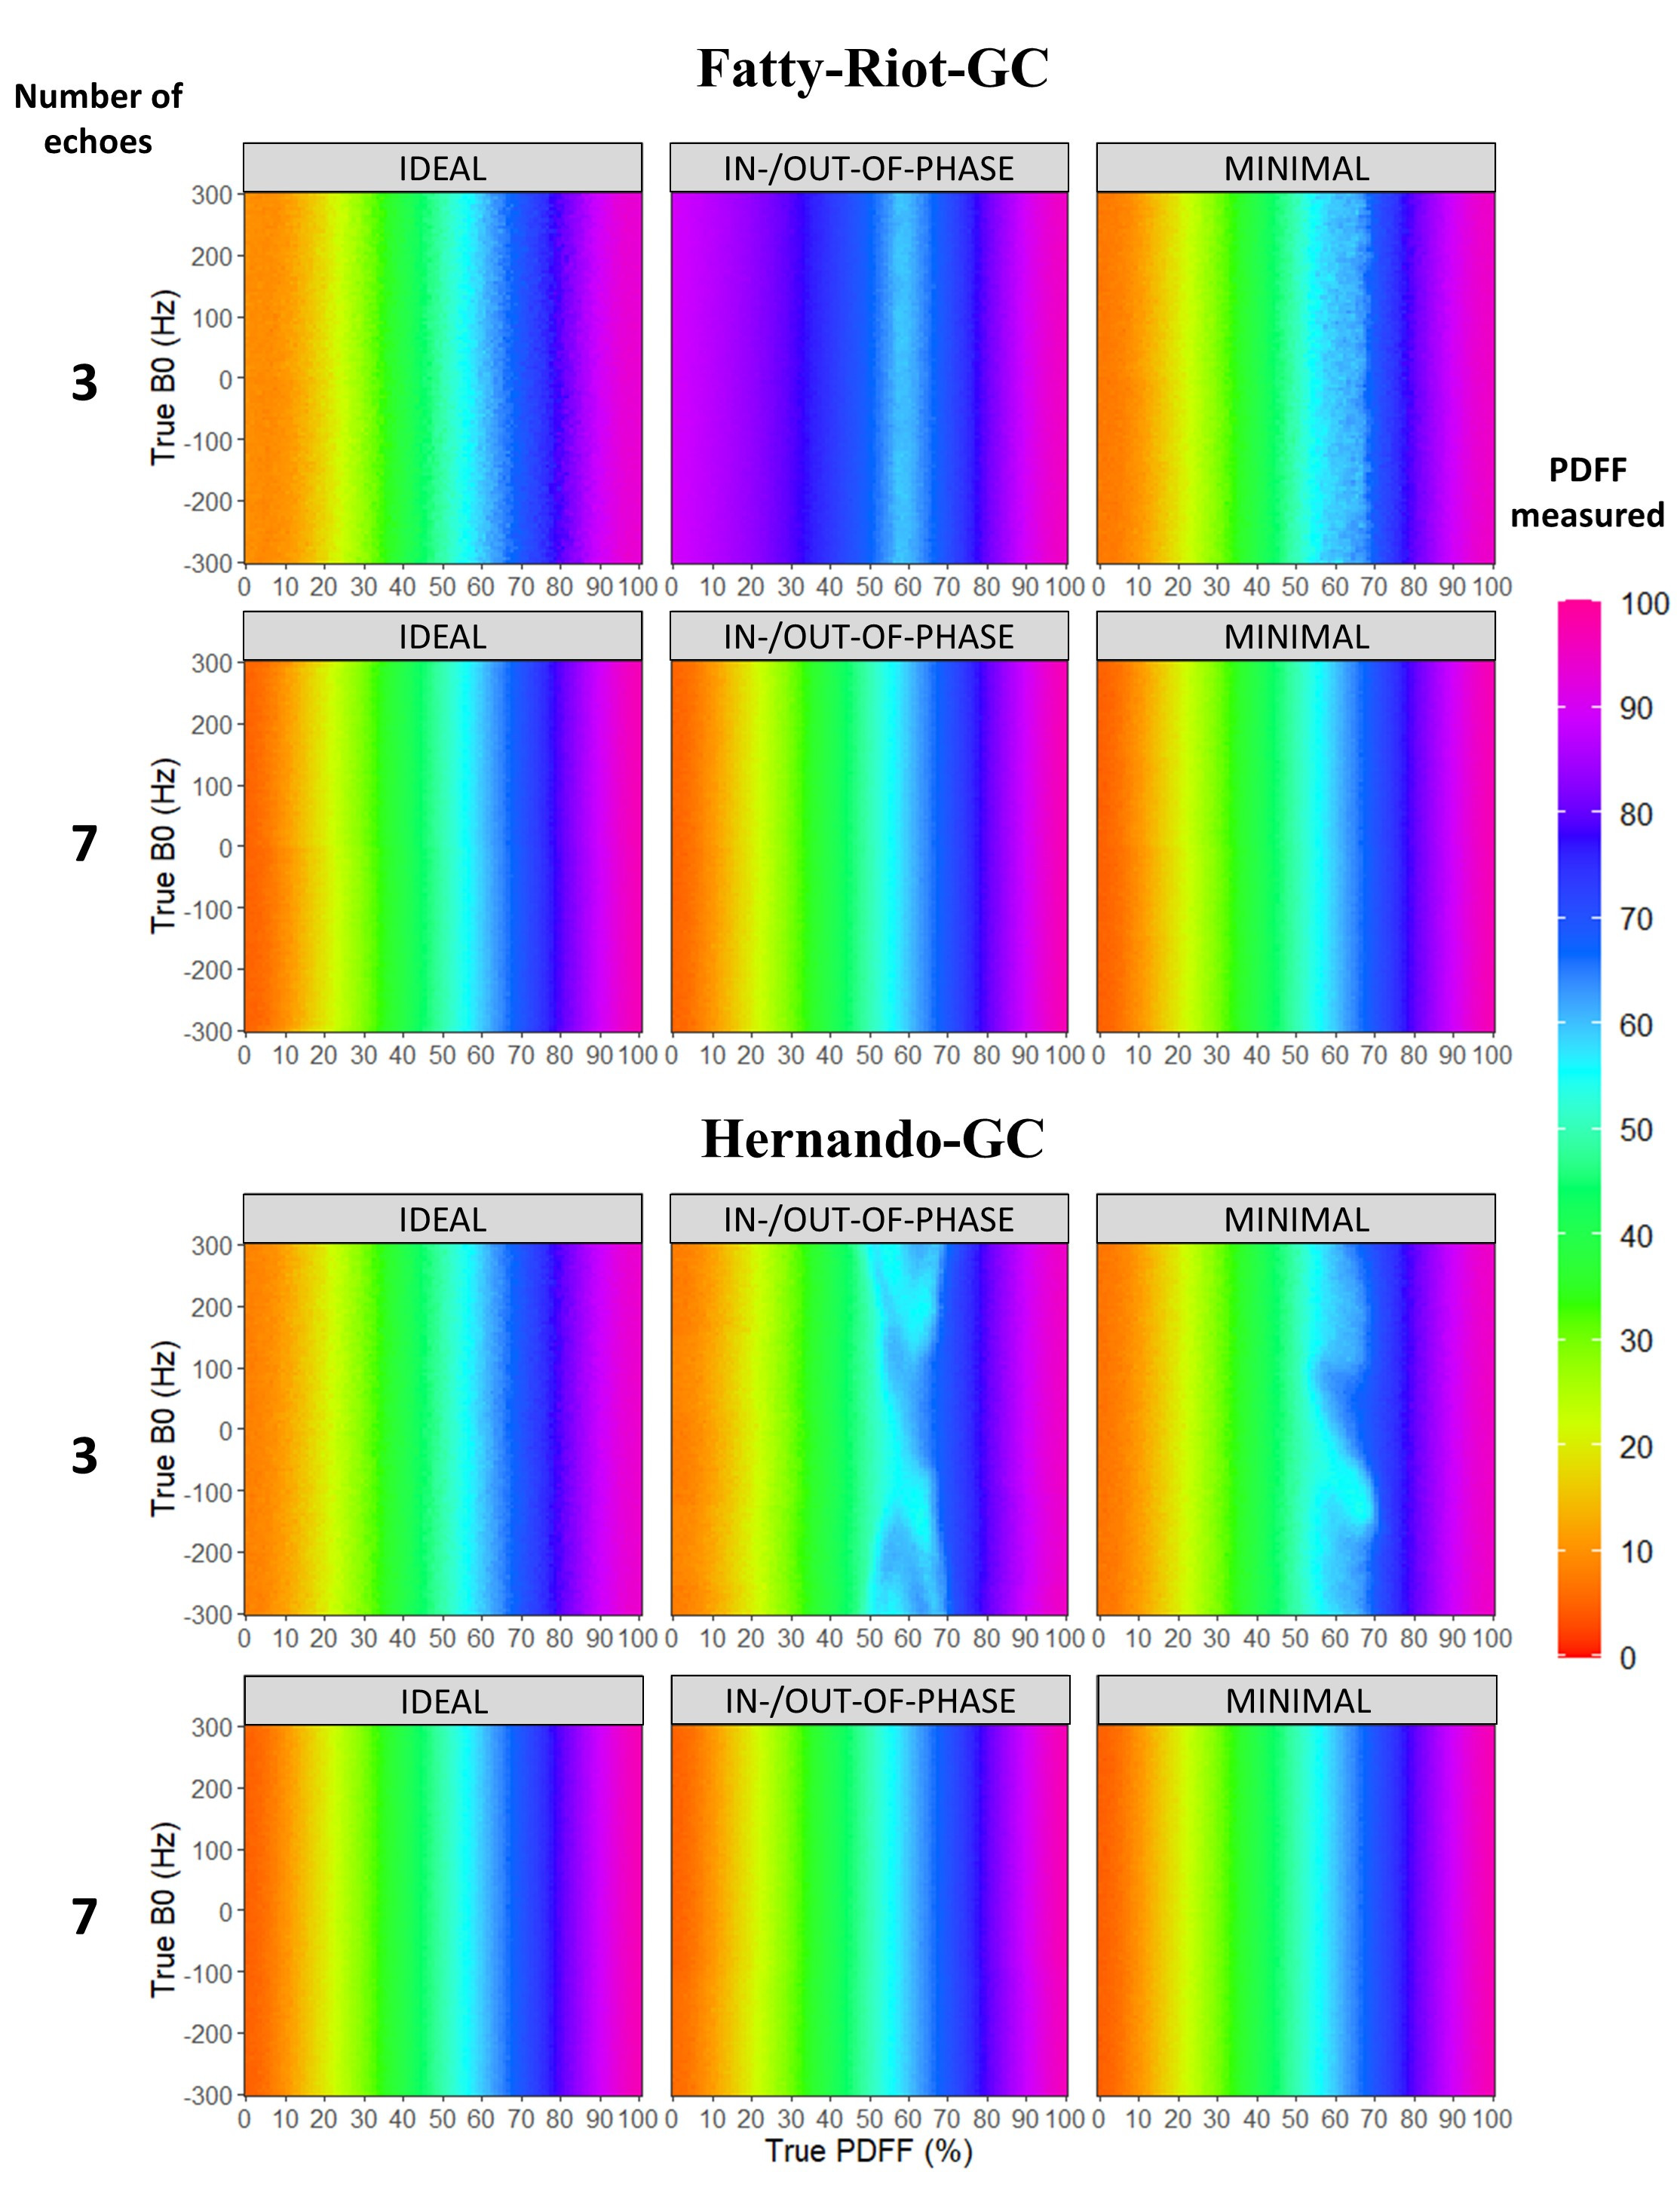
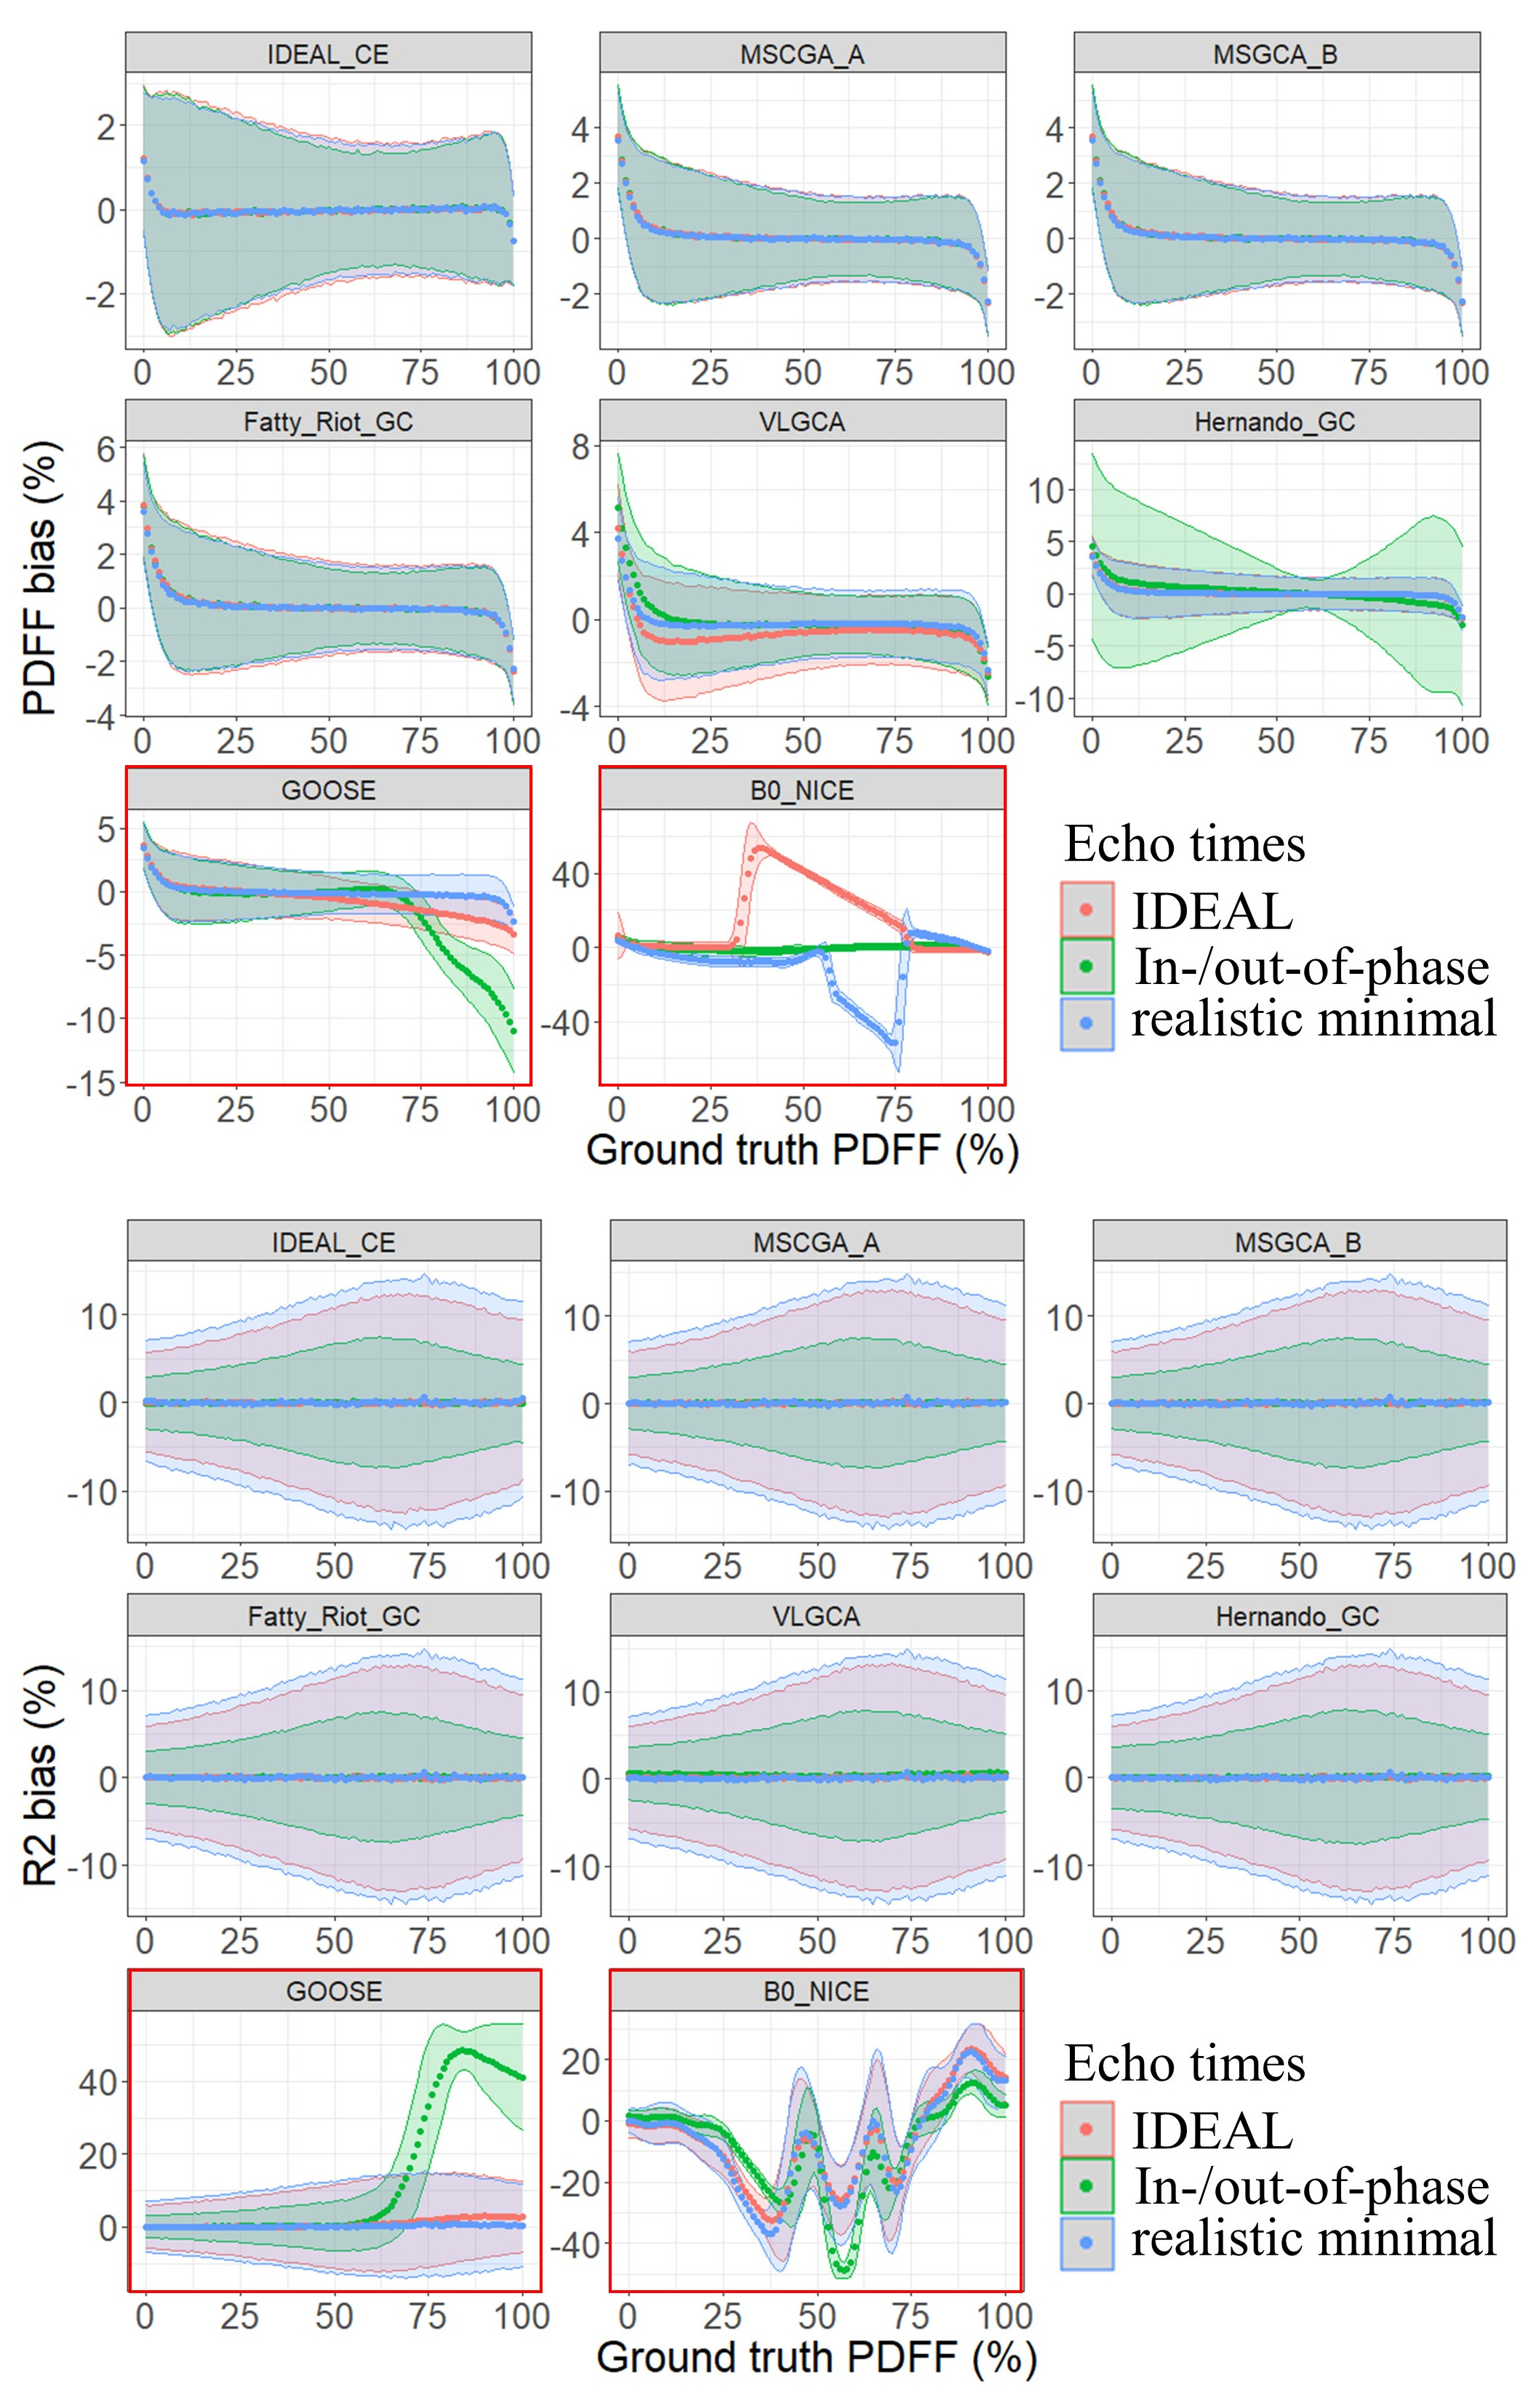
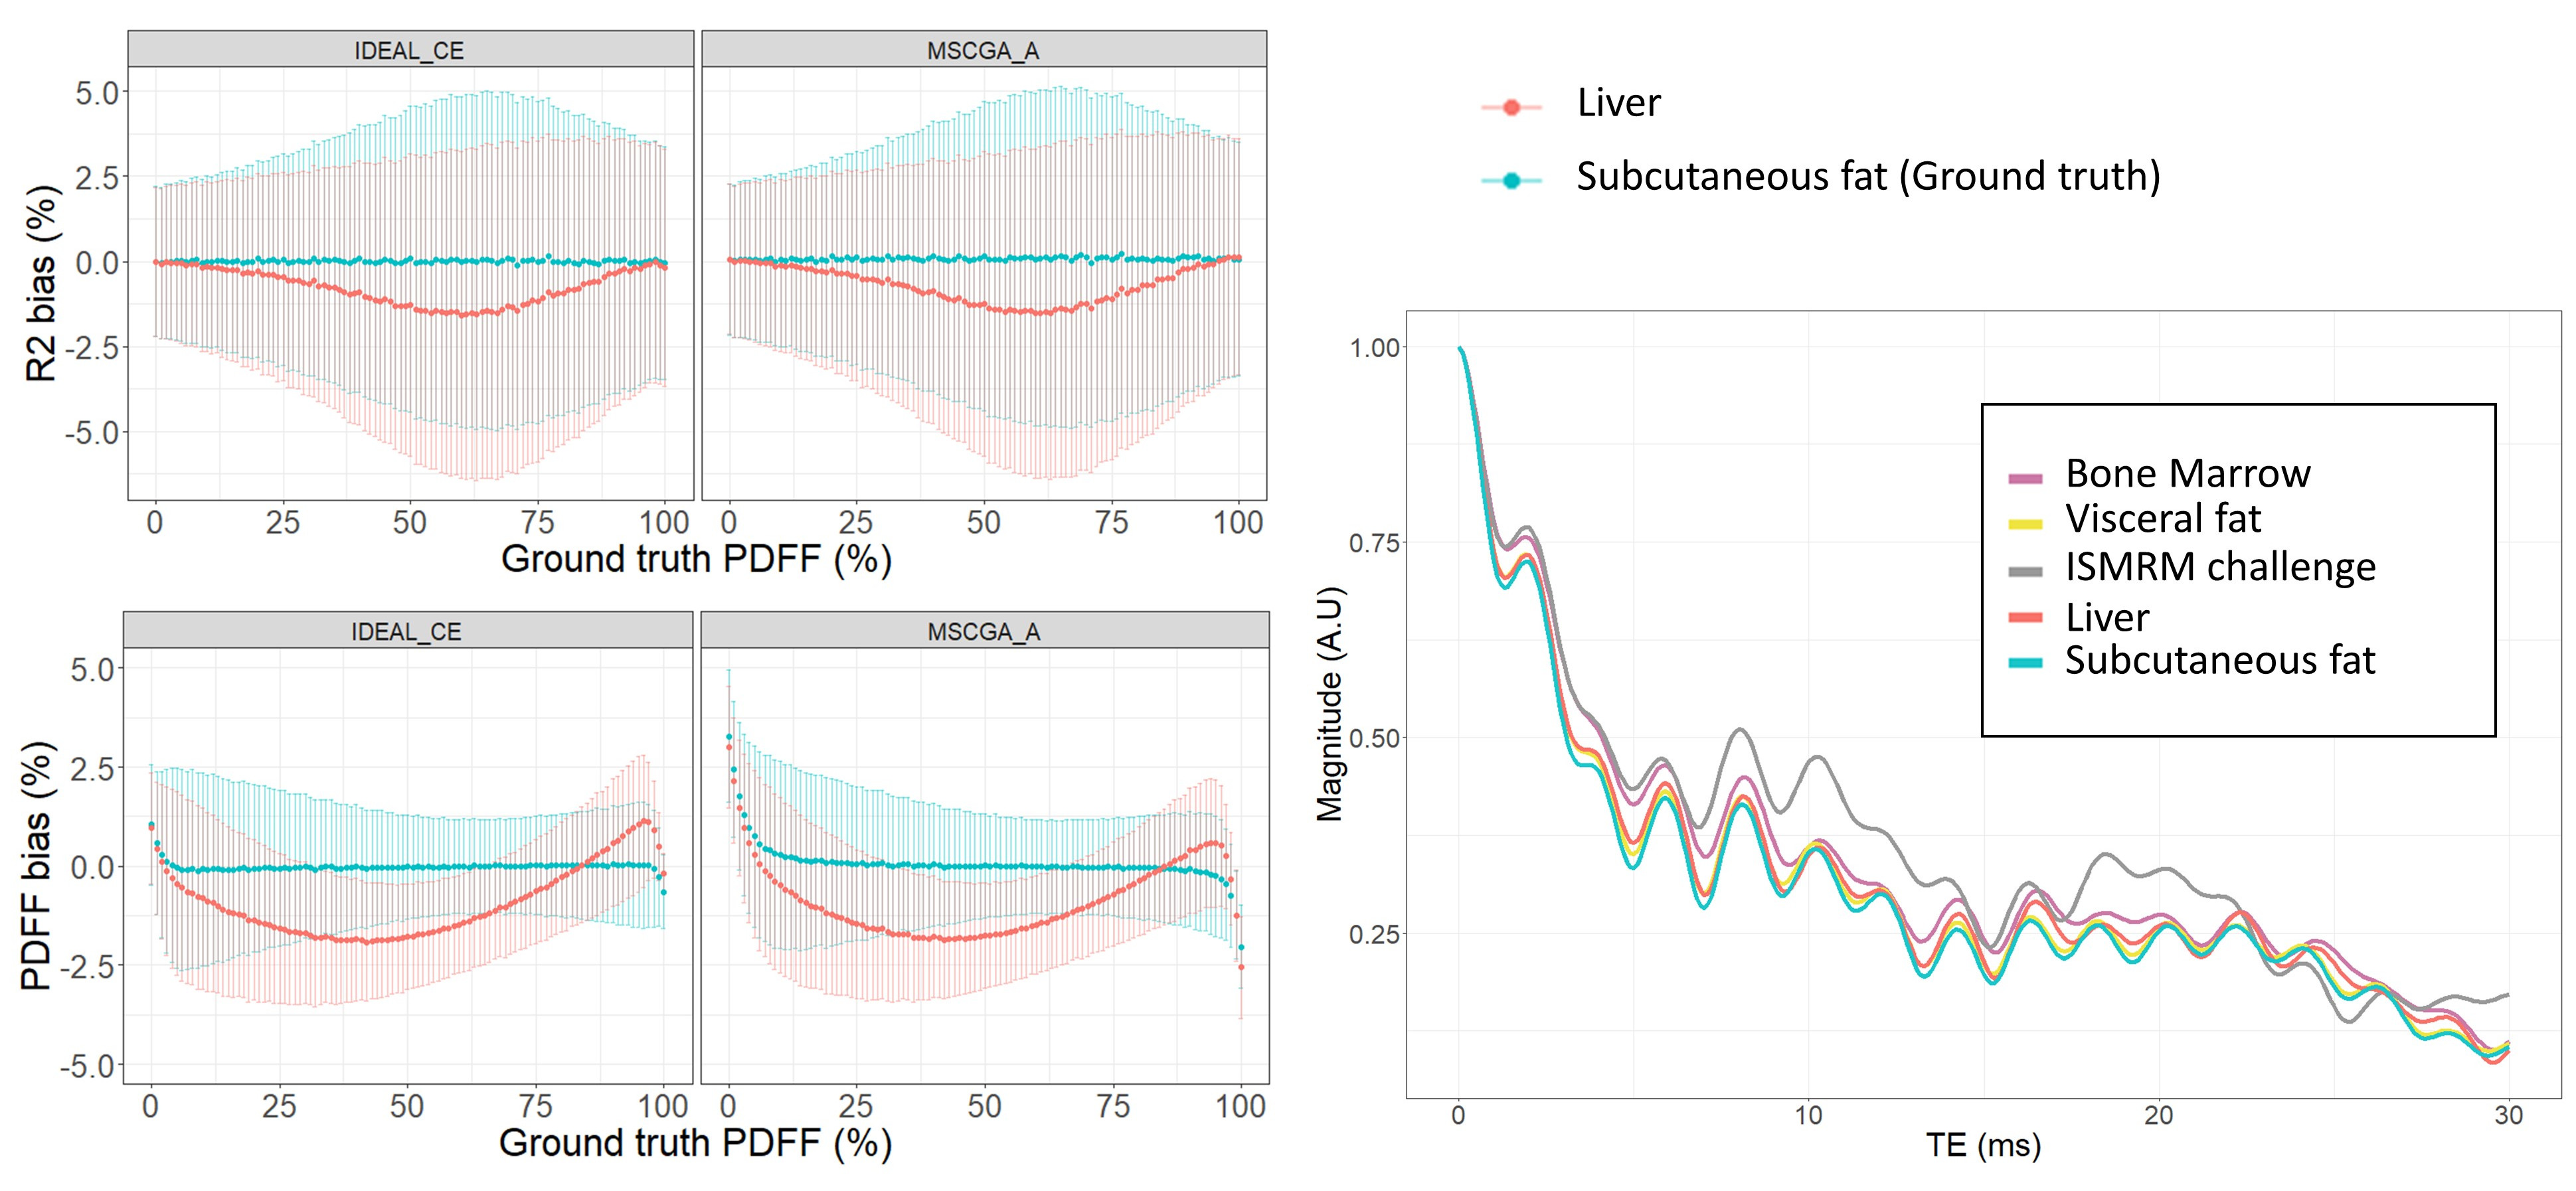
Expectedly (Fig 1), the echoes number and spacing schemes affected the performances of the algorithms. Several pitfalls were noticeable for 3 TE: fat/water swaps were present in Fatty-Riot-GC, B0-NICE, IDEAL-CE and VLGCA. PDFF measured with Hernando-GC were influenced by B0 inhomogeneity (NTE=3 IN/OPP; MINIMAL) as well as with VLGCA. GOOSE led to a significant global bias (>15%). For NTE>=5, B0-NICE and GOOSE proved to be highly biased and were not further investigated whereas other algorithms demonstrated robustness to B0 and fat/water swaps.Increasing the number of TE improved PDFF precision, absolute bias error decreased significantly (p<0.0001) for all algorithms. However, VLGCA and Hernando-GC, were still influenced by echo spacing for PDFF quantification (Fig3). Considering the best echo spacing for PDFF measurement, algorithms provided similar PDFF bias (bias<0.2 LOA<4%) (Fig 3). Extrema PDFF (<10% or >90%) remained challenging for most algorithms and differentiated their performances: for NTE=7, LOA below 10% PDFF were 1.2% for IDEAL-CE and were superior to 4% for other algorithms.
Algorithms provided a low T2* mean bias (1ms <) but with a large LOA depending on echo times (LOAIN/OUT-OF-PHASE=11ms, LOAIDEAL=20ms, LOAMINIMAL=22ms).Computational times for processing one slice with 7 echo times ranged from TB0-NICE=1.81±0.24s, TIDEAL-CE=1.95±0.02s, to TFatty-Riot-GC=51.34±18.04s and TGOOSE = 5455.18 ± 7122.50s.
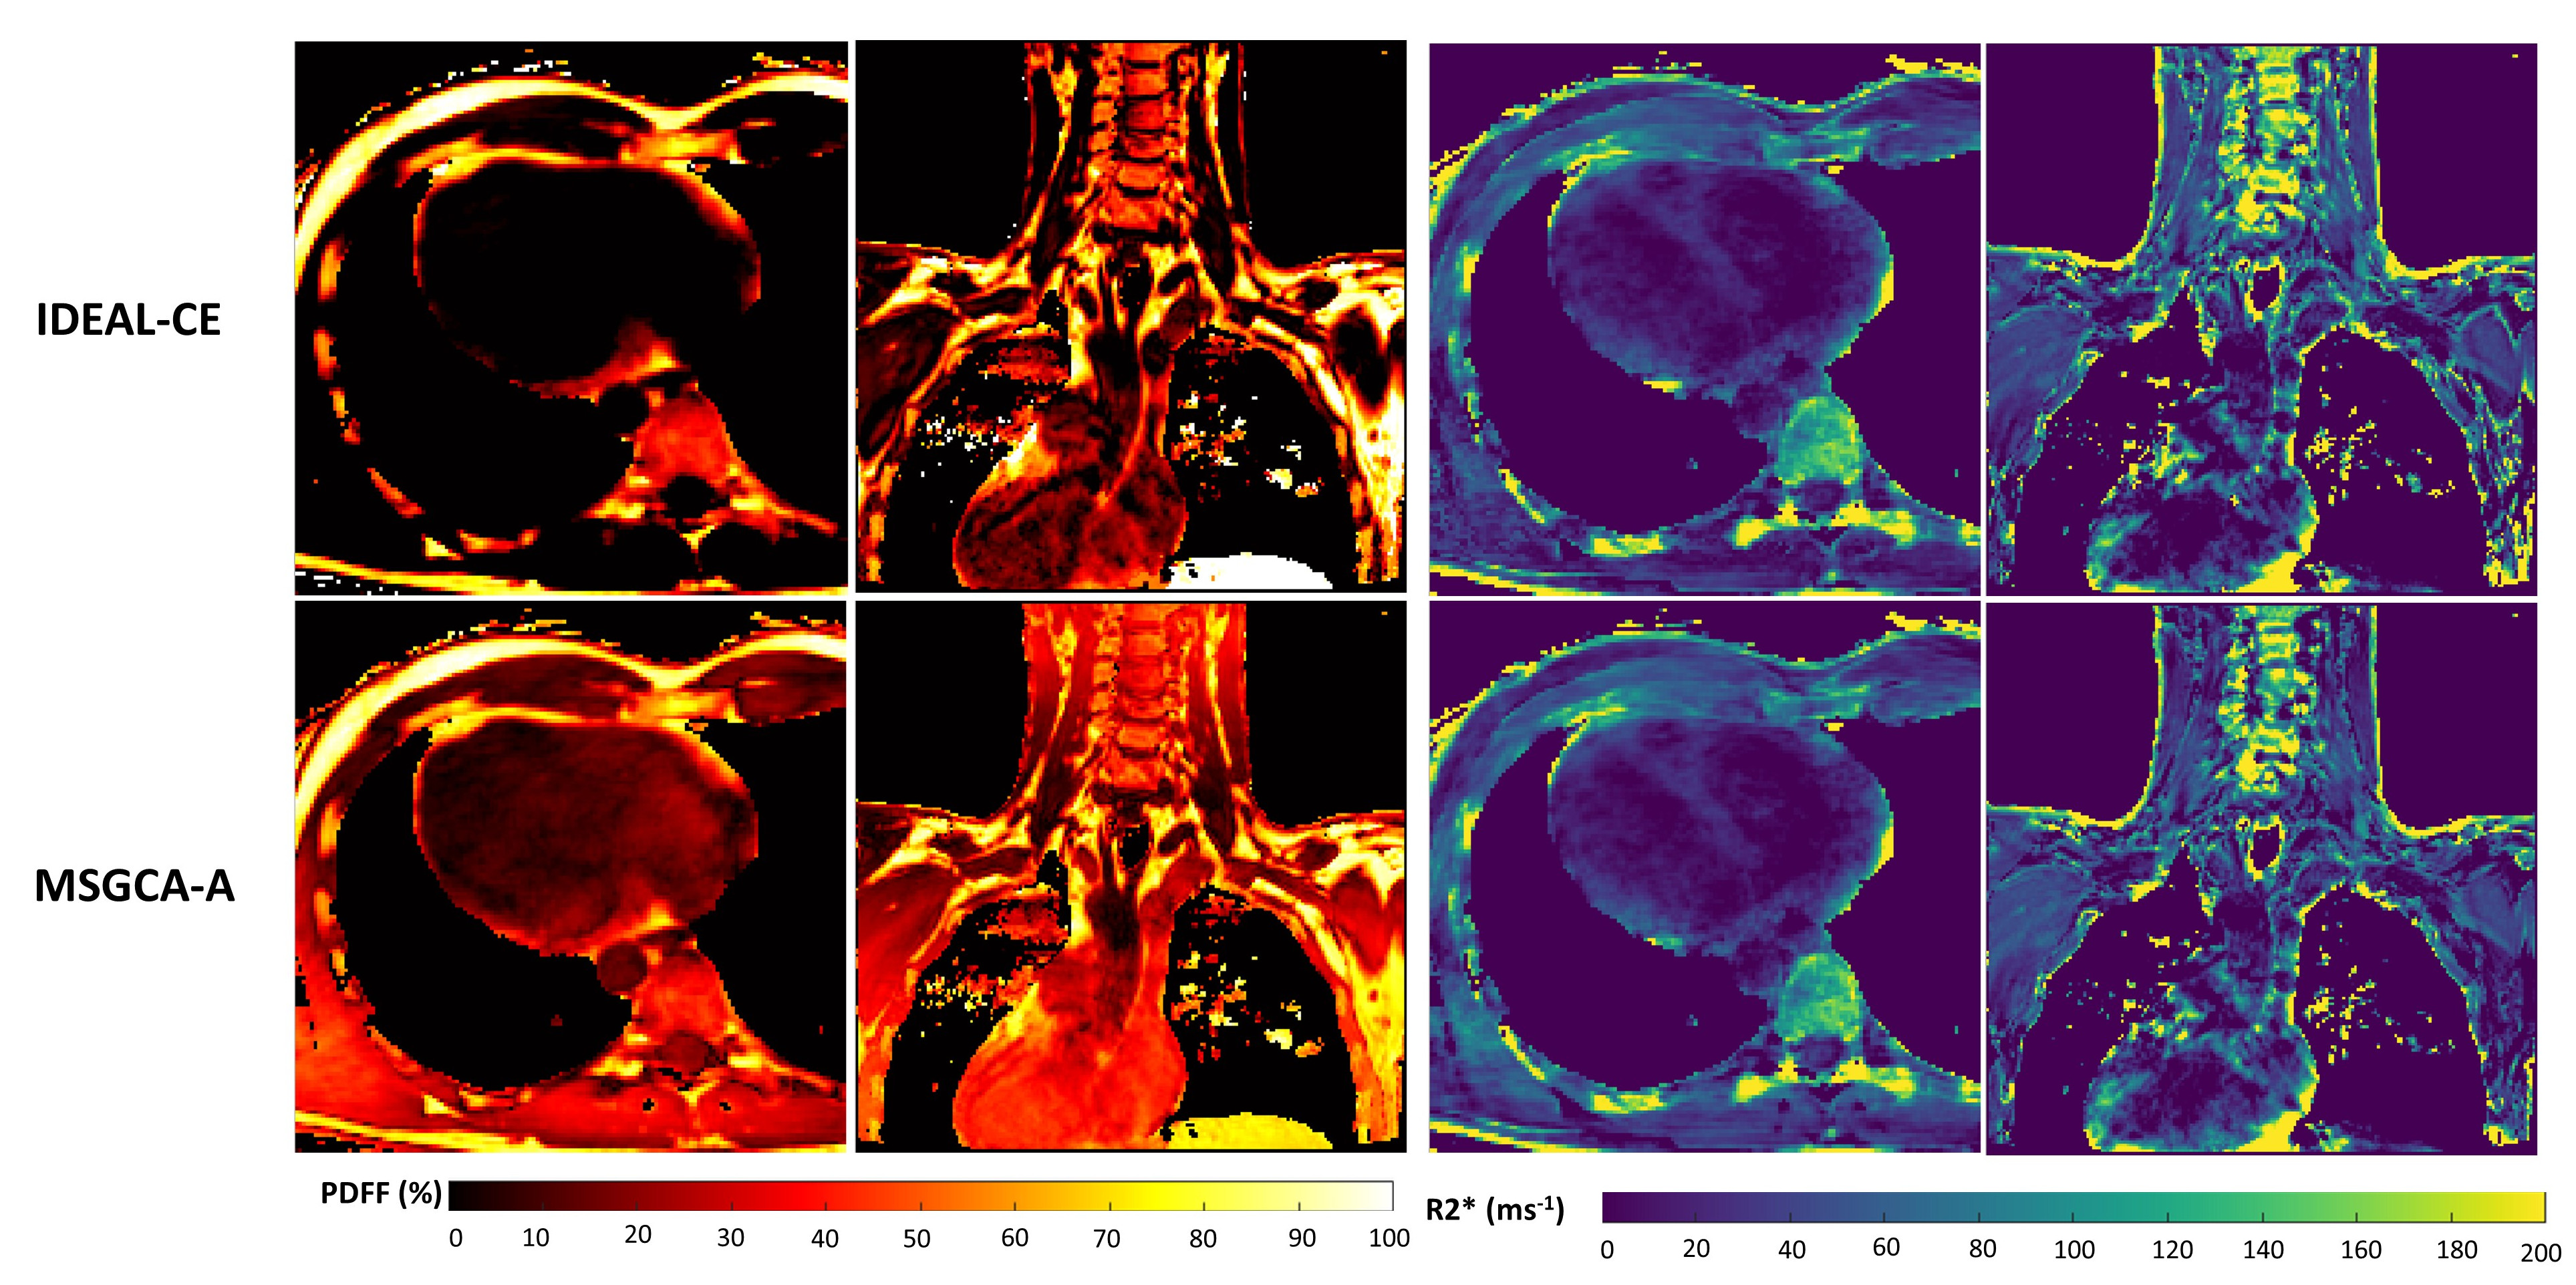
Among two comparable algorithms (IDEAL-CE and MSGCA-A) with PDFF LOA differences of only 2%, challenging datasets (cardiac and supraclavicular volumes at 3T with strong B0 inhomogeneity) demonstrated significant PDFF discrepancies in water tissues(Fig4). Finally, DIXON model spectrum dependency was assessed. Processing data with a different spectrum than the one employed for simulation, algorithms at NTE=9 provided PDFF and R2* mean bias of 1% and 0.7ms(Fig.5).
Discussion
Establishing an open-source toolbox to evaluate fat water separation algorithms offers the possibility to better appreciate novel algorithms. This benchmarking also allows acquisition parameters optimization (echo number and spacing) to obtain more accurate quantitative maps. With only 3 echoes, most algorithms suffered of fat-water swaps or errors due to B0 inhomogeneities(Fig 2) while 5 or 7 echoes provide a significant improvement in reliability and precision. However, for VLGCA/Hernando-GC/B0-NICE/GOOSE, the precision of PDFF measurement was still greatly dependent of the echo spacing. T2* precision depends on the longest echo time therefore at number of echo fixed, in-phase/out-of-phase should be preferred to IDEAL or minimal echo spacing, whereas at fixed TR, minimal echo spacing should be preferred to the other echo spacing for T2* accuracy.For PDFF quantification, graph-cut approaches provided similar results while IDEAL-CE provided more reliable results in PDFF extrema. This resulted in more realistic values in-vivo(Fig4). Algorithms running time were within seconds to minutes (apart from GOOSE). Interestingly, processing data with a different spectrum from the simulation led to small biases in PDFF and T2*, thus relevant spectrum remain essential to characterize the fat depots and further fatty acid composition. Multiple T2* values were not investigated, considering the limited precision observed with up to NTE=9.
Conclusion
An open-source multi-language toolbox was developed to evaluate state-of-the-art open-source algorithms for fat-water separation. Bias and limits of agreement revealed disparities between algorithms. Extrema PDFF remains challenging for accurate estimation, impacting challenging in-vivo applications. The importance of the fat spectra was highlighted. The toolbox repository will be available shortly.Acknowledgements
This project has received financial support from the CNRS through a MITI program and was performed within a laboratory member of France Life Imaging network. (grant ANR-11-INBS-0006)References
1. Reeder, S. B., Hu, H. H. & Sirlin, C. B. Proton density fat-fraction: A standardized mr-based biomarker of tissue fat concentration. J. Magn. Reson. Imaging 36, 1011–1014 (2012).
2. Starekova, J. & Reeder, S. B. Liver fat quantification: where do we stand? Abdom Radiol 45, 3386–3399 (2020).
3. Hu, H. H. et al. ISMRM workshop on fat-water separation: Insights, applications and progress in MRI. Magnetic Resonance Medicine 68, 378–388 (2012).
4. Hernando, D., Kellman, P., Haldar, J. P. & Liang, Z.-P. Robust water/fat separation in the presence of large field inhomogeneities using a graph cut algorithm. Magn. Reson. Med. NA-NA (2009) doi:10.1002/mrm.22177.
5. Berglund, J. & Kullberg, J. Three-dimensional water/fat separation and T 2* estimation based on whole-image optimization-Application in breathhold liver imaging at 1.5 T. Magnetic Resonance Medicine 67, 1684–1693 (2012).
6. Berglund, J. & Skorpil, M. Multi-scale graph-cut algorithm for efficient water-fat separation: Multi-Scale Graph-Cut Water/Fat Separation. Magn. Reson. Med. 78, 941–949 (2017).
7. Andersson, J., Ahlström, H. & Kullberg, J. Water-fat separation incorporating spatial smoothing is robust to noise. Magnetic Resonance Imaging 50, 78–83 (2018).
8. Cui, C., Wu, X., Newell, J. D. & Jacob, M. Fat water decomposition using globally optimal surface estimation (GOOSE) algorithm. Magn Reson Med 73, 1289–1299 (2015).
9. Boehm, C., Diefenbach, M. N., Makowski, M. R. & Karampinos, D. C. Improved body quantitative susceptibility mapping by using a variable‐layer single‐min‐cut graph‐cut for field‐mapping. Magn. Reson. Med. 85, 1697–1712 (2021).
10. Liu, J. & Drangova, M. Method for B0 off-resonance mapping by non-iterative correction of phase-errors (B0-NICE): B0 Mapping with Multiecho Data. Magn. Reson. Med. 74, 1177–1188 (2015).
11. Bydder, M. et al. Constraints in estimating the proton density fat fraction. Magnetic Resonance Imaging 66, 1–8 (2020).
12. Hamilton, G. et al. In vivo characterization of the liver fat 1H MR spectrum. NMR Biomed 24, 784–790 (2011).
13. Leporq, B., Lambert, S. A., Ronot, M., Vilgrain, V. & Van Beers, B. E. Quantification of the triglyceride fatty acid composition with 3.0 T MRI. NMR Biomed 27, 1211–1221 (2014).
14. Ren, J., Dimitrov, I., Sherry, A. D. & Malloy, C. R. Composition of adipose tissue and marrow fat in humans by 1 H NMR at 7 Tesla. J. Lipid Res. 49, 2055–2062 (2008).
15. Sullivan, D. C. et al. Metrology Standards for Quantitative Imaging Biomarkers. Radiology 277, 813–825 (2015).
Figures