0112
Quantitative 23Na-MRI of the intervertebral disk at 3T1University of Zurich, Zurich, Switzerland, 2University Hospital Zurich, Zurich, Switzerland
Synopsis
Monitoring the tissue sodium content (TSC) in the intervertebral disk geometry by MRI is sensitive measure to diagnose degenerative disk disease (DDD) and of lumbar back pain (LBP) in intervertebral disks. However, application of quantitative sodium concentration measurements in 23Na-MRI is highly challenging due to the lower in vivo concentrations and smaller gyromagnetic ratio. Moreover, imaging the intervertebral disk geometry places higher demands because the necessary RF volume coils produces highly inhomogenous transmit field patterns. In this study, we reported for the first time quantitative sodium concentration in the intervertebral disks at clinical field strengths (3T).
Introduction
Monitoring the tissue sodium content (TSC) in the intervertebral disk geometry by MRI is a sensitive measure to estimate the changes in the PG content of the intervertebral disk which is a biomarker of degenerative disk disease (DDD) and of lumbar back pain (LBP)1. Although 23Na-MRI offers valuable supplementary information to 1H-MRI, the practical implementation of tissue sodium quantification poses high demands on the measurement accuracy and precision2. First, signal-to-noise ratio of 23Na-MRI is significantly lower compared to 1H-MRI. This is mainly because sodium concentration in the tissue is much lower (45mM to 350 mM) and the smaller gyromagnetic ratio yielding an 11000 times smaller 23Na-signal relative to proton MRI. Second, as a spin-3/2 nucleus, 23Na signal poses rapid biexponential transverse relaxation and may also exhibit energy eigenstate shifting as a result of the local electric field gradients due to the long-lived spatial orientation of the nuclear electric quadrupole moment. Third, the signal modulation due the inhomogeneties in the main magnetic field appears as a significant challenge for the accurate quantification. The quantification of the tissue sodium concentration (TSC) potentially allows highly relevant clinical information such as inter- and intra-individual comparability necessary for patient stratification and for therapy monitoring. However, quantitative analysis of sodium concentration from 23Na-MRI requires accurate control of factors modulating the sodium signal. In this study, we reported for the first time quantitative sodium concentration in the intervertebral disks at clinical field strengths (3T) by deploying 23Na-MRI.Methods
All measurements were performed on a Siemens 3T whole-body MRI scanner. A dual-tuneable ( 1H/ 23Na) chest coil (Rapid Biomedical, Germany) was used for reception of the 1H, and for transmission and reception of 23Na signal. The coil composed mainly from three modular components: upper component (2 Tx 23Na, 2 Tx 1H), flexible component (2 Rx 23Na, 2 Rx 1H) and bottom component (2 Tx 23Na, 2ch Rx 23Na). Imaging with the same protocol was performed in the intervertebral disks of in total five healthy volunteers. The phantom measurements were performed using a volume cylindrical polyethylene container filled with 150 mmol/L NaCl. The same protocol and data processing as detailed below were applied. Additionally, 5 cylindrical phantom tubes filled with 50, 100, 150 ,200, 250 mmol/L NaCl with 5% agarose gel were used as a reference sodium signal intensity in experiments. A global RF pulse calibration was performed by adjusting the transmitter voltages between 200-340V using a non-localized rectangular 1 ms-length RF pulse to ensure a true 90° flip angle at the center of the coil geometry. The spin density-weighted 23Na images were acquired using a gradient echo (GRE) pulse sequence with the following parameters in supine position: TR/TE= 320/1.98 ms, FOV=320 x 320 mm, voxel size= 5x5x10 mm, number of slices= 3, NEX=128,nominal flip angle 90°, total acquisition time= 5.56 min. T1- and T2-weighted 1H anatomical imaging protocol was performed to facilitate image segmentation. Sodium B1 mapping was performed using double-angle method. TSC was calculated via an intensity calibration curve fitted to the signal of the reference tubes. To minimize the influence of inhomogeneity on 23Na-MRI, all sodium-weighted images were subjected to voxel-wise -field correction. In vivo TSC values are presented in mmol/L.Results
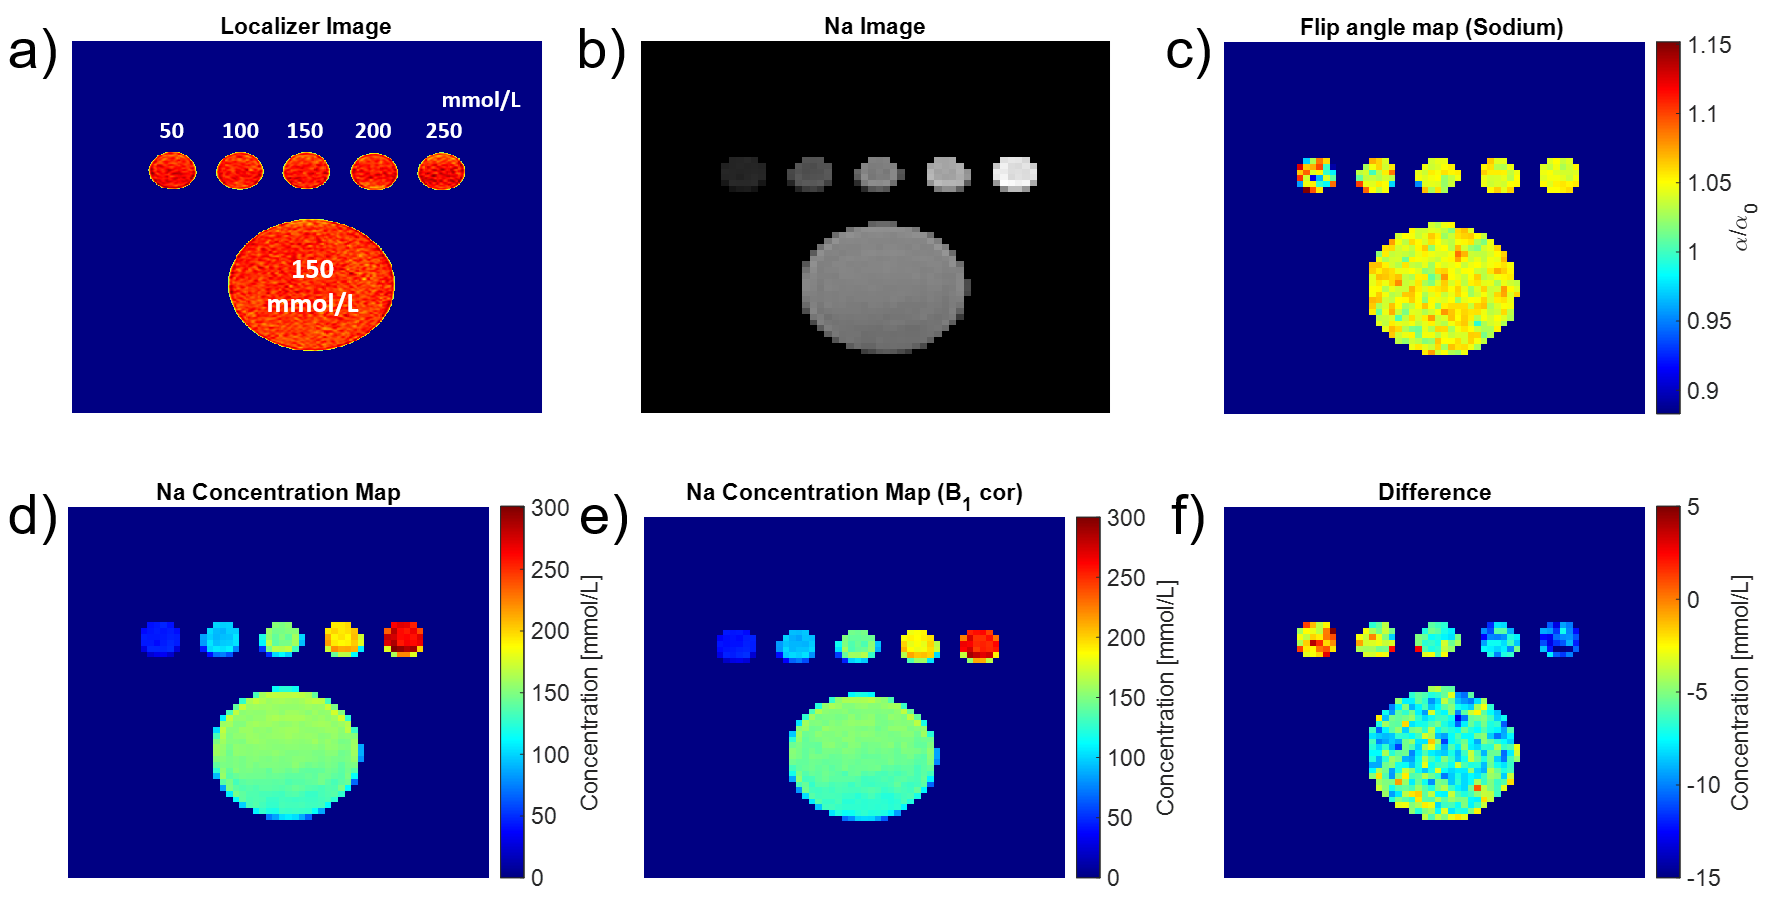
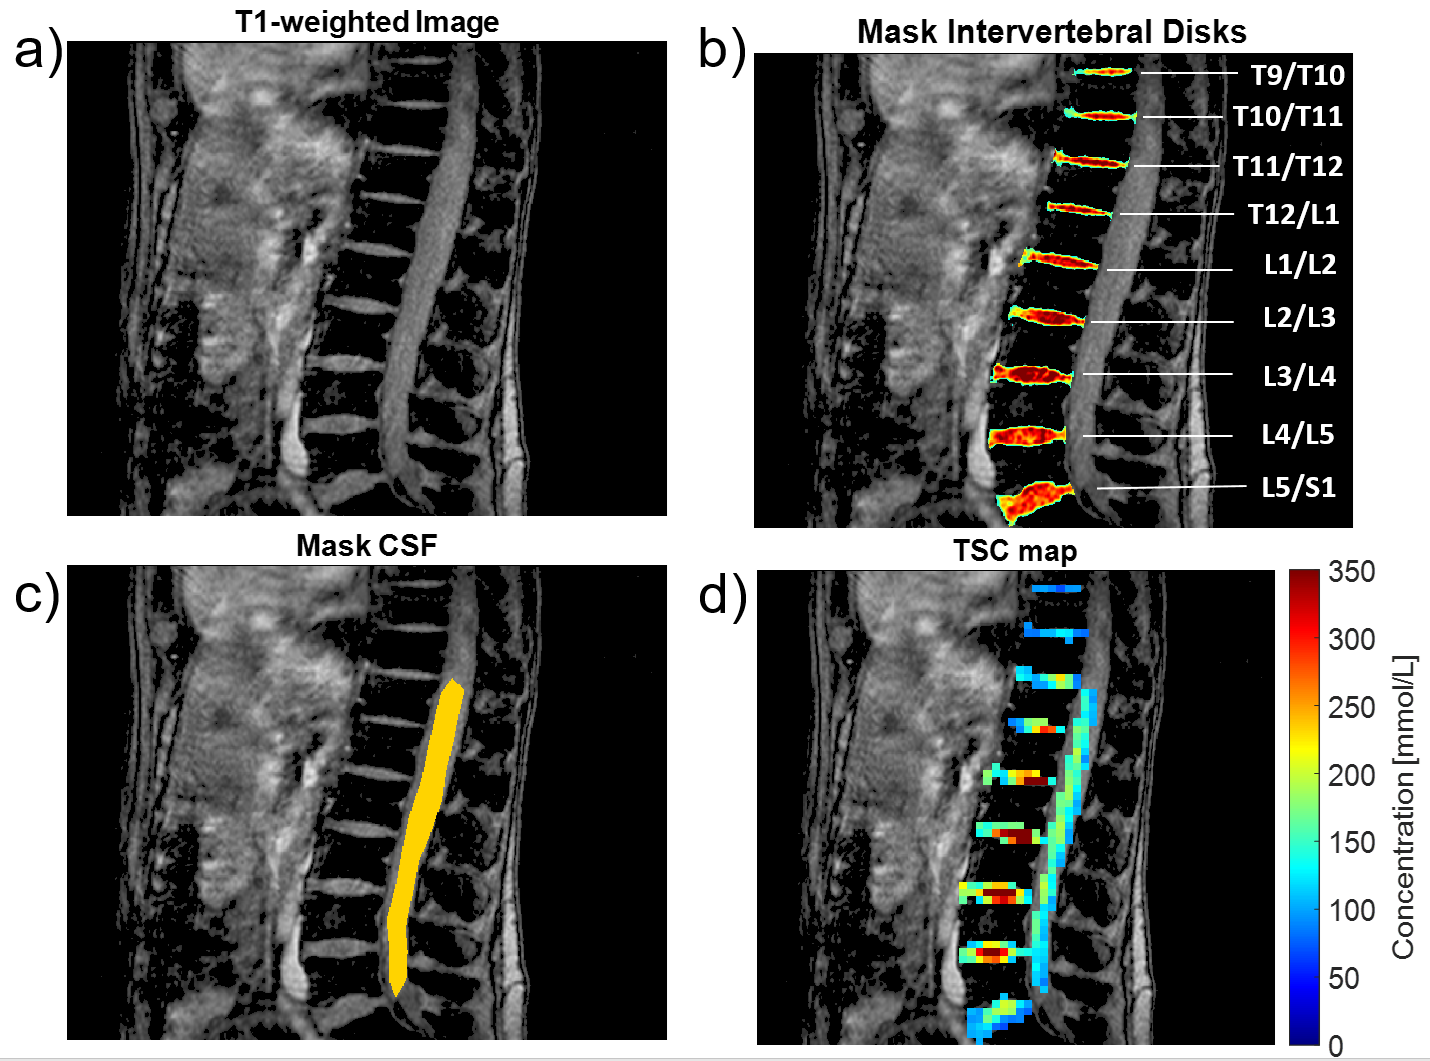
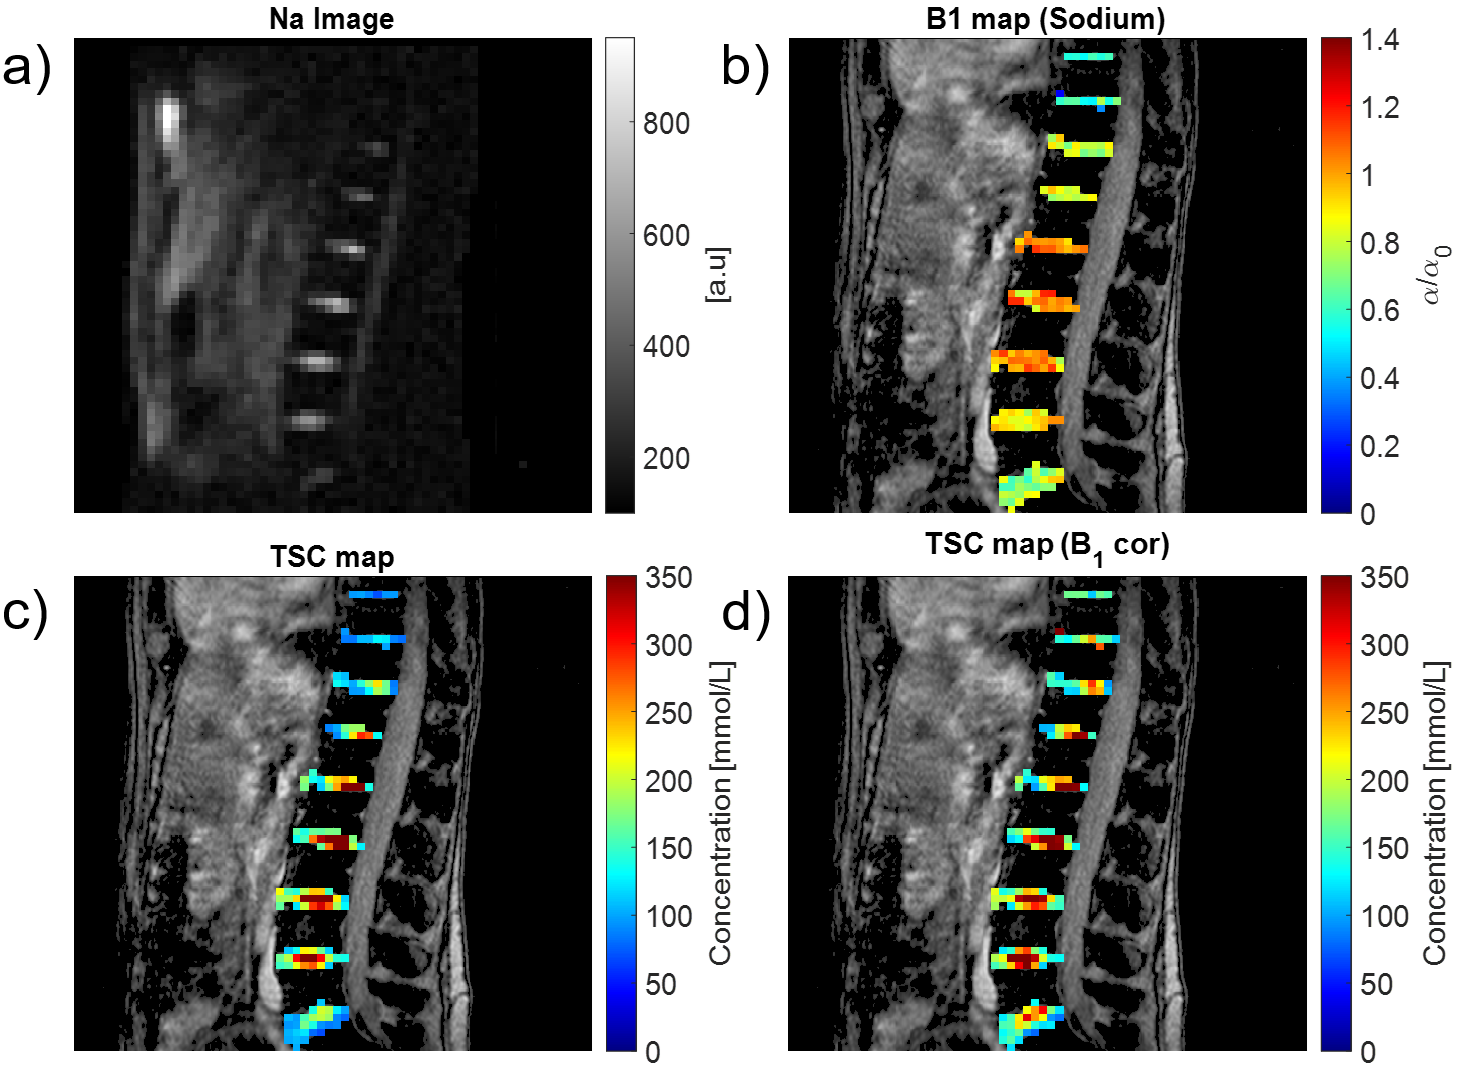
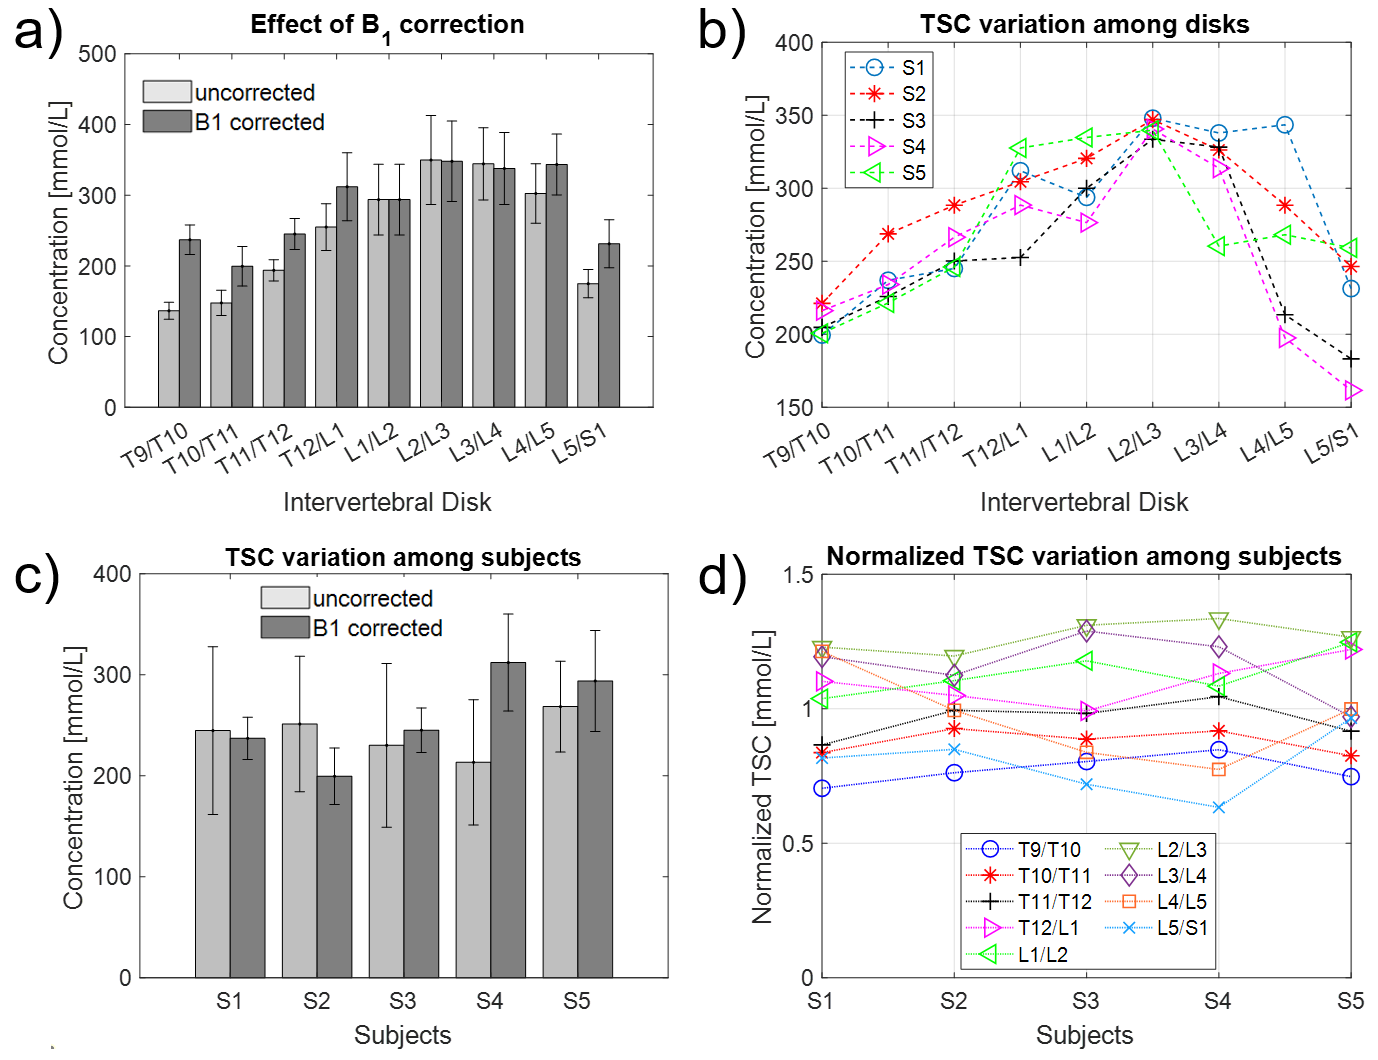
Figure 1 shows the dual-tunable chest coil and simulation of transmit field efficiency of the coil, a spin-density weighted localizer and flip angle map for proton signal in the intervertebral disks. Figure 2 shows the effect of field in quantitative sodium imaging in a homogenous phantom. Figure 3. shows the ROI placement using the T1- weighted 1H images. Figure 4 presents the effect of field in quantitative sodium imaging in an exemplary subject. Figure 5 shows quantitative analysis of TSC within the individual disks and among different subjects.Discussion
In principle, in order to ensure an accurate quantitative TSC measurement, the acquired 23Na signal must be corrected for all contrast mechanisms apart from sodium concentration. The B1 field at the sodium Larmor frequency emitted from a typical body-volume antenna poses significant magnetic field inhomogenties along the spine directly affecting the spin evolution and ultimately the 23Na signal. In this study, we reported for the first time quantitative sodium concentrations in the intervertebral disks at clinical field strengths (3T). No B0 correction was performed because the shimming is highly challenging in the spinal cord geometry using the standard shim procedure mainly because not all inhomogeneities can be compensated with only first‐ and second‐order shim coils. Higher order shimming and slice-wise dynamic shimming is needed for sufficient compensation. It is important to acquire images at a short TE to avoid the signal loss from the fast-relaxing component. We acquired images at TE=1.98 ms leading to a residual weighting of the signal which can be further reduced by using ultra-short echo time acquisition schemes3. Further limitations include small number of participants as well as missing reproducibility assessment.Conclusion
Quantitative 23Na-MRI is a promising tool to measure clinically relevant longitudinal changes in the intervertebral disks. The results of this work have the potential to integrate quantitative 23Na-MRI into the clinical studies such as degenerative disk disease and establishing alternative scoring schemes to existing morphological scoring such as Pfirrmann score.Acknowledgements
No acknowledgement found.References
1. Luoma K, Riihimaki H, Luukkonen R, Raininko R, Viikari-Juntura E and Lamminen A 2000 Low back pain in relation to lumbar disc degeneration Spine (Phila Pa 1976) 25 487-92
2. Madelin G, Lee J S, Regatte R R and Jerschow A 2014 Sodium MRI: methods and applications Prog Nucl Magn Reson Spectrosc 79 14-47
3. Nagel A M, Laun F B, Weber M A, Matthies C, Semmler W and Schad L R 2009 Sodium MRI using a density-adapted 3D radial acquisition technique Magnetic resonance in medicine : official journal of the Society of Magnetic Resonance in Medicine / Society of Magnetic Resonance in Medicine 62 1565-73
Figures
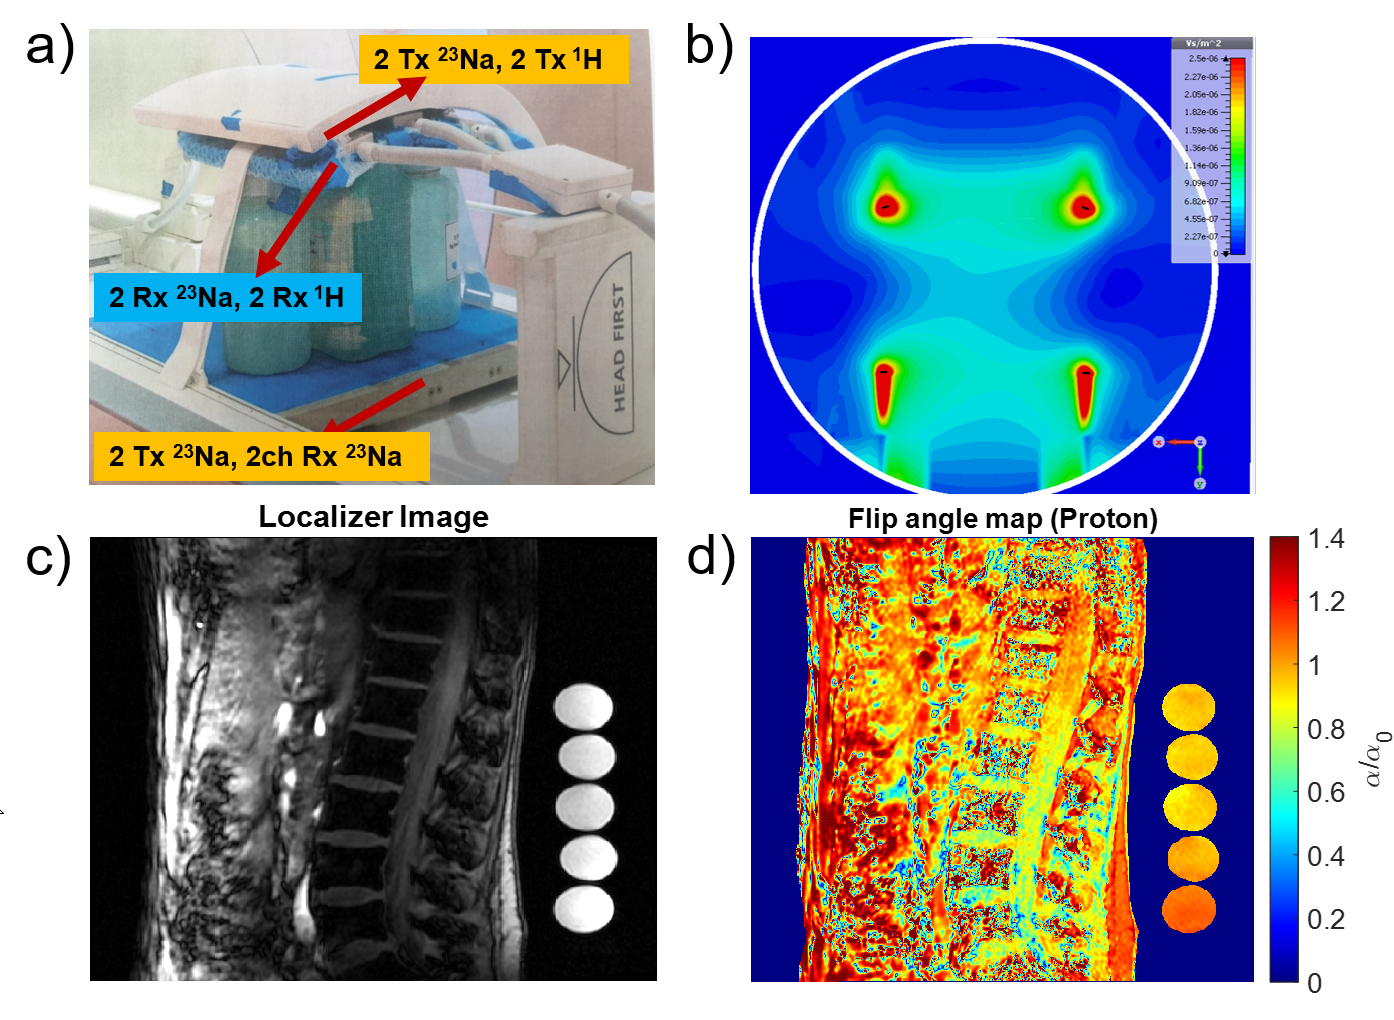
(a) The dual-tuneable (1H/23Na) chest coil used for reception of the 1H (123.2 MHz), and for transmission and reception of 23Na signal (32.6 MHz). (b) Simulation of transmit field efficiency of the coil (V/m2) in the transverse axis showing that while the field has relatively homogenous pattern in the close vicinity of the transmit elements, it decreases towards the center of the coil (c) Localizer image of the intervertebral disks obtained as a spin-density weighted sagittal image (d) Flip angle map for proton signal.