0111
In Vivo High Frame Rate Cartilage Strain During Knee Varus Combining Spiral DENSE MRI and Compressed Sensing1Paul M. Rady Department of Mechanical Engineering, University of Colorado, Boulder, CO, United States, 2Biomedical Engineering Program, University of Colorado, Boulder, CO, United States
Synopsis
Displacement encoding with stimulated echoes (DENSE) MRI is used to calculate pixel-level deformation maps of soft tissues under repetitive motion. It is a powerful technique that can quantify the mechanical behavior of tissues from displacement. We apply spiral DENSE MRI on human knees and obtain multi-frame displacement and strain maps during varus loading, leading to compressive motion on the medial condyle. Since high SNR DENSE images require long scanning time which is costly and less tolerable for participants, we additionally apply compressed sensing (CS) to reduce the imaging time to less than five minutes.
INTRODUCTION:
DENSE MRI used with displacement under applied loading by MRI (dualMRI) 1 is capable of capturing deformation (e.g. displacements and strain) at high spatial resolution. Mechanical properties of soft tissue are further obtainable 2 which may correlate with diseases including osteoarthritis (OA). However, studies are limited to a single frame analysis which do not reveal how cartilage deforms during motion. In addition, high-contrast DENSE MR images require long scanning times that is burdensome for participants and leads to misregistration errors. In this study, we apply spiral DENSE MRI 3 on in vivo human knees under varus loading and capture multi-frame displacement and strain maps. We also use CS and demonstrate that the imaging time can be significantly reduced.METHODS:
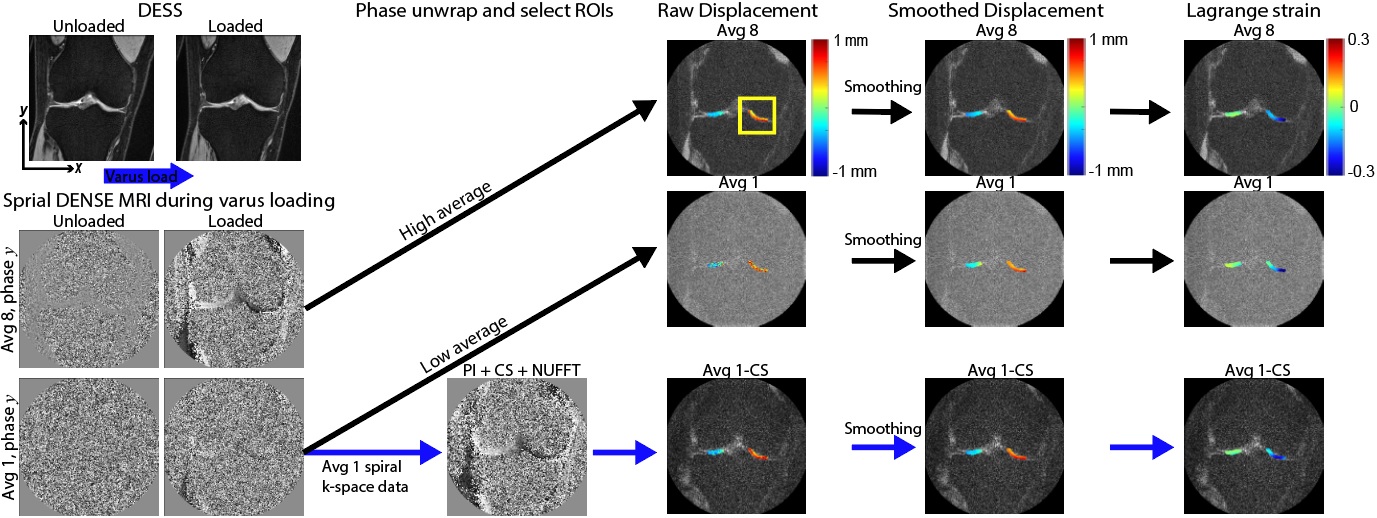
Varus Loading of Human Knees: Four adult subjects (2 males/2 females, age range=26-35) with healthy knees were recruited. Varus loading of the knee was applied to compress the medial tibiofemoral joint to half body weight using a pneumatic actuator applied at the ankle. The load magnitude at the knee was estimated using a moment balance, the known force applied at the ankle, and moment arms extending from the knee joint (centerline) to the load application point at the ankle, and additionally from the knee joint center to the condyle. During imaging, cyclic loading (0.5Hz) was applied to mimic a walking cadence.Multi-frame Spiral DENSE MRI: The right knee of each participant was imaged by a clinical MRI system (3T; Siemens Prismafit). We applied load preconditioning (8 minutes) to reduce the viscoelastic response of cartilage 4 before spiral DENSE MRI. Multi-frame (27) coronal plane images were collected with the following parameters: temporal resolution=40ms, interleaves=10; TE/TR=2.5/20ms, spatial resolution=360×360µm2, slice thickness=1.7mm, and displacement encoding gradient=0.32cycles/mm. We used 1 and 8 image averages to control the SNR and imaging time. Imaging time increased with averages, with 1 and 8 averages requiring approximately 1.7 and 13.6 minutes, respectively. Raw k-space data was saved for analysis by CS.
Displacement and Strain Calculation: Tibiofemoral contact areas were manually segmented using custom software (MATLAB) and used as binary masks. Displacements within the regions of interests (ROIs) were determined from phase data 1 and subsequently smoothed by a locally weighted scatterplot smoothing filter (100 cycles/span=10). Finally, the smoothed displacement was used to calculate in-plane Green-Lagrange strains (E; Fig. 1).
Compressed Sensing (CS): We applied CS analysis using the Berkeley Advanced Reconstruction Toolbox (BART) 5 parallel imaging and compressed sensing command to reconstruct the images. Briefly, the inputs were the spiral trajectory, channel sensitivity map and k-space data along the interleaves. The r value was 0.01 and all processes underwent five iterations. CS was applied on the low SNR k-space data, frame 27.
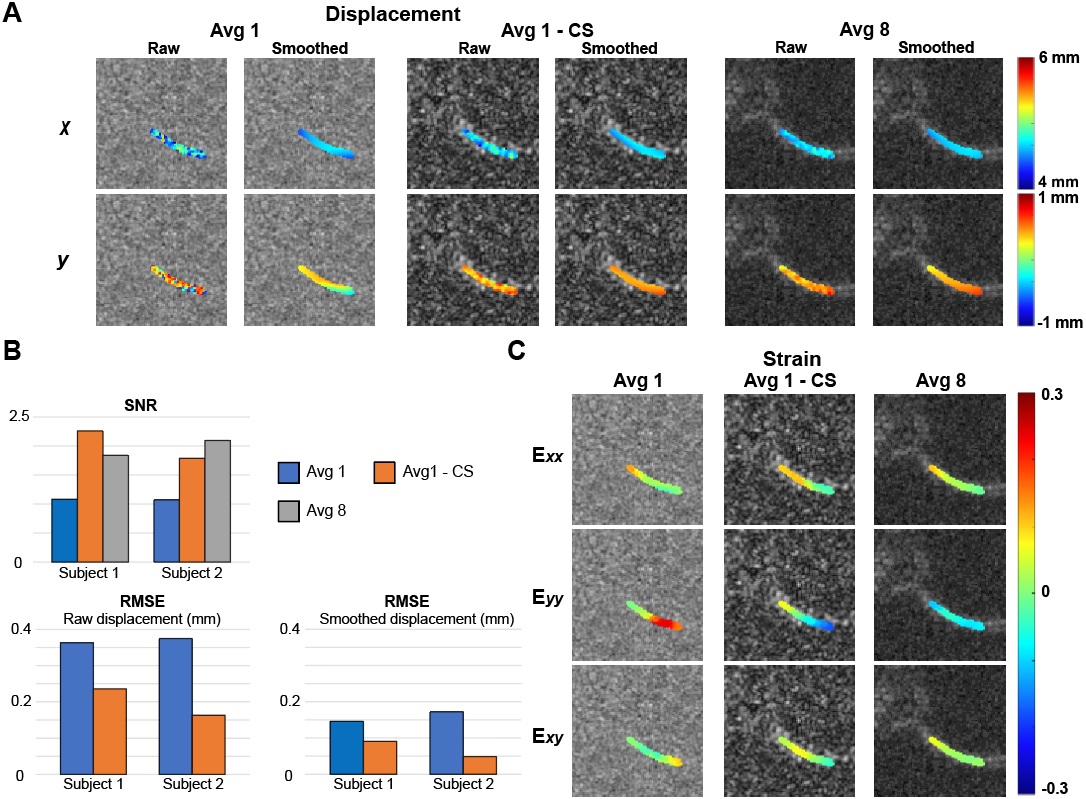
Statistical analysis: The SNR was measured by first selecting the medial condyle and background region in the DENSE MR magnitude image. Subsequently, the mean intensity for both regions was calculated to obtain the ratio. To compare the discrepancy of the raw displacements with respect to the average 8 data, we used root mean square error (RMSE) on selected ROIs.
RESULTS:
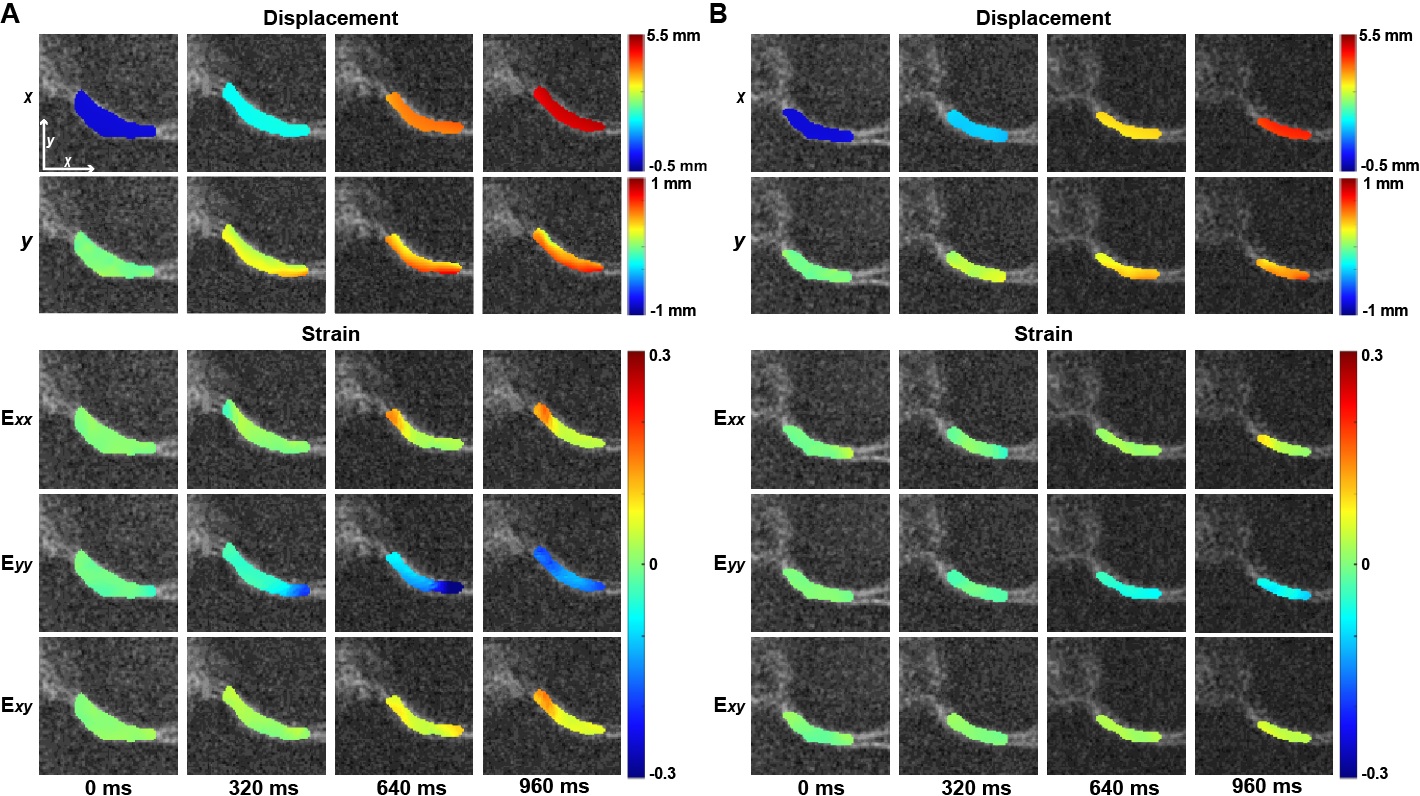
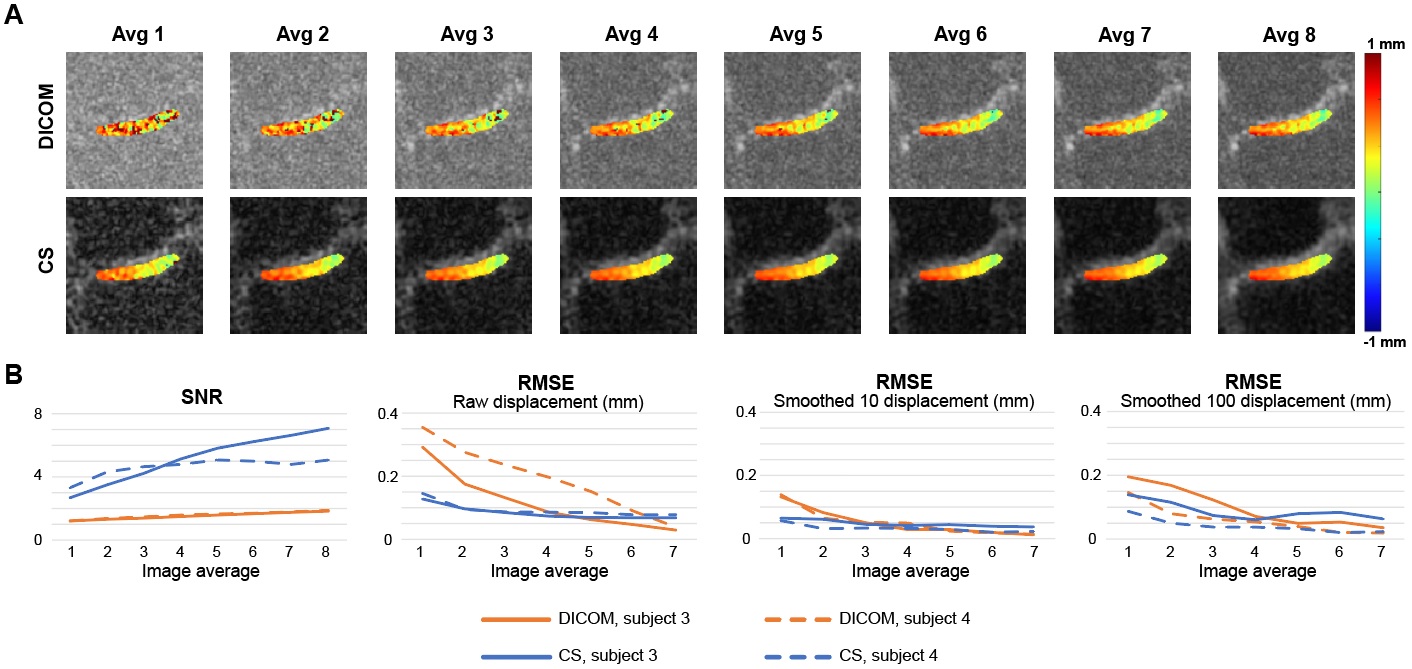
The knee joint translated both in x and y (Fig. 2A) due to varus loading applied at the ankle. Displacements in x were spatially uniform in the medial cartilage while y displacements showed higher values near the tibia compared to the femur. The maximum strain values for subjects approached 0.16 (Exx and Exy) to 0.21 (Eyy), and deformation patterns were consistent across individuals (Fig. 2A, B). Low average images showed substantially lower signal compared to high average images, resulting displacement maps with more noise (Fig. 3A). CS improves the SNR and RMSE while generating a smooth displacement map (Fig. 3B). The average 1 image does not show the compressive strain in Eyy as is shown in the average 8 image, while CS moderately improves this discrepancy (Fig. 3C). To further explore the ability of CS, we ran the analysis on image average 1 through 8 (Fig. 4). The SNR was consistently higher in the CS images while the RMSE becomes equal to the DICOM images above 5-6 averages. RMSE of CS at average 1 was comparable with DICOM average 3, while average 2 (3.4 minutes) was similar with DICOM average 6.DISCUSSION:
In this study, we confirmed our varus loading device applied a compressive load on the medial condyle and spiral DENSE MRI documented dynamic changes through time-course frames in displacements and strain. Also, we showed CS on low averaged k-space data can substantially improve the contrast and reduces the displacement RMSE. Adding more k-space data on the CS input does not improve the RMSE as much as observed in DICOM images as the RMSE significantly decreases with more averages, suggesting that further analysis is needed. Nonetheless, the results of this study indicate spiral DENSE MRI combined with CS can generate high temporal resolution displacement maps in knee cartilage with less than five minutes of imaging time.Acknowledgements
The authors would like to acknowledge funding from NIH R01 AR063712-08.References
1. Chan DD, Cai L, Butz KD, Trippel SB, Nauman EA, Neu CP. In vivo articular cartilage deformation: Noninvasive quantification of intratissue strain during joint contact in the human knee. Sci Rep. 2016;6:1-14.
2. Cai L, Nauman EA, Pedersen CBW, Neu CP. Finite deformation elastography of articular cartilage and biomaterials based on imaging and topology optimization. Sci Rep. 2020;10(1):7980.
3. Zhong X, Meyer CH, Schlesinger DJ, et al. Tracking brain motion during the cardiac cycle using spiral cine-DENSE MRI. Med Phys. 2009;36(8):3413-3419.
4. Neu CP, Hull ML. Toward an MRI-based method to measure non-uniform cartilage deformation: An MRI-cyclic loading apparatus system and steady-state cyclic displacement of articular cartilage under compressive loading. J Biomech Eng. 2003;125(2):180-188.
5. Tamir JI, Ong F, Cheng JY, et al. Generalized magnetic resonance image reconstruction using the Berkeley Advanced Reconstruction Toolbox, in ISMRM Workshop on Data Sampling & Image Reconstruction, Sedona, AZ 2016.
Figures