0110
Free-Breathing Dual-Flip-Angle Multitasking Multi-Echo (MT-ME-dFA) MRI for Whole-Liver, B1+ Insensitive Quantification of T1, PDFF, and R2*1Stanford University, Stanford, CA, United States, 2Cedars-Sinai Medical Center, Los Angeles, CA, United States, 3Siemens Medical Solutions, Los Angeles, CA, United States, 4University of California, Davis, Davis, CA, United States, 5Siemens Medical Solutions, Austin, TX, United States
Synopsis
Quantitative T1, fat fraction, and R2* show promise for characterizing chronic liver diseases. We develop a dual-flip-angle MultiTasking Multi-Echo (MT-ME-dFA) technique to achieve B1+ insensitive, whole-liver joint T1/water-specific T1(T1w), fat fraction(PDFF), and R2* quantification. Respiratory motion is resolved through multidimensional low-rank tensor imaging, and B1+ robustness is achieved by modeling the inversion recovery with two alternating flip angles. Compared to the previously published single-flip-angle MT-ME approach, intra-subject variation on T1/T1w maps was substantially reduced; stronger correlation was achieved for T1/T1w, PDFF and R2* with references on phantom; root-mean-square of intra-subject T1/T1w variation was substantially reduced from 72ms/63ms to 39ms/31ms.
Introduction
Quantitative MRI parameters, such as T1, proton density fat fraction (PDFF), and R2*, play a crucial role in the characterization of chronic liver diseases1,2,3. In our previous work4, a free-breathing Multitasking Multi-Echo (MT-ME) technique was developed to achieve free-breathing whole-liver water-specific T1 (T1w), PDFF, and R2* quantification, providing co-registered quantitative maps without breath-holds. However, the T1 accuracy and precision of MT-ME is sensitive to B1+ inhomogeneity. The intra-subject standard deviation of T1 can be up to 60-70ms, which is considered sufficient to differentiate normal liver from medium- to high-stage fibrosis or steatosis, but not precise enough for finer differentiation of fibrosis stages. Inspired by a recently published dual-flip-angle inversion-recovery (IR) technique which improved the accuracy of T1 estimation over single-flip-angle IR5, we developed a dual-flip-angle MT-ME technique (MT-ME-dFA) to achieve B1+ insensitive T1/T1w mapping, together with simultaneous PDFF and R2* quantification of whole-liver coverage.Methods
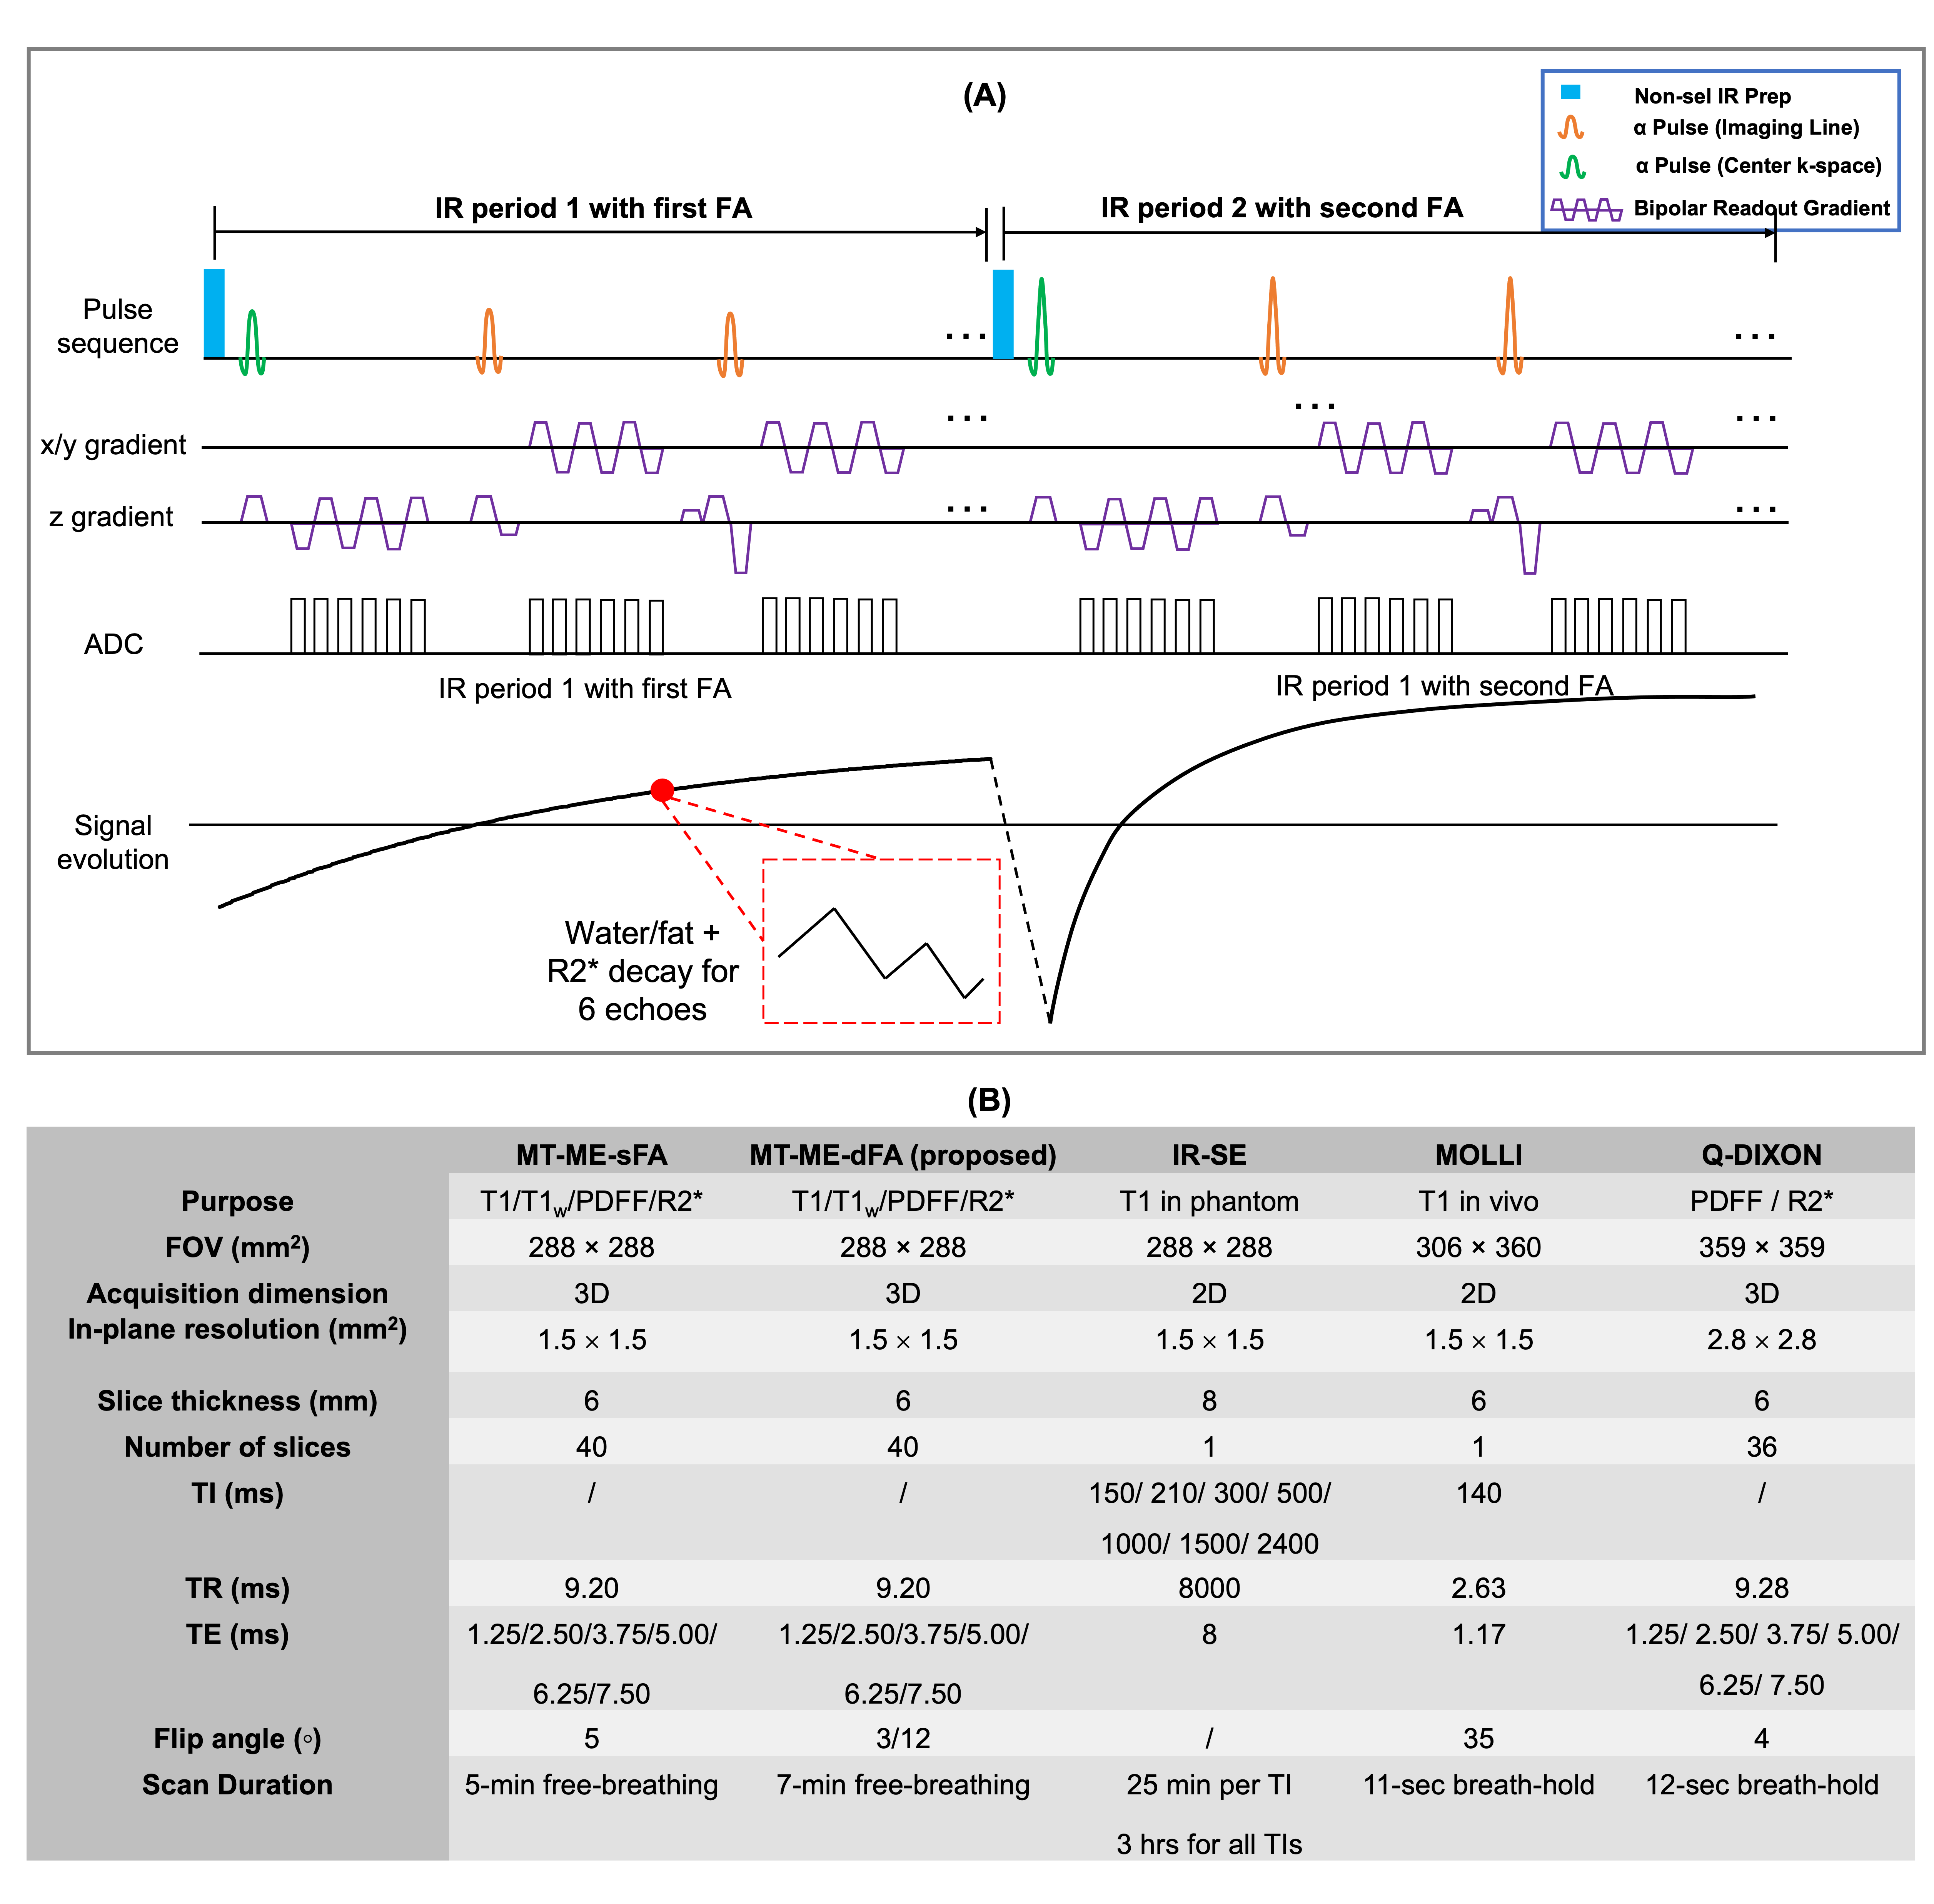
Sequence design (Fig.1A): A 3D sequence with periodic non-selective IR preparation pulses and 6-echo bipolar FLASH readouts was used to generate T1, water/fat, and R2* contrasts. Two different flip angles were interleaved over contiguous IR periods to enable B1+ mapping. The same stack-of-star sampling scheme as described in our previous work4 was implemented.Image reconstruction: For MT-ME-dFA, the underlying image tensor $$$\mathcal{A}$$$ has 4 dimensions indexing spatial locations, T1 recovery with interleaved dual flip angles, multiple echoes, and respiratory phases. $$$\mathcal{A}$$$ is inherently low-rank and thus can be factorized into the weighted outer product of four basis factors, one for each corresponding dimension:6
$$\mathcal{A}=\mathcal{G}\times_{1}\mathbf{U}\times_{2}\mathbf{V}\times_{3}\mathbf{W}\times_{4}\mathbf{Q}, (1)$$
with core tensor $$$\mathcal{G}$$$ and basis factors $$$\mathbf{U}$$$, $$$\mathbf{V}$$$, $$$\mathbf{W}$$$, and $$$\mathbf{Q}$$$ for each of the four dimensions respectively.
$$$\mathbf{V}$$$ is pre-determined from a dictionary containing a range of realistic T1 values, inversion efficiency, and excitation B1+ efficiency using following equation5:
$$s_{k}[n]=A\frac{1-e^{-T_{\mathrm{R}}/T1}}{1-e^{-T_{\mathrm{R}}/T1}\cos\left(\beta\alpha_{k}\right)}\left[1-\left(1-\prod{Q_{k}}\right)\left(e^{-T_{\mathrm{R}}/T1}\cos\left(\beta\alpha_{k}\right)\right)^{n}\right]\sin\left(\beta \alpha_{k}\right), (2)$$
where $$$s_{k}[n]$$$ is the FLASH signal intensity at the $$$n$$$th inversion time in the $$$k$$$th IR period, $$$\alpha_{k}$$$ is the FA of the $$$k$$$th IR period ($$$\alpha_{k}$$$ alternates between two pre-defined flip angles), $$$Q_{k}$$$ absorbs the effects of inverting the magnetization from the steady state of the previous recovery period and can be expressed as $$$Q_{k}=[1-e^{-T_{\mathrm{R}}/T1}\cos\left(\beta\alpha_{k}\right)]/[1-e^{-T_{\mathrm{R}}/T1}\cos\left(\beta\alpha_{k-1}\right)]$$$, and $$$\beta$$$ is the B1+ efficiency. The recovery of other bases has been described in our previous work4.
Parametric quantification: The joint T1 (i.e., combined apparent T1 of water and fat) and water-only T1w were estimated by fitting the signal evolution curves from the first-echo MT-ME-dFA images or water-only images at different inversion times into Equation 2, respectively. Besides T1 values, the B1+ efficiency $$$\beta$$$ was fitted simultaneously. The PDFF and R2* were quantified subsequently following the flow chart described in ref.[4] using an in-house algorithm.
Imaging experiments: All studies were performed on a 3T Siemens Vida scanner. An in-house phantom was used with T1 values within the range of liver T1. 2D IR-spin-echo (IR-SE) was acquired as an ex-vivo T1 mapping reference. The original MT-ME with single flip angle (MT-ME-sFA) and the proposed MT-ME-dFA were both performed on the phantom. An external B1 map was also acquired as the reference for B1+ efficiency7.
The in vivo studies were approved by the local IRB and written informed consent was obtained for all participants. Nine healthy volunteers and three patients with histologically confirmed nonalcoholic fatty liver disease (NAFLD) were recruited. The external B1+ map, MOLLI8, and q-DIXON9 with breath-hold were acquired as in vivo references for B1+ efficiency, T1, and PDFF and R2*, respectively. Free-breathing MT-ME-sFA and MT-ME-dFA acquisitions with whole-liver coverage were performed on all subjects. The detailed imaging parameters are listed in Fig.1B.
Statistical analysis: The joint T1, T1w, PDFF, and R2* from MT-ME-sFA and MT-ME-dFA were assessed for phantom and in vivo studies. The Pearson correlation coefficient $$$R$$$ and intra-class coefficient (ICC) were evaluated between the MT-ME estimation and the reference. The intra-subject standard deviation of T1 values among the 8 liver segments according to Couinaud criteria was evaluated for all subjects.
Results
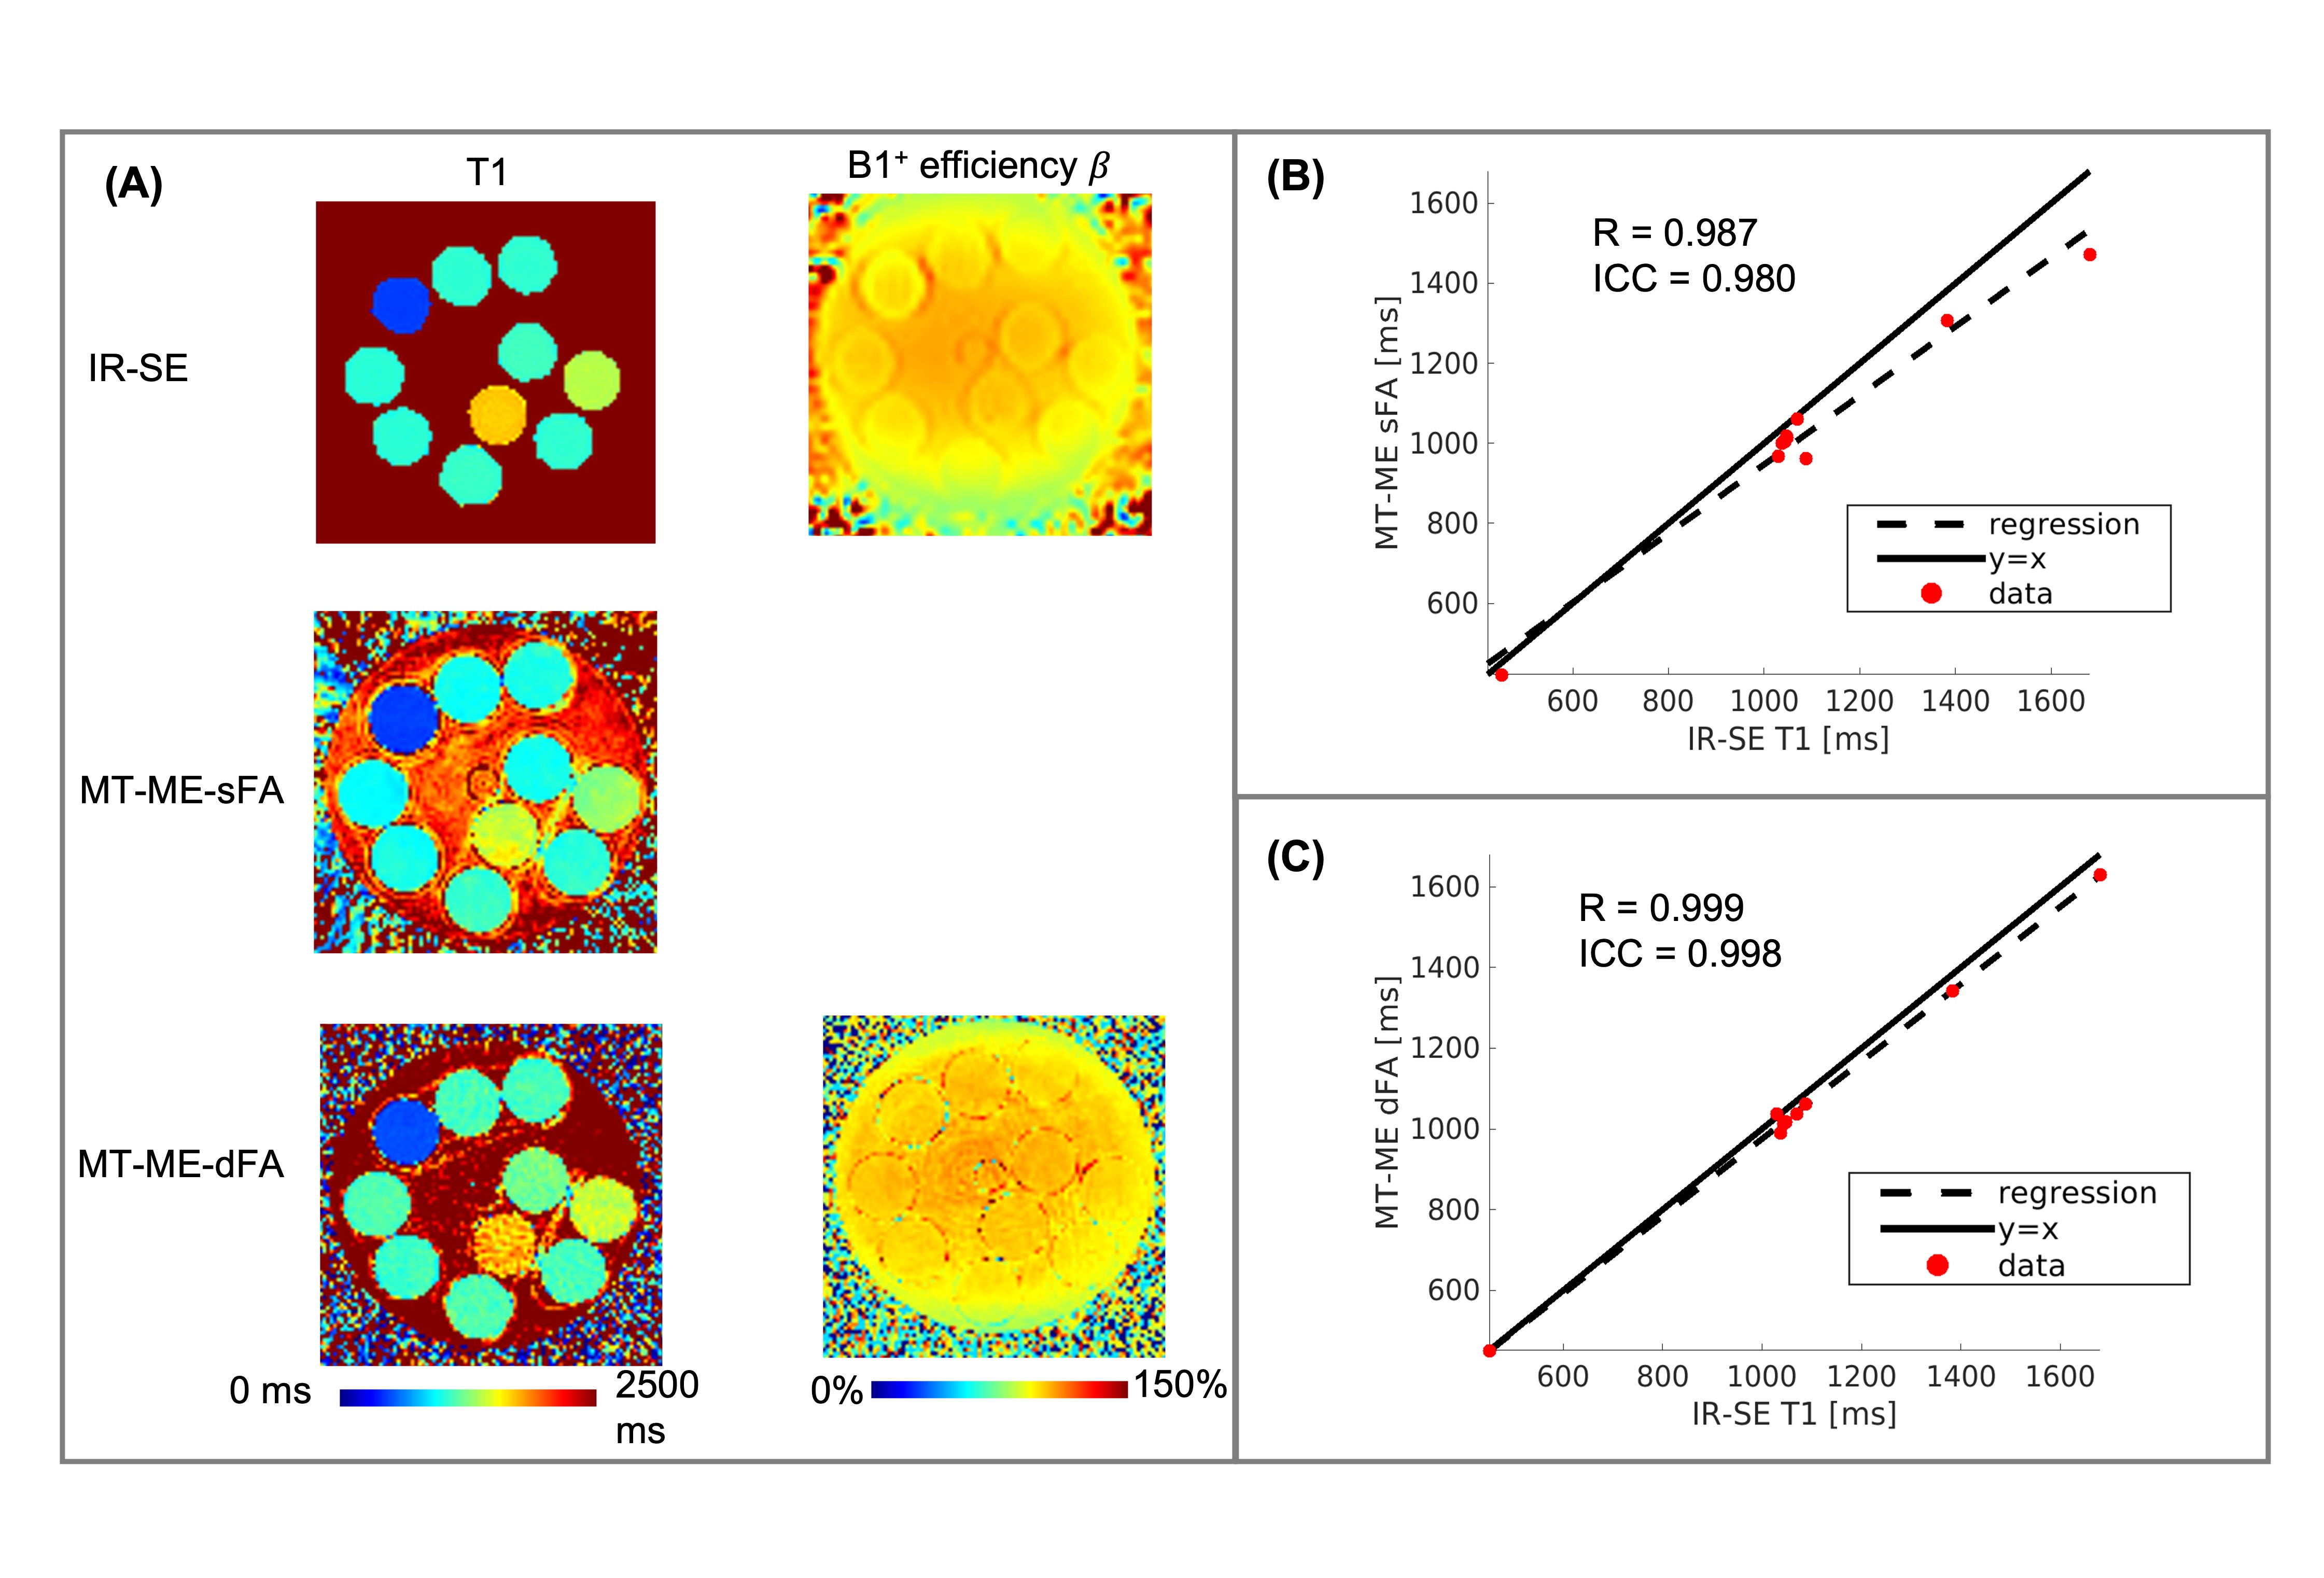
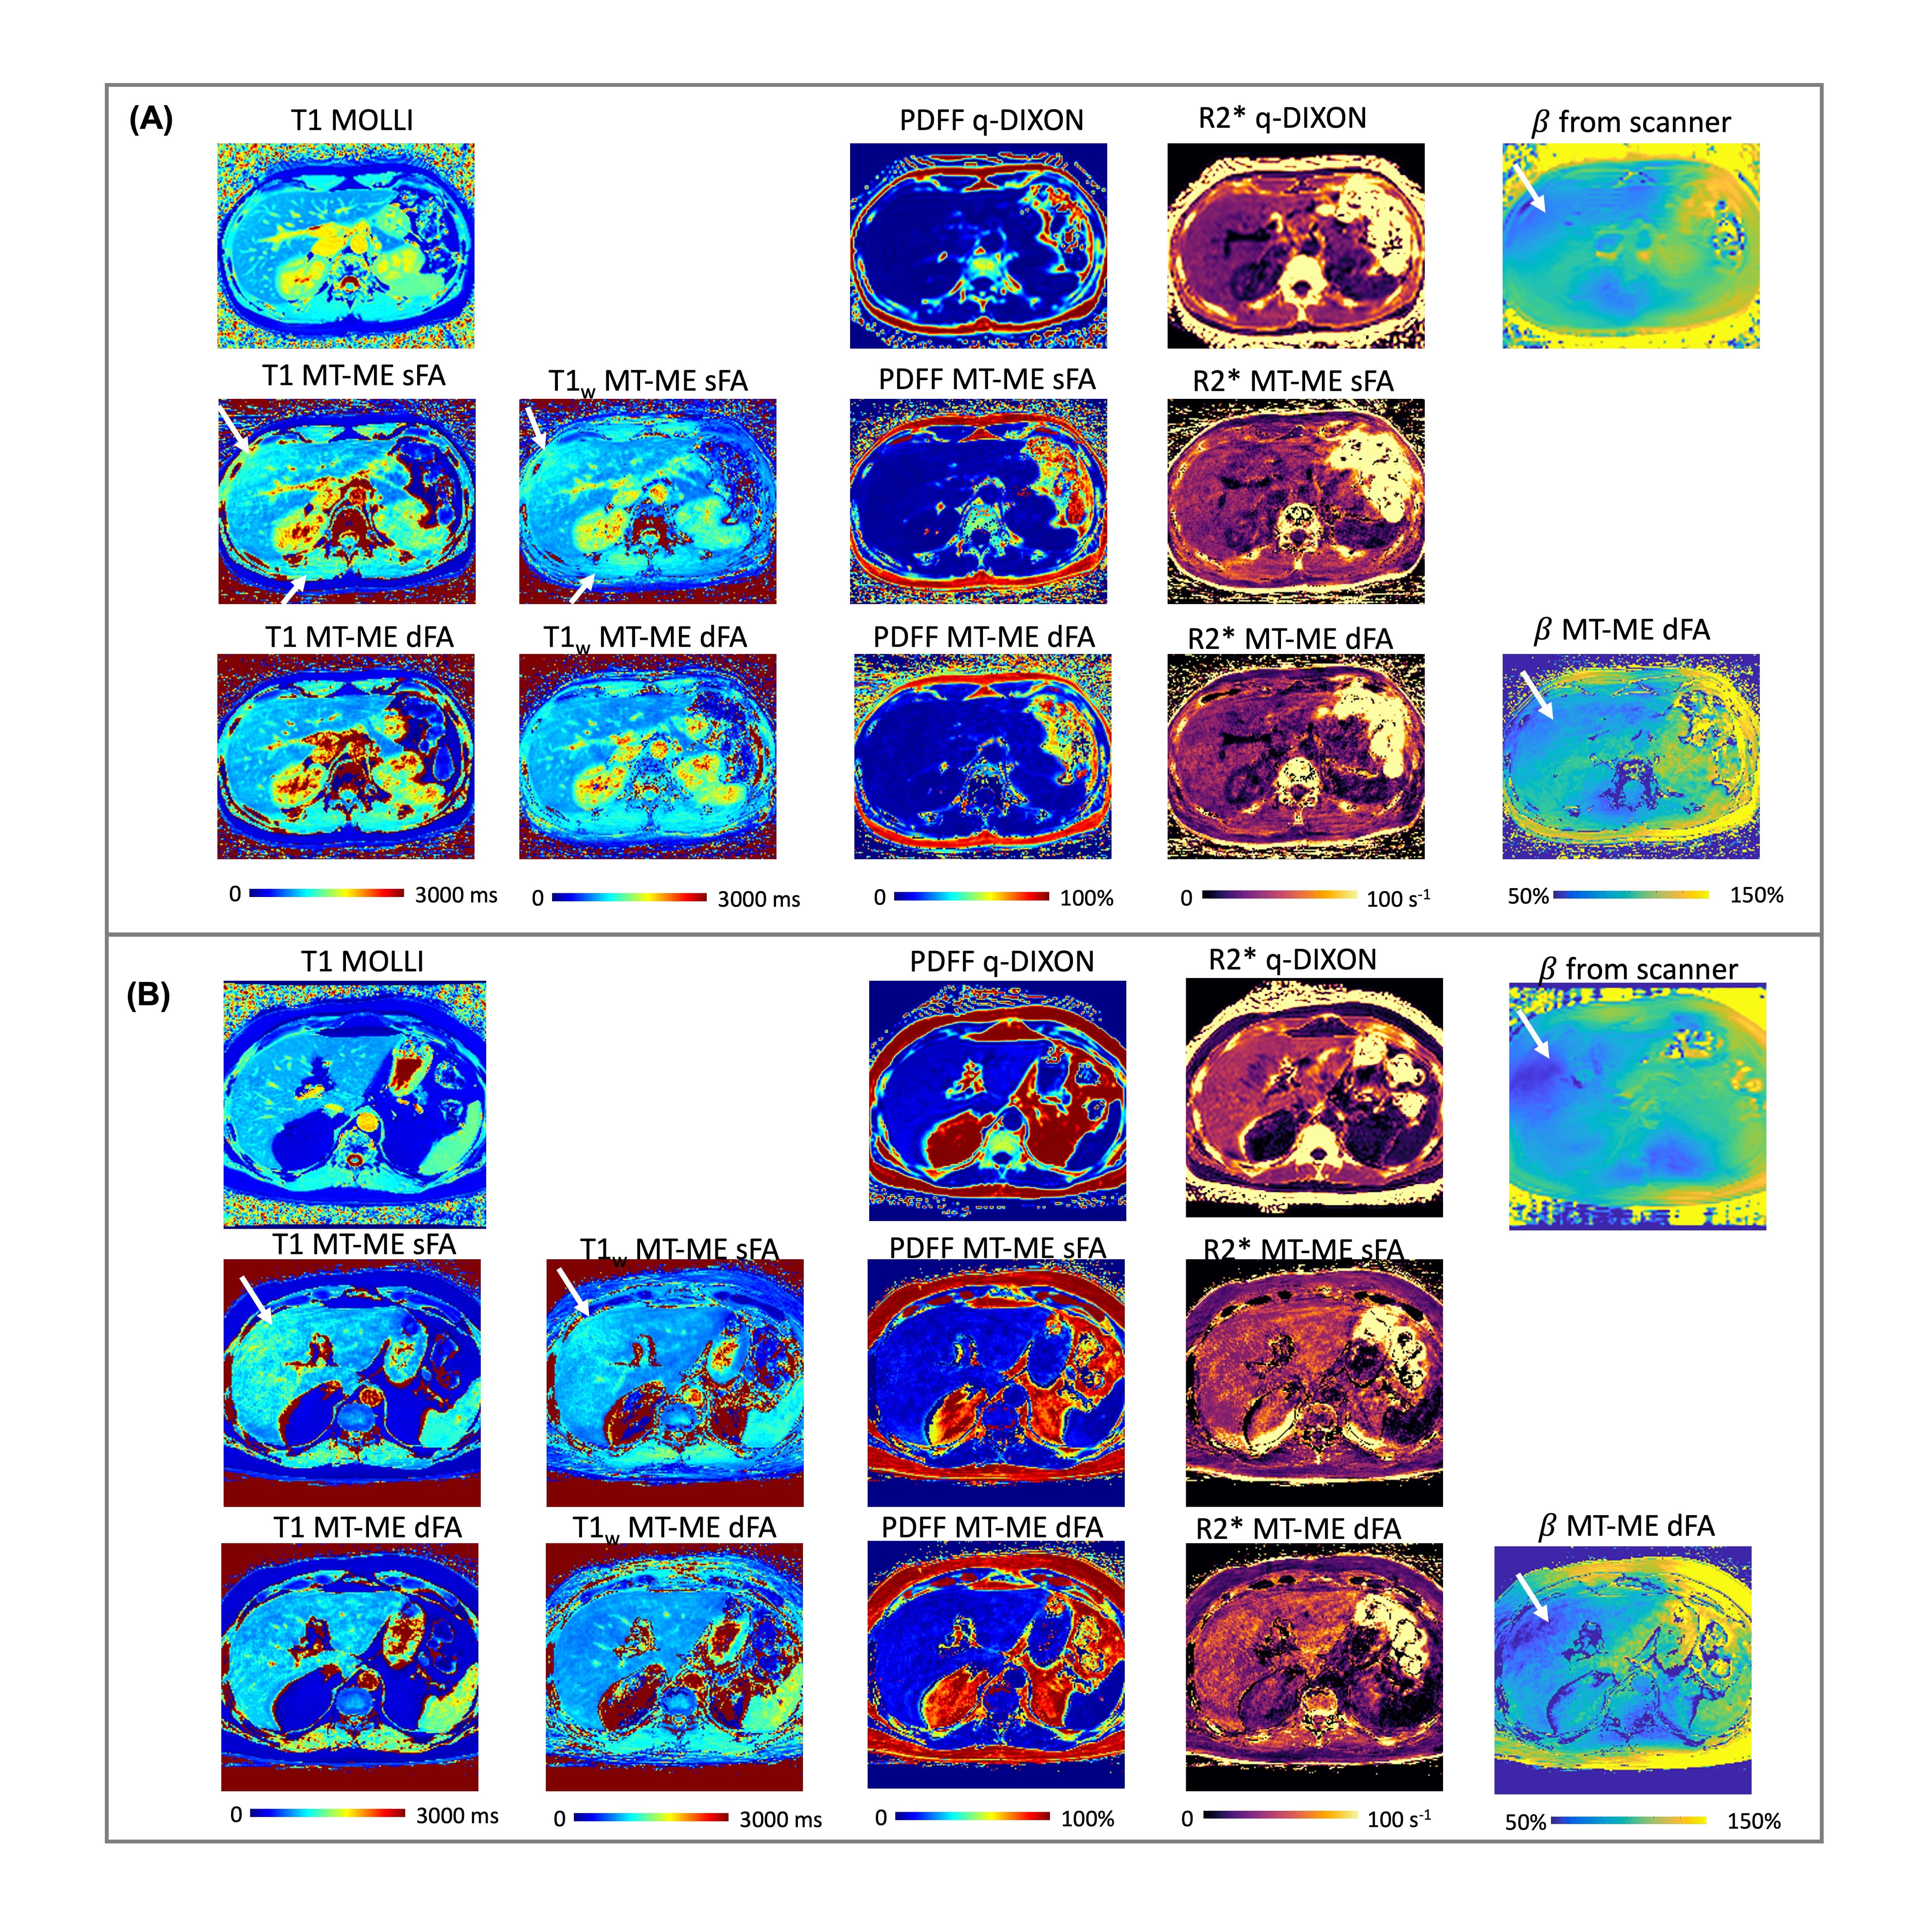
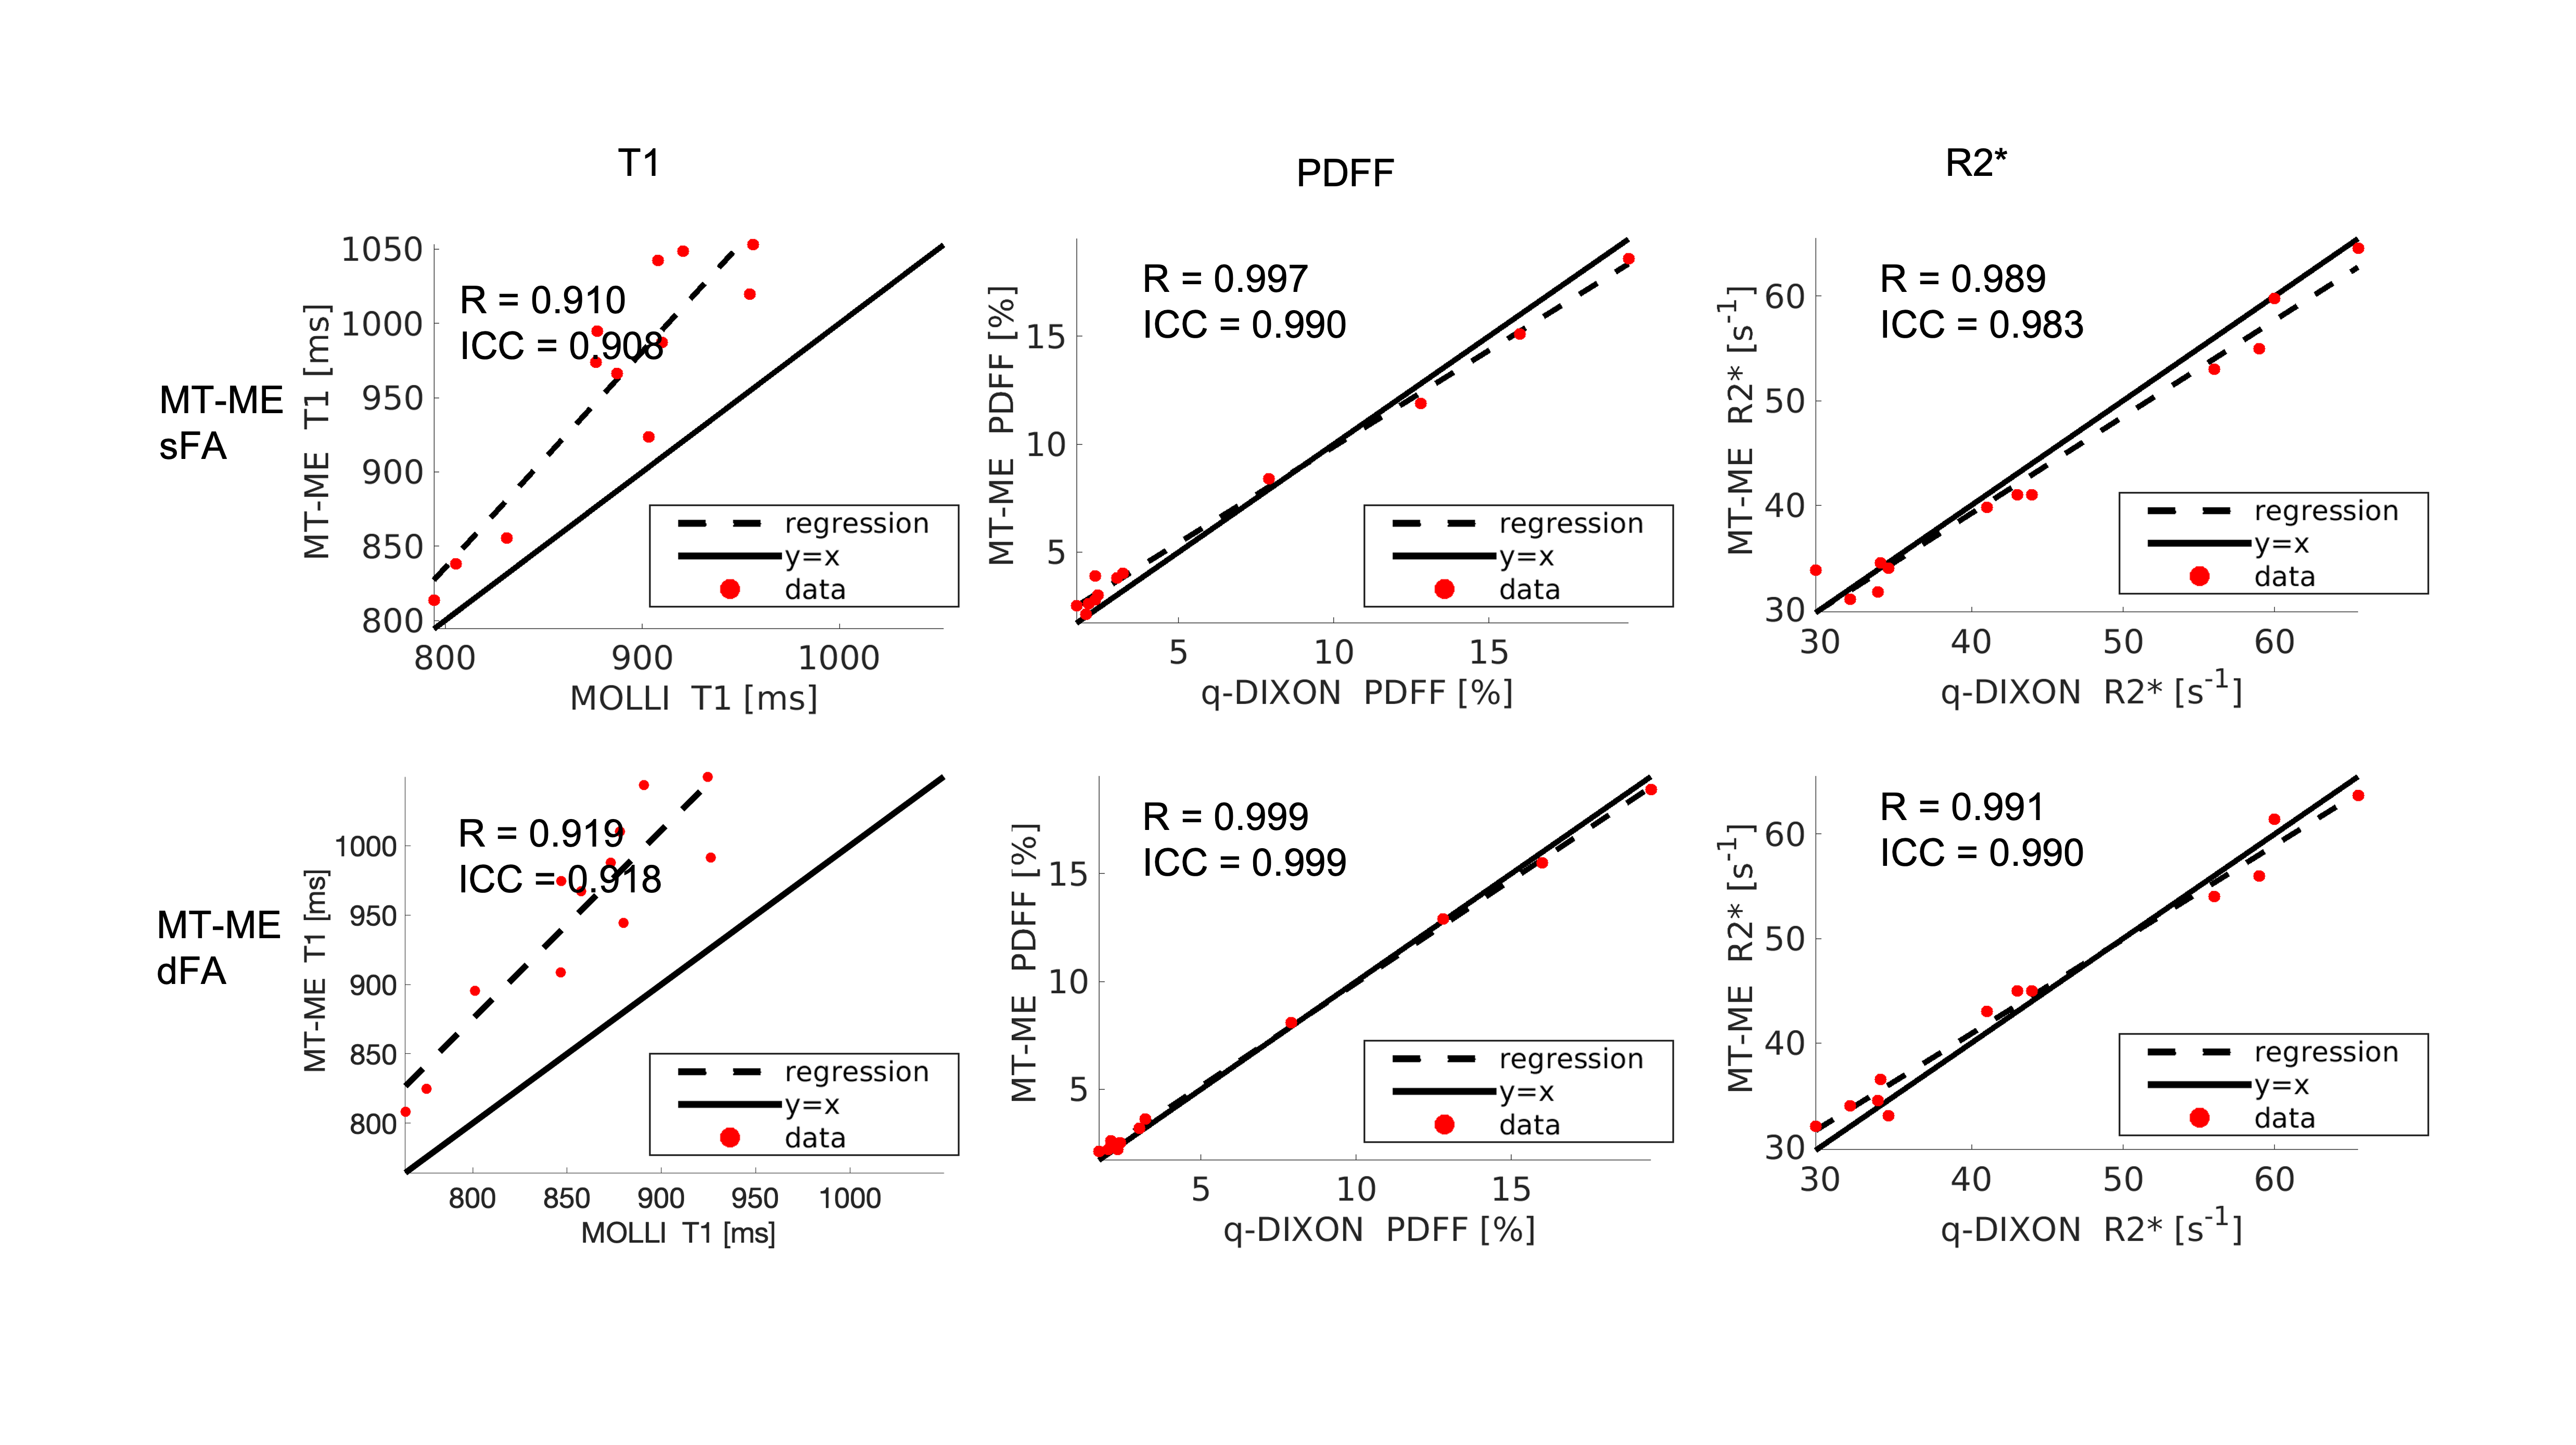
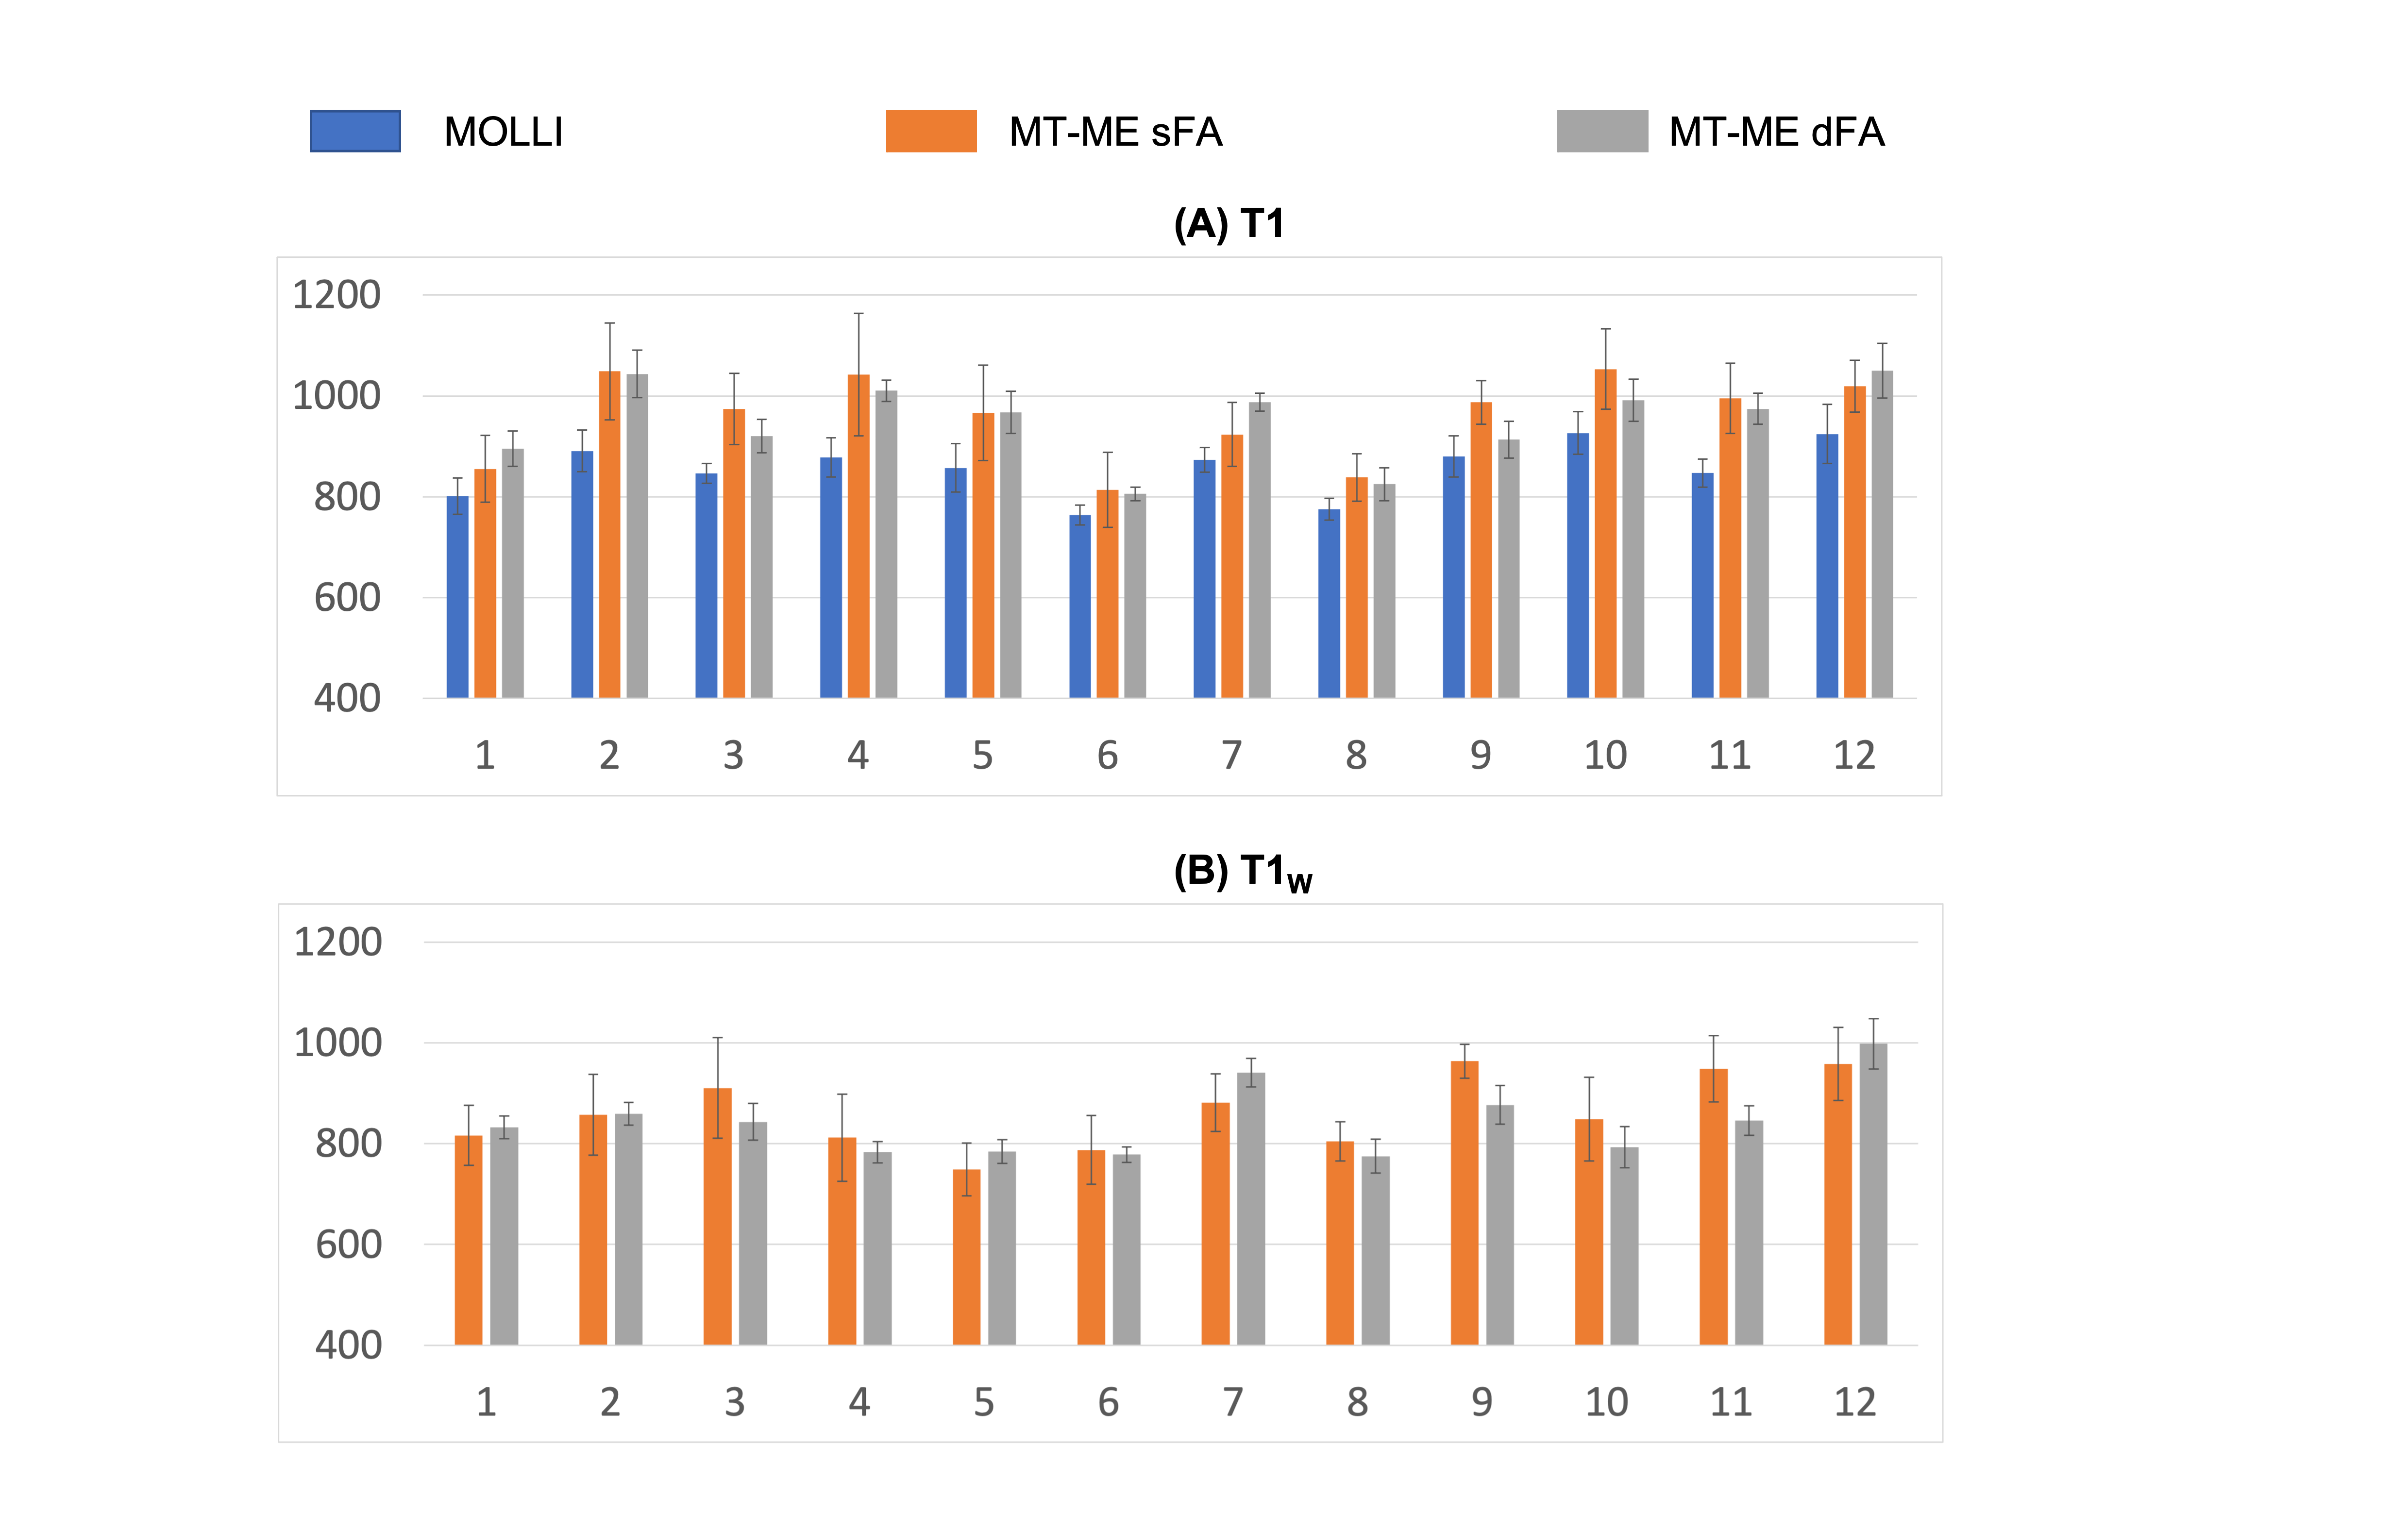
The phantom T1 measured from MT-ME-dFA shows improved agreement with the IR-SE reference with Pearson correlation coefficient R=0.999, while the $$$R$$$ between MT-ME-sFA and IR-SE is 0.987 (Fig.2). In vivo examples are demonstrated in Fig.3 for a healthy volunteer (3A) and a NAFLD patient (3B). The T1 and T1w maps from MT-ME-sFA show larger intra-subject variation (indicated by white arrows) than those from MT-ME-dFA. Fig.4 displays the agreement of the averaged values within each subject for each parameter between MT-ME-sFA/dFA and the references. The $$$R$$$ of T1, PDFF, and R2* between MT-ME-sFA vs references are 0.910, 0.997, 0.989; between MT-ME-dFA vs references are 0.919, 0.999, 0.991. In terms of the intra-subject standard deviation of T1 values over different liver segments, the measurements from MT-ME-sFA are larger than from MT-ME-dFA (Fig.5). The root-mean-square of intra-subject variation for T1 and T1w for MT-ME-sFA are 72ms and 63ms, while for MT-ME-dFA are 39ms and 31ms. MT-ME-dFA substantially reduced the intra-subject T1/T1w variation.Discussion and Conclusion
This work demonstrated that MT-ME-dFA is feasible to achieve B1+ insensitive quantification of T1 and T1w, PDFF, and R2* with free-breathing acquisition and whole-liver coverage, and improves precision across the liver in comparison to MT-ME-sFA. This method can be potentially used for clinical characterization of chronic liver diseases.Acknowledgements
No acknowledgement found.References
1. Hernando D, Levin YS, Sirlin CB, Reeder SB. Quantification of liver iron with MRI: state of the art and remaining challenges. J Magn Reson Imaging. Nov 2014;40(5):1003-21.
2. Reeder SB, Hu HH, Sirlin CB. Proton density fat-fraction: a standardized MR-based biomarker of tissue fat concentration. J Magn Reson Imaging. Nov 2012;36(5):1011-4.
3. Banerjee R, Pavlides M, Tunnicliffe EM, et al. Multiparametric magnetic resonance for the non-invasive diagnosis of liver disease. J Hepatol. Jan 2014;60(1):69-77.
4. Wang, N., Cao, T., Han, F., Xie, Y., Zhong, X., Ma, S, Li, D, et al. Free‐breathing multitasking multi‐echo MRI for whole‐liver water‐specific T1, proton density fat fraction, and quantification. Magn Reson Med 2021.
5. Serry, F. M., Ma, S., Mao, X., Han, F., Xie, Y., Han, H., Christodoulou, A. G. et al. Dual flip‐angle IR‐FLASH with spin history mapping for B1+ corrected T1 mapping: Application to T1 cardiovascular magnetic resonance multitasking. Magn Reson Med 2021.
6. Christodoulou AG, Shaw JL, Nguyen C, et al. Magnetic resonance multitasking for motion-resolved quantitative cardiovascular imaging. Nature Biomedical Engineering. 2018;2(4):215.
7. Chung S, Kim D, Breton E, Axel L. Rapid B1+ mapping using a preconditioning RF pulse with TurboFLASH readout. Magn Reson Med. 2010;64:439- 446
8. Messroghli DR, Radjenovic A, Kozerke S, Higgins DM, Sivananthan MU, Ridgway JP. Modified Look‐Locker inversion recovery (MOLLI) for high‐resolution T1 mapping of the heart. Magn Reson Med 2004;52(1):141-146.
9. Zhong X, Nickel MD, Kannengiesser SA, Dale BM, Kiefer B, Bashir MR. Liver fat quantification using a multi-step adaptive fitting approach with multi-echo GRE imaging. Magn Reson Med. Nov 2014;72(5):1353-65.
Figures