0109
Accuracy, Repeatability, and Reproducibility of Regularized Inversions for Abdominal Quantitative Susceptibility Mapping
Julia Velikina1, Ruiyang Zhao1,2, Collin J Buelo1,2, Alexey A Samsonov1, Scott B Reeder1,2,3,4, and Diego Hernando1,2
1Radiology, University of Wisconsin-Madison, Madison, WI, United States, 2Medical Physics, University of Wisconsin-Madison, Madison, WI, United States, 3Medicine, University of Wisconsin-Madison, Madison, WI, United States, 4Emergency Medicine, University of Wisconsin-Madison, Madison, WI, United States
1Radiology, University of Wisconsin-Madison, Madison, WI, United States, 2Medical Physics, University of Wisconsin-Madison, Madison, WI, United States, 3Medicine, University of Wisconsin-Madison, Madison, WI, United States, 4Emergency Medicine, University of Wisconsin-Madison, Madison, WI, United States
Synopsis
Quantitative susceptibility mapping (QSM) is a promising non-invasive technique for assessment of liver iron concentration (LIC), necessary in a number of diseases. QSM solves an ill-conditioned inverse problem, whose performance depends on the chosen regularization. This work is the first to evaluate the accuracy, repeatability, and reproducibility of liver QSM for two regularized inversion methods in a large patient population with a wide range of LIC. Our results indicate that data-adaptive regularization shows higher correlation with reference LIC values and increases repeatability/reproducibility due to its reduced sensitivity to the field map errors and regularizing effect of anatomical priors.
Introduction
Excessive iron accumulation in the liver can lead to liver disease and eventual liver cirrhosis, hepatocellular carcinoma, diabetes mellitus or other endocrine disorders. Quantification of liver iron concentration (LIC) is needed for management of liver iron overload1. Liver biopsy is the most direct method of evaluating LIC; however, biopsy is an invasive procedure that carries risks, has limited reproducibility, and is not appropriate for long-term observations.Quantitative susceptibility mapping (QSM) has emerged as a promising non-invasive technique for assessment of LIC2-4. QSM may be preferable over relaxation-based MRI techniques due to the complex relationship of relaxometry with iron deposition. In contrast, magnetic susceptibility is a fundamental property of all materials, with iron being the only non-trace element that can detectably alter liver susceptibility. However, abdominal QSM faces challenges of complex anatomy, presence of fat, physiological motion, and rapid signal decay in iron overload. Since QSM involves solving an ill-conditioned inverse problem, its performance depends on the chosen regularization approach. This work is the first to evaluate the accuracy, repeatability, and reproducibility of liver QSM implemented with two regularized inversion methods in a large patient population with a wide range of LIC.
Theory
QSM requires the inversion of the forward problem relating tissue susceptibility to the$$$\,B_0\,$$$field map. The inversion is an ill-posed problem, whose solution may be regularized in different ways. Generally, the local susceptibility distribution$$$\,\chi\,$$$is estimated from the measured field map$$$\,\psi\,$$$by solving$$\chi=\arg\min_\chi\left(||WL(\psi-D\star\chi)||_2^2+\sum_{k=1}^K\lambda_k||P_k\chi||\right),$$with dipole kernel$$$\,D,\,$$$background field removal operator$$$\,L,\,$$$weighting matrix$$$\,W,\,$$$and regularization by one or more operators$$$\,P_k\,$$$with parameters$$$\,\lambda_k$$$. Here, we implement QSM using two recently proposed$$$\,\ell_2$$$-norm-based approaches to the choice of$$$\,W\,$$$and$$$\,P_k$$$.- In the method of Sharma et al.4,$$$\,W\,$$$is a sum-of-squares of image intensities across all echoes as a measure of$$$\,$$$SNR$$$\,$$$in the field map. It features a single image-gradient-based regularizing operator$$$\,P$$$. As all regularization is based on source images only, we refer to this method as spatially-constrained.
- In a more recent method5,$$$\,W\,$$$is modulated by the residual of the water/fat signal model fit6 to account for field map estimation uncertainties. In addition to the image-gradient-based operator, it also incorporates a regularization term based on the spatial distribution$$$\,M_{fat}\,$$$of adipose tissue (AT) learned from the proton density fat fraction$$$\,$$$(PDFF)$$$\,$$$map (this choice guided by the assumption that AT does not accumulate iron3). As this method incorporates different sources of information available from chemical shift-encoded (CSE) imaging in addition to spatial regularization, we call it data-adaptive.
Methods
Data Acquisition and ProcessingWith IRB approval$$$\,$$$and$$$\,$$$informed written consent, human subjects$$$\,(n=50)\,$$$with known/suspected iron overload were scanned at 3.0T (MR750 or Premier, GE Healthcare) using multi-echo 3D$$$\,$$$SGRE sequence (20$$$\,$$$s breath-hold, axial orientation, FOV$$$\,=\,$$$400$$$\,$$$x$$$\,$$$320$$$\,$$$mm2, 28$$$\,$$$slices, voxel size $$$\,=\,$$$1.56$$$\,$$$x$$$\,$$$2.22$$$\,$$$x$$$\,$$$8$$$\,$$$mm3, TR$$$\,=\,$$$8.0$$$\,$$$ms, FA$$$\,=\,$$$3°, six echoes TEinit/ΔTE$$$\,=\,$$$1.2/1.0$$$\,$$$ms). To evaluate repeatability, the MRI table was removed from the scanner, the coil array removed, the subject was asked to sit up/lie back down, the coil replaced, the table returned into the scanner, and the same acquisition was repeated$$$\,(n=35).\,$$$To evaluate reproducibility, an additional CSE acquisition was performed with lower spatial resolution and shorter TEs (19$$$\,$$$s breath-hold, axial orientation, FOV$$$\,=\,$$$400$$$\,$$$x$$$\,$$$320$$$\,$$$mm2, 28$$$\,$$$slices, voxel size$$$\,$$$=$$$\,$$$ 2.78$$$\,$$$x$$$\,$$$2.5$$$\,$$$x$$$\,$$$8$$$\,$$$mm3, TR$$$\,=\,$$$6.0$$$\,$$$ms, FA$$$\,=\,$$$9°, eight echoes TEinit/ΔTE$$$\,=\,$$$0.65/0.58$$$\,$$$ms). Additionally, each subject underwent an FDA-approved single spin-echo R2-based relaxometry7 (Ferriscan, Resonance Health, Australia) at$$$\,$$$1.5T$$$\,$$$to provide a reference measure of$$$\,$$$LIC.
The collected data were processed with$$$\,$$$CSE$$$\,$$$water/fat separation technique8 to estimate $$$B_0,\,$$$PDFF,$$$\,$$$and$$$\,R_2^*$$$ used as an input to$$$\,$$$QSM$$$\,$$$performed with the two methods described above. In the data-adaptive method,$$$\,M_{fat}\,$$$comprised pixels with$$$\,$$$PDFF$$$\,$$$>$$$\,$$$0.9$$$\,$$$and$$$\,R_2^*<300\,$$$s-1.
Measurements and Analysis
Susceptibility values in the liver were quantified as the difference between average values in ROIs in the right liver lobe and adjacent subcutaneous AT. Linear regression analysis was performed to determine the correlations between liver susceptibility and Ferriscan-based measures of LIC. Test-retest repeatability and reproducibility between the two scanning protocols were assessed using linear regression, Bland-Altman analysis9, and repeatability/reproducibility coefficients defined as RC$$$\,=\,1.96\sqrt{2\sigma^2},\,$$$where$$$\,\sigma\,$$$is within-subject standard deviation10.
Results
Analysis of the relationship between susceptibility values in the liver and Ferriscan LIC demonstrates$$$\,$$$(Fig.$$$\,$$$1)$$$\,$$$higher correlation and tighter$$$\,$$$95%$$$\,$$$confidence intervals of the regression coefficients for the data-adaptive method than the spatially-constrained. This improvement may be explained by the fact that inclusion of zero-reference tissue and adaptive weighting lead to lower sensitivity to field map errors and reduced shading artifact$$$\,$$$(Fig.$$$\,$$$2). The improved robustness of the data-adaptive method is highlighted by its higher repeatability (RCDA$$$\,=\,$$$0.14$$$\,$$$vs.$$$\,$$$RCSC$$$\,=\,$$$0.27$$$,\,$$$Fig.$$$\,$$$3) as determined by$$$\,$$$95%$$$\,$$$limits of agreement$$$\,$$$(LOA). Finally, the data-adaptive method also shows higher reproducibility (RCDA$$$\,=\,$$$0.29$$$\,$$$vs.$$$\,$$$RCSC$$$\,=\,$$$0.36) of the susceptibility values obtained from imaging with different protocols$$$\,$$$(Fig.$$$\,$$$4).Discussion and Conclusions
Advanced regularization was demonstrated to be necessary in the challenging problem of abdominal$$$\,$$$QSM. This work represents the next step towards establishing regularized abdominal$$$\,$$$QSM$$$\,$$$as an accurate, repeatable and reproducible technique for assessment of$$$\,$$$LIC$$$\,$$$in clinical settings. Our results indicate that data-adaptive regularization incorporating data quality metrics and anatomical priors is a preferred approach for abdominal QSM as it$$$\,$$$(1)$$$\,$$$shows higher correlation with reference$$$\,$$$LIC$$$\,$$$values;$$$\,$$$(2)$$$\,$$$features an increase in repeatability/reproducibility. These improvements may be explained by the reduced sensitivity of the data-adaptive method to the field map errors that may be caused by respiratory/physiological motion, water/fat swaps, and noise propagation due to rapid signal decay, especially in high$$$\,$$$LIC$$$\,$$$cases. Moreover, the regularizing effect of anatomical priors$$$\,$$$(known spatial distribution of$$$\,$$$AT)$$$\,$$$improves conditioning and facilitates reduction of the shading artifact, and eliminates the need for a separate zero-reference. Further studies are needed to evaluate QSM methods for different vendors and field strengths.Acknowledgements
The authors wish to acknowledge support from the NIH (R01 DK117354, R01 DK100651, R01 DK088925, R01EB027087). Also, GE Healthcare provides research support to the University of Wisconsin.References
- Brittenham GM, Badman DG. Noninvasive measurement of iron: report of an NIDDK workshop, Blood, 2003;101(1):15-19.
- Chu Z, Cohen AR, Muthupillai R, Chung T, Wang ZJ. MRI measurement of hepatic magnetic susceptibility—phantom validation and normal subject studies. Magn Reson Med. 2004;52:1318–1327.
- Hernando D, Cook RJ, Diamond C, Reeder SB. Magnetic susceptibility as a B0 field strength independent MRI biomarker of liver iron overload. Magn Reson Med. 2013;70:648–656.
- Sharma SD, Hernando D, Horng DE, Reeder SB. Quantitative susceptibility mapping in the abdomen as an imaging biomarker of hepatic iron overload. Magn Reson Med. 2015;74(3):673-83.
- Velikina JV, Zhao R, Buelo CJ, Samsonov AA, Reeder SB, Hernando D. Improved Regularization for QSM of Liver Iron Overload. In Proc. of ISMRM. 2021:3995.
- Reeder SB, Wen Z, Yu H, Pineda AR, Gold GE, Markl M, Pelc NJ. Multicoil Dixon chemical species separation with an iterative least-squares estimation method. Magn Reson Med. 2004;51(1):35-45.
- St Pierre TG, Clark PR, Chua-Anusorn W. Single spin-echo proton transverse relaxometry of iron-loaded liver. NMR Biomed. 2004;17:446–458.
- Hernando D, Kellman P, Haldar JP, Liang ZP. Robust water/fat separation in the presence of large field inhomogeneities using a graph cut algorithm. Magn Reson Med. 2010;63(1):79-90.
- Bland JM, Altman DG. Measuring agreement in method comparison studies. Stat Methods Med Res 1999;8:135–160.
- Vaz S, Falkmer T, Passmore AE, Parsons R, Andreou P. The case for using the repeatability coefficient when calculating test-retest reliability. PLoS One. 2013;8(9):e73990.
Figures
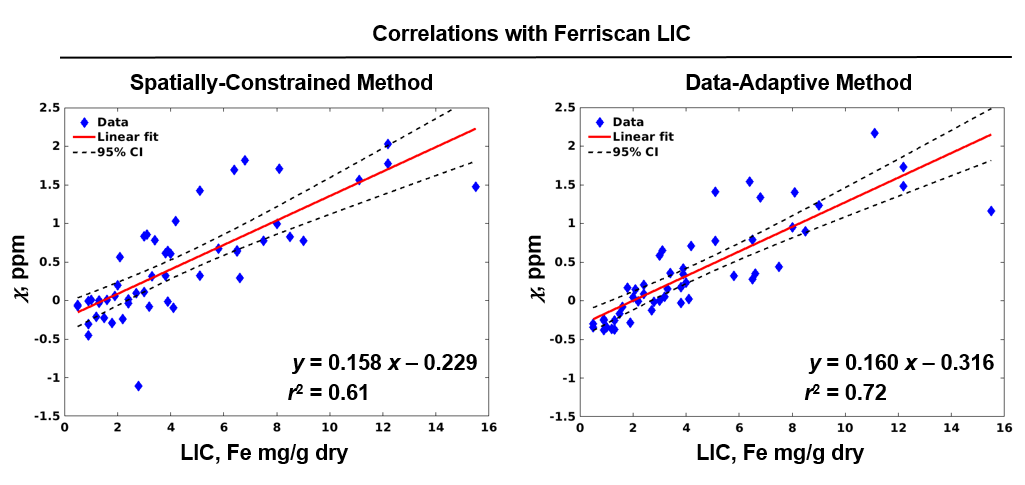
Figure 1. Results
of the linear regression analysis. Data-adaptive method provides improved
correlation (r2 = 0.72) of the liver susceptibility values with Ferriscan LIC compared to the spatially-constrained method (r2 = 0.61).
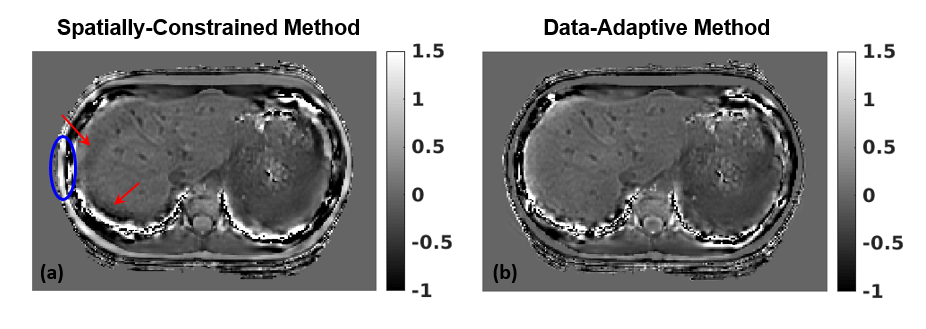
Figure 2.
Comparison of susceptibility maps obtained with the spatially-constrained (a) and the data-adaptive (b) methods. Shading artifact in the
liver (red arrows) and highly non-uniform values in subcutaneous AT (blue oval)
in (a) that lead to unreliable liver susceptibility measurements are resolved
in (b).
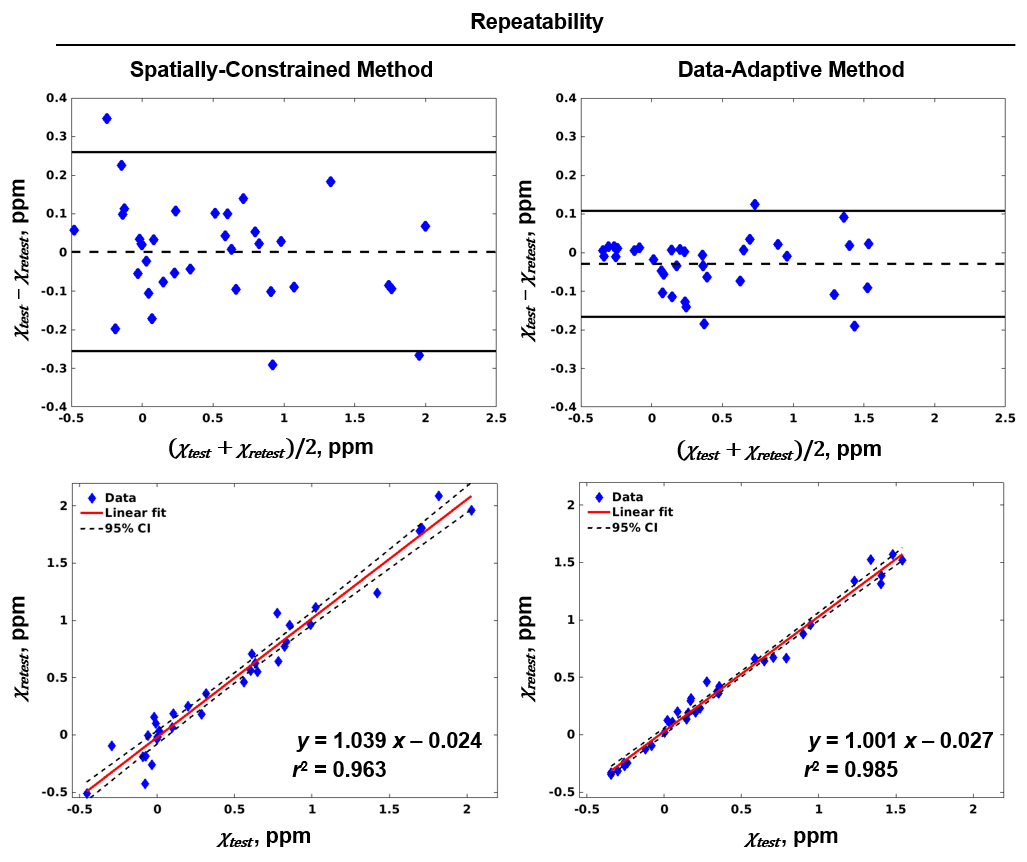
Figure 3.
Bland-Altman plots (top row) indicate higher repeatability of the data-adaptive
method (LOA 0.111/-0.167) than the spatially constrained one (LOA 0.265/-0.257).
The repeatability is further quantified by the linear regression analysis
(bottom row), with the data-adaptive method both showing tighter 95% confidence
intervals (dashed lines) and having a slope closer to unity compared to the spatially
constrained method.
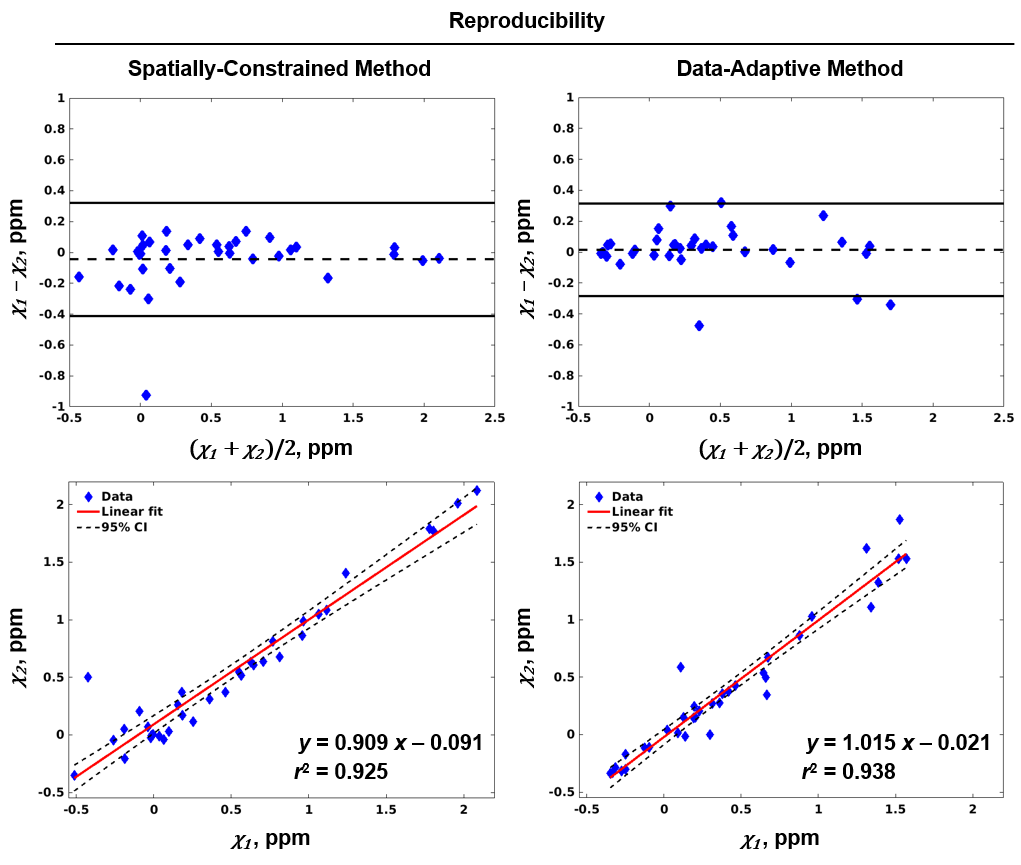
Figure 4.
Bland-Altman plots (top row) indicate higher reproducibility of the data-adaptive
method across two different acquisition protocols (LOA 0.28/-0.31) than the spatially
constrained (LOA 0.41/-0.32). Higher reproducibility of the data-adaptive method is further confirmed by the linear
regression analysis (bottom row), where it exhibits tighter 95% confidence intervals and slope closer to one.
DOI: https://doi.org/10.58530/2022/0109