0108
T2* mapping for Fat and Water images using Two-Point Dixon method with intrinsic B0 updating1Department of Radiology, Mayo Clinic, Rochester, MN, United States
Synopsis
Accurate fat fraction and T2* evaluation offers useful diagnostic information. A data driven B0-update algorithm in conjunction with the Two-Point Dixon method is illustrated in this work, offering efficient computation to improve B0 accuracy to separate fat and water in the multiple TE acquisition. The individual fat and water signals are then used for T2* mapping. The reconstructed parametric maps have comparable quality to those of the existing methods. The results also show that the proposed method requires shorter computation time and is more stable in the presence of an inaccurate reference field map.
Introduction
T2* mapping and fat fraction mapping provides diagnostic information1,2. Reliable parametric evaluation depends on accurate fat and water separation. The Two-Point Dixon method is one of the conventional algorithms to differentiate these two components featuring fast computation but is vulnerable to off-resonance. Non-linear model fitting, such as T2* IDEAL, has proposed to address the influence of B0 and to estimate T2*, fat and water components in a single solver3. However, non-linear model fitting usually requires a proper reference field map to start with and is often sensitive to noise.A data driven B0-update approach is proposed for the Two-Point Dixon method, making use of the intrinsic phase differences to improve B0 accuracy. The method has been successfully implemented to mitigate blurring artifacts in Spiral imaging4. This model does not require non-linear fitting, making it more robust over a range of initial choice of B0 so long as the frequency inaccuracy does not exceed the chemical shift. The present work expands the method to accommodate multi-echo acquisition in purpose of facilitating estimation of T2* in the presence of fat and water.
Theory
Both fat and water signals are assumed in-phase after excitation. The odd and even echo signals acquired at different TEs can be expressed by $$S_o (2k-1) = \Phi (W_k +F_k\Psi_{2k-1})e^{j\omega_0(TE_1+2(k-1) \Delta TE)} , and$$$$S_e (2k) = \Phi (W_k +F_k\Psi_{2k})e^{j\omega_0(TE_1+(2k-1) \Delta TE)} $$$$ for \ k = 1, 2, 3, 4, ..., N,$$ where $$$\Phi$$$ is the phase after excitation, $$$\omega_0$$$ is the off-resonance frequency, $$$TE_1$$$ is the first echo time, $$$\Delta TE$$$ is the echo spacing and is chosen to generate opposite phase across consecutive echoes, and $$$\Psi_i$$$ is the chemical shift induced phase variation of the fat signal at the i-th echo time. Fat and water signals can then be calculated according to a reference frequency $$$\omega_r$$$:$$W'_k = (\Psi_{2k}-\Psi_{2k-1})^{-1} (\Psi_{2k} S_o(2k-1) e^{-j \omega_r (TE_1+2(k-1) \Delta TE)} - \Psi_{2k-1} S_e(2k) e^{-j \omega_r (TE_1+(2k-1)\Delta TE)}) , and$$$$F'_k = (\Psi_{2k}-\Psi_{2k-1})^{-1} (S_o(2k-1) e^{-j \omega_r (TE_1+2(k-1) \Delta TE)} - S_e(2k) e^{-j \omega_r (TE_1+(2k-1)\Delta TE)}) .$$The error in frequency, $$$\Delta \omega \equiv \omega_0 - \omega_r$$$, of each fat and water pair becomes$$\Delta \omega_k = {1\over{\Delta TE}} arg({{(W'_k+F'_k\Psi_{2k}) \times conj(W'_k+F'_k\Psi_{2k-1})}\over{(W'_k+F_k\Psi_{2k}) \times conj(W_k+F_k\Psi_{2k-1})}}) $$
Although $$$W_k$$$ and $$$F_k$$$ are unknown, they can be approximated by $$$|W_k|$$$ and $$$|F_k|$$$ respectively. The average frequency difference $$${\overline{\Delta \omega}} = {{\Sigma_k \Delta \omega_k}\over{N}}$$$ then updates the reference frequency via $$$ \omega'_r = \omega_r + {\overline{\Delta \omega}}.$$$ The process keeps iterating until the estimated frequency offset converges. The separated fat and water components are subsequently fit to a log linear T2* decay model to obtain the water, fat and T2* map. According to last two equations evaluating fat, water and B0 offset, the total number of addition/subtraction and multiplication/division is 20, excluding the complex functions for each pair of echo signals. On the other hand, the addition/subtraction and multiplication/division for T2* IDEAL is around three times of the proposed method, exclusive of the matrix inversion and complex functions.
Materials and Methods
Three volunteer studies were performed on a 1.5T scanner (Ingenia Ambition, Koninklijke Philips, Best, Netherlands) for two knee scans and one abdominal scan following informed consent. The imaging sequence was the fly-back multi-echo gradient echo sequence. Maximal sampling frequency was used to reduce chemical shift displacement. Other scan parameters are listed in Table 1.Reconstructions by T2* IDEAL and the proposed method were both processed for comparison. The initial field map approximation was obtained by the phase difference of the 1st and the 3rd echoes. Another field map, equal to 85% magnitude of the approximation, was used for error simulation in purpose of testing the stability of the algorithms in the knee data.
Results
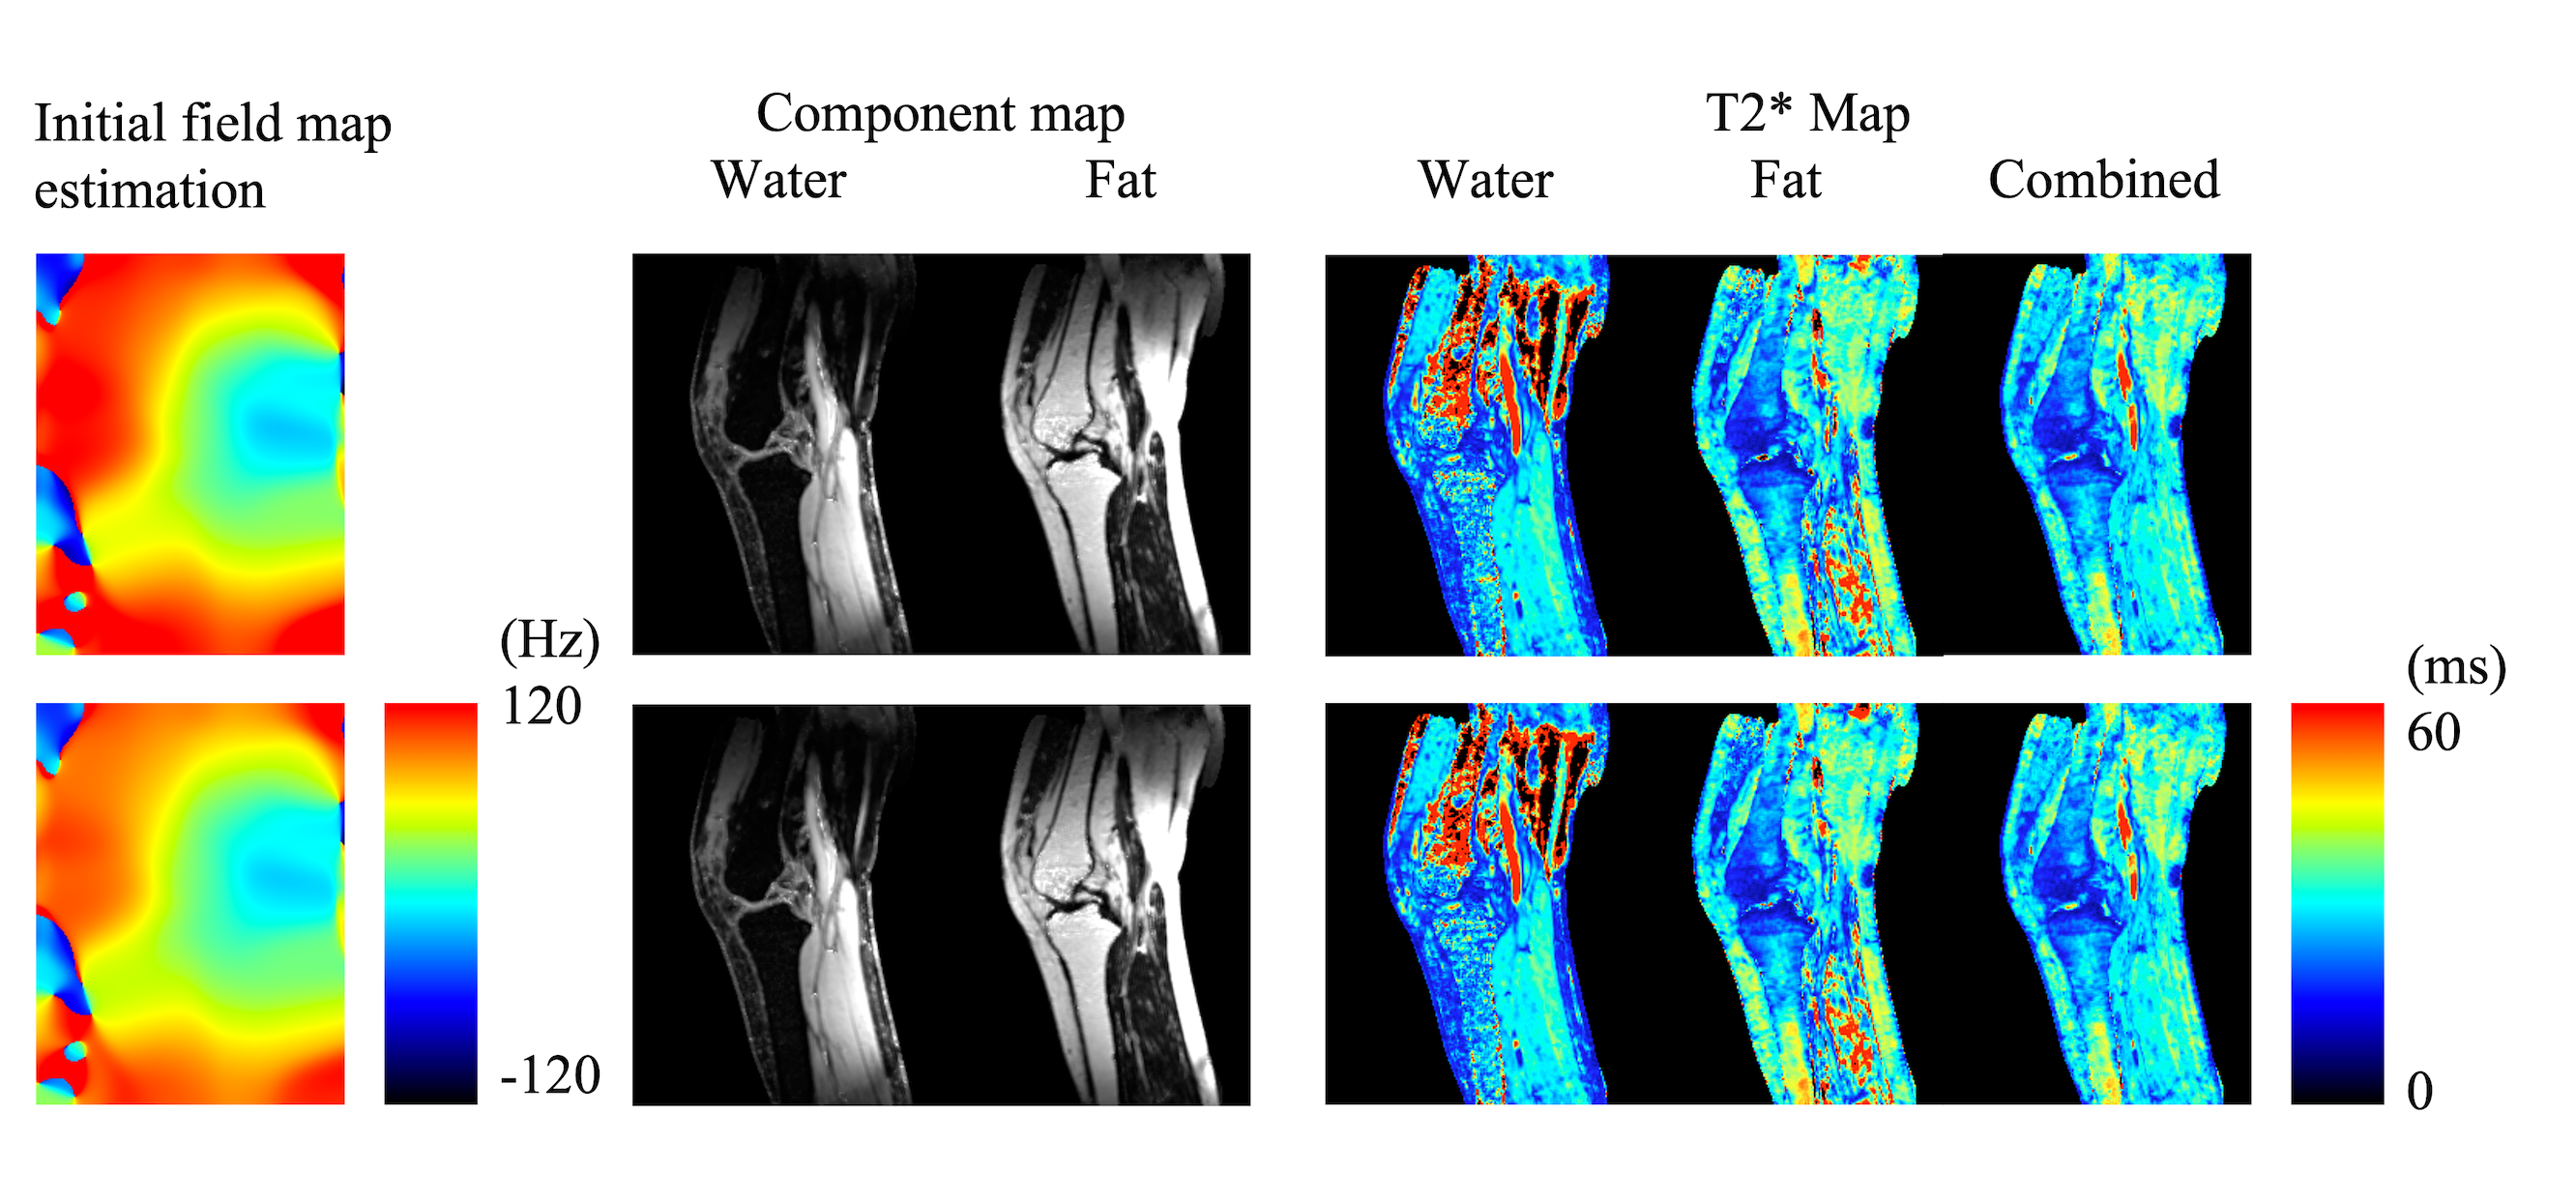
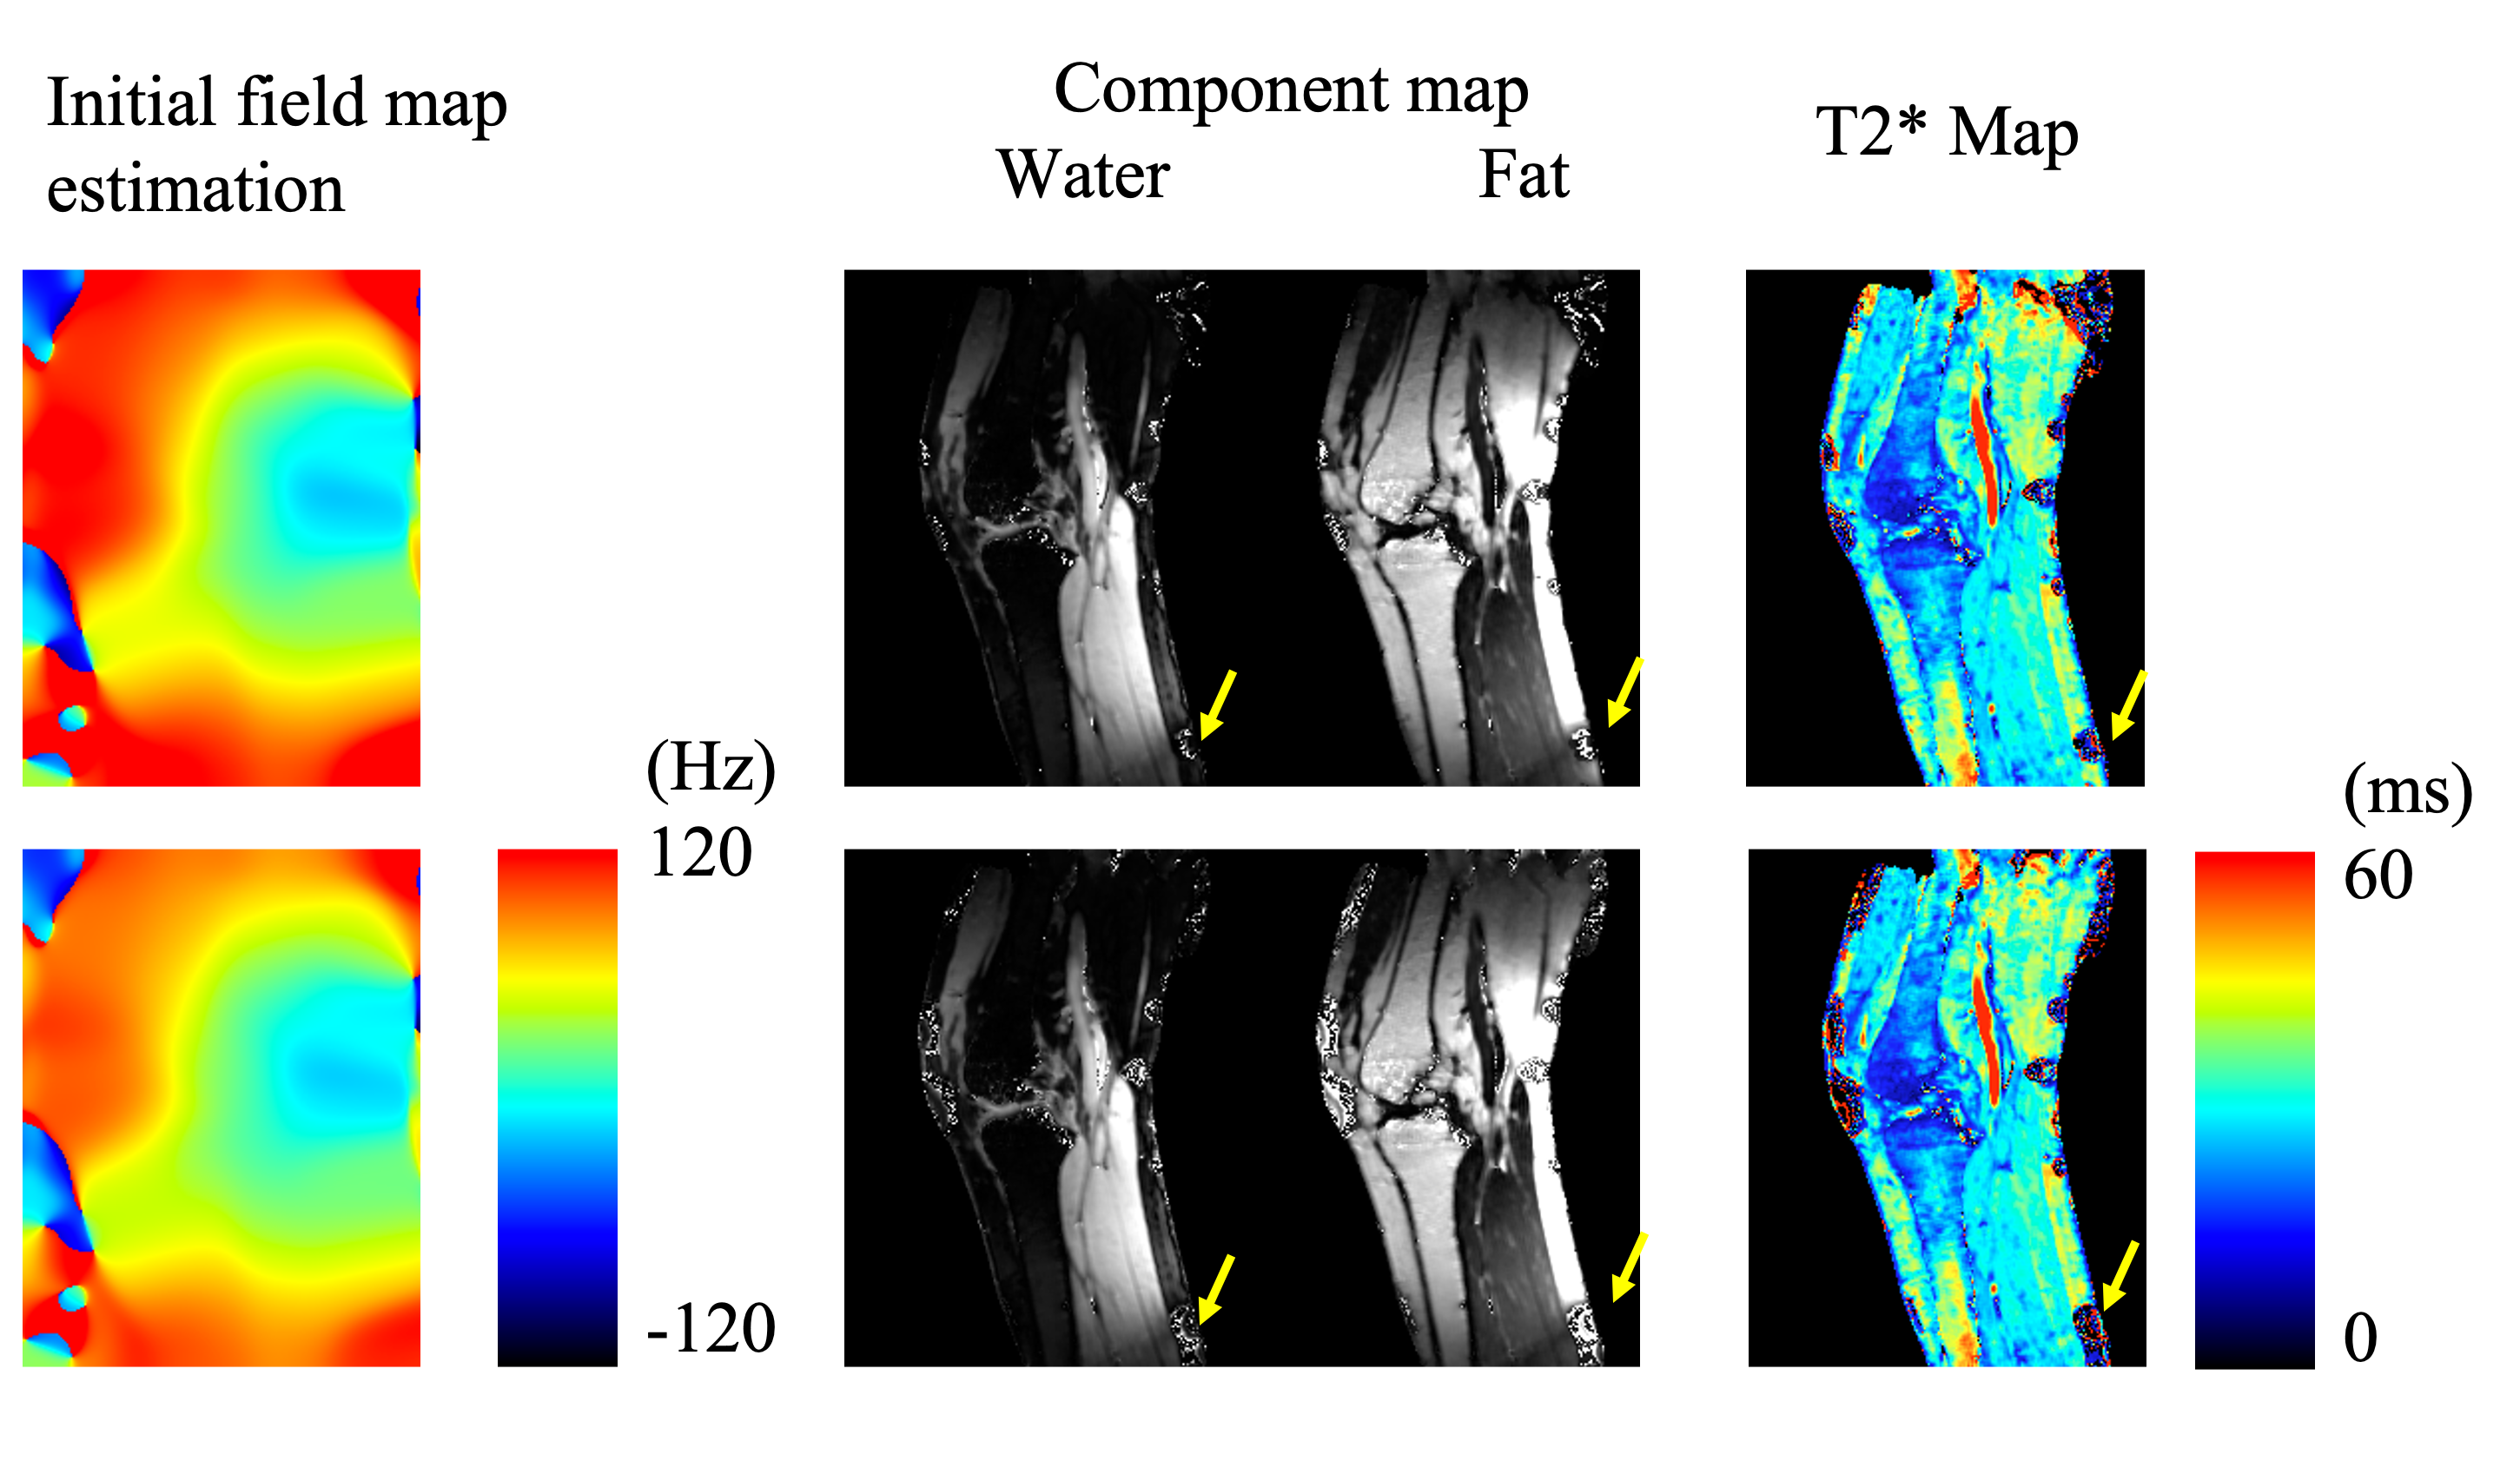
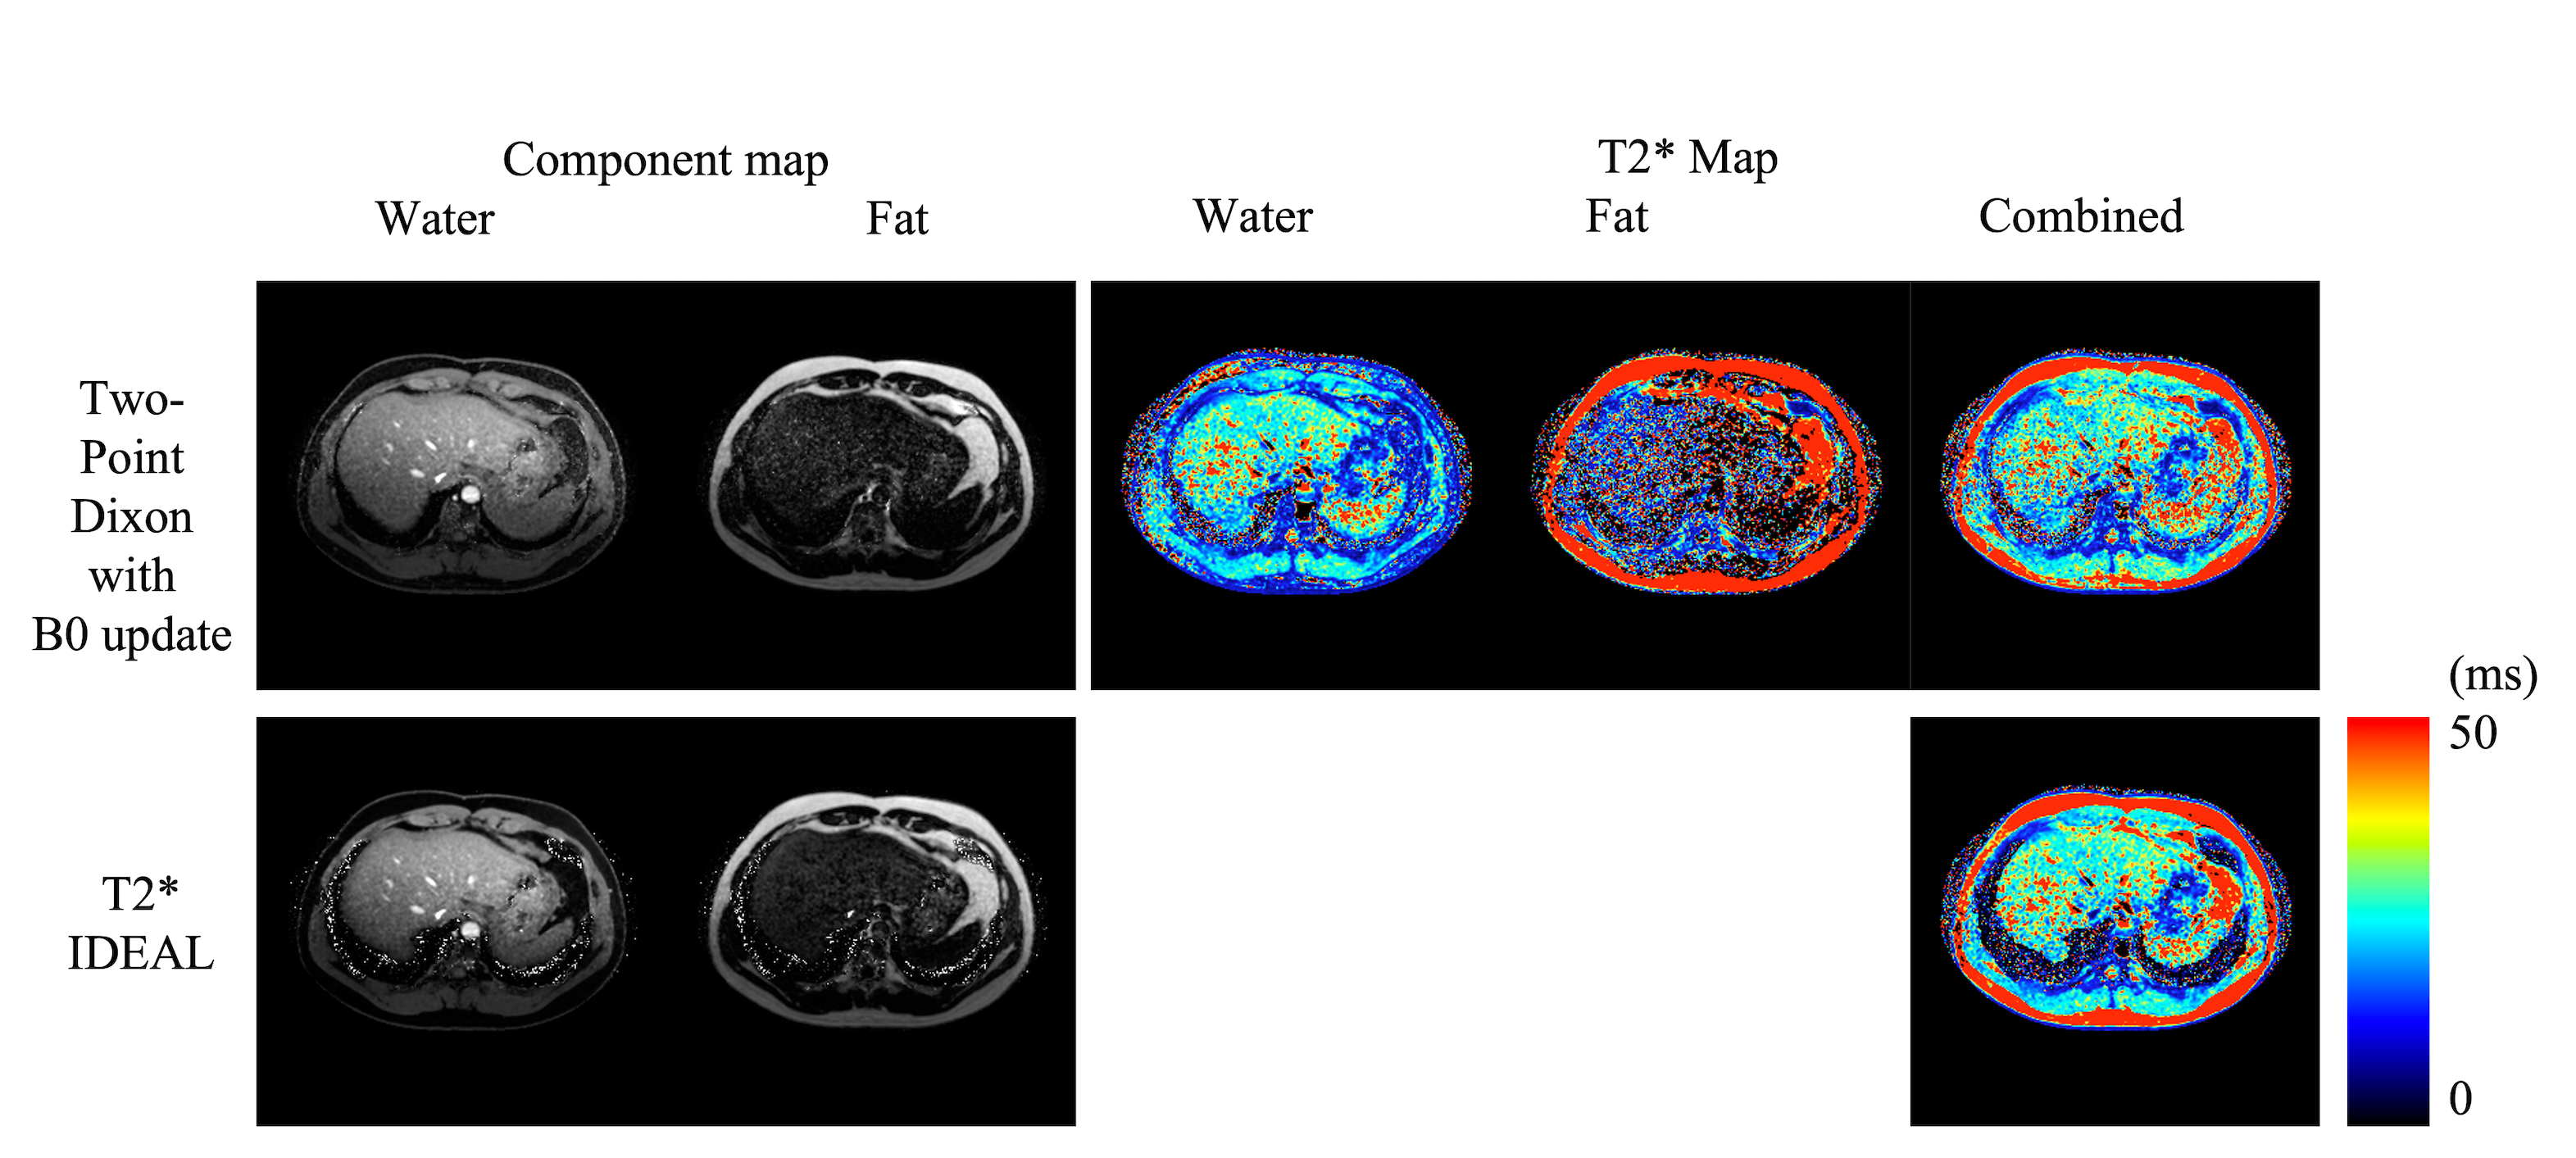
Figs. 1 and 2 demonstrate the results of the knees from the two testing algorithms. The combined T2* map evaluated from each compartment $$$ ({{W+F}\over{T2^*_c}} = {W\over {T2^*_W}}+{F\over {T2^*_F}}) $$$ is similar to the reconstruction by T2* IDEAL. A sparkling pattern can be seen in the fat and water images from T2* IDEAL possibly due to noise amplification. When an error is introduced to the initial reference field map, the proposed method was able to recuperate images of similar quality. However, significant difference can be found in the region of high susceptibility in the results of T2* IDEAL. For the liver scan in Fig. 3, the two comparing approaches exhibit similar efficacy in evaluating the fat, water and the combined T2* maps. However, the proposed method is able to estimate individual T2* maps for each component. Different T2* values of fat are found in the subdermal region and around the spine, which could be indications of different types of adipose tissue or different magnetic environments.Discussions and conclusion
This study adopts the intrinsic phase information to improve B0 estimation allowing fat and water components to be separated properly using the Two-Point Dixon method. T2* fitting is then applied to each component to obtain both water T2* and fat T2* maps. The proposed method is computationally efficient thanks to simplicity of the model, and is less prone to noise and choice of B0. A limitation of the proposed method is the requirement of the echo spacing to generate opposite fat phase between pairs of neighboring echoes.Acknowledgements
This study was supported in part by Koninklijke Philips.References
1. Obrzut, M., et al., Value of liver iron concentration in healthy volunteers assessed by MRI. Sci Rep, 2020. 10(1): p. 17887.
2. Horng, D.E., et al., Comparison of R2* correction methods for accurate fat quantification in fatty liver. J Magn Reson Imaging, 2013. 37(2): p. 414-22.
3. Yu, H., et al., Multiecho reconstruction for simultaneous water-fat decomposition and T2* estimation. J Magn Reson Imaging, 2007. 26(4): p. 1153-61.
4. Chao, T.-C.W., Dinghui; Krishnamoorth, Guruprasad, Pipe, James G. A semi-autofocus method to improve two-point Dixon spiral imaging. in 2020 ISMRM & SMRT VIRUTAL CONFERENCE & EXHIBITION. 2020. ISMRM.
Figures