0107
Inversion Recovery Look-Locker T1-Mapping for Abdominal Imaging: How Many Slices Can One Fit in a Single Breath-Hold?1Siemens Healthcare USA, Tucson, AZ, United States, 2Department of Electrical Engineering, University of Arizona, Tucson, AZ, United States, 3Siemens Healthineers USA, New York, NY, United States, 4Department of Biomedical Engineering, University of Arizona, Tucson, AZ, United States, 5Department of Medical Imaging, University of Arizona, Tucson, AZ, United States, 6Siemens Healthineers USA, Austin, TX, United States
Synopsis
In the inversion-recovery Look-Locker T1-mapping, the use of slice-selective inversion recovery pulse is explored to map the long T1-values of the spleen with as many slices as possible. The optimal slice gap in combination with interleaving the slices was determined. Artifact-free T1-maps of the spleen were obtained after parameter optimization with double the number of slices than using the standard approach in a single breath-hold. This new approach is an important step towards achieving complete coverage of abdominal organs within a single breath-hold.
Introduction
The measurement of T1 in the abdomen plays a role in the characterization of chronic liver disease1, kidney function2, mild chronic pancreatitis3, and tumor malignancy4, 5.Cartesian MOLLI is used in the clinic for cardiac and abdominal T1 mapping due to its robustness to B1 and capability of T1 mapping within a breath-hold. However, MOLLI is slice inefficient, typically yielding one slice per breath-hold, and T1 mapping is based on a limited number of TIs. Recently, a radial Look-Locker (LL) technique was proposed for rapid T1 mapping of the abdomen taking advantage of the undersampling properties6 of radial MRI. This rapid technique only requires 2-3 seconds per slice opening the possibility of improving slice efficiency within a breath-hold.
The LL pulse sequence is typically performed with a non-selective inversion-recovery (IR) pulse. To avoid T1-saturation effects, a wait time is needed which reduces the number of slices acquired in a breath-hold. In this work, we explore the use of a slice-selective IR pulse to maximize the number of slices within a breath-hold while maintaining T1-mapping accuracy through the slices.
Methods
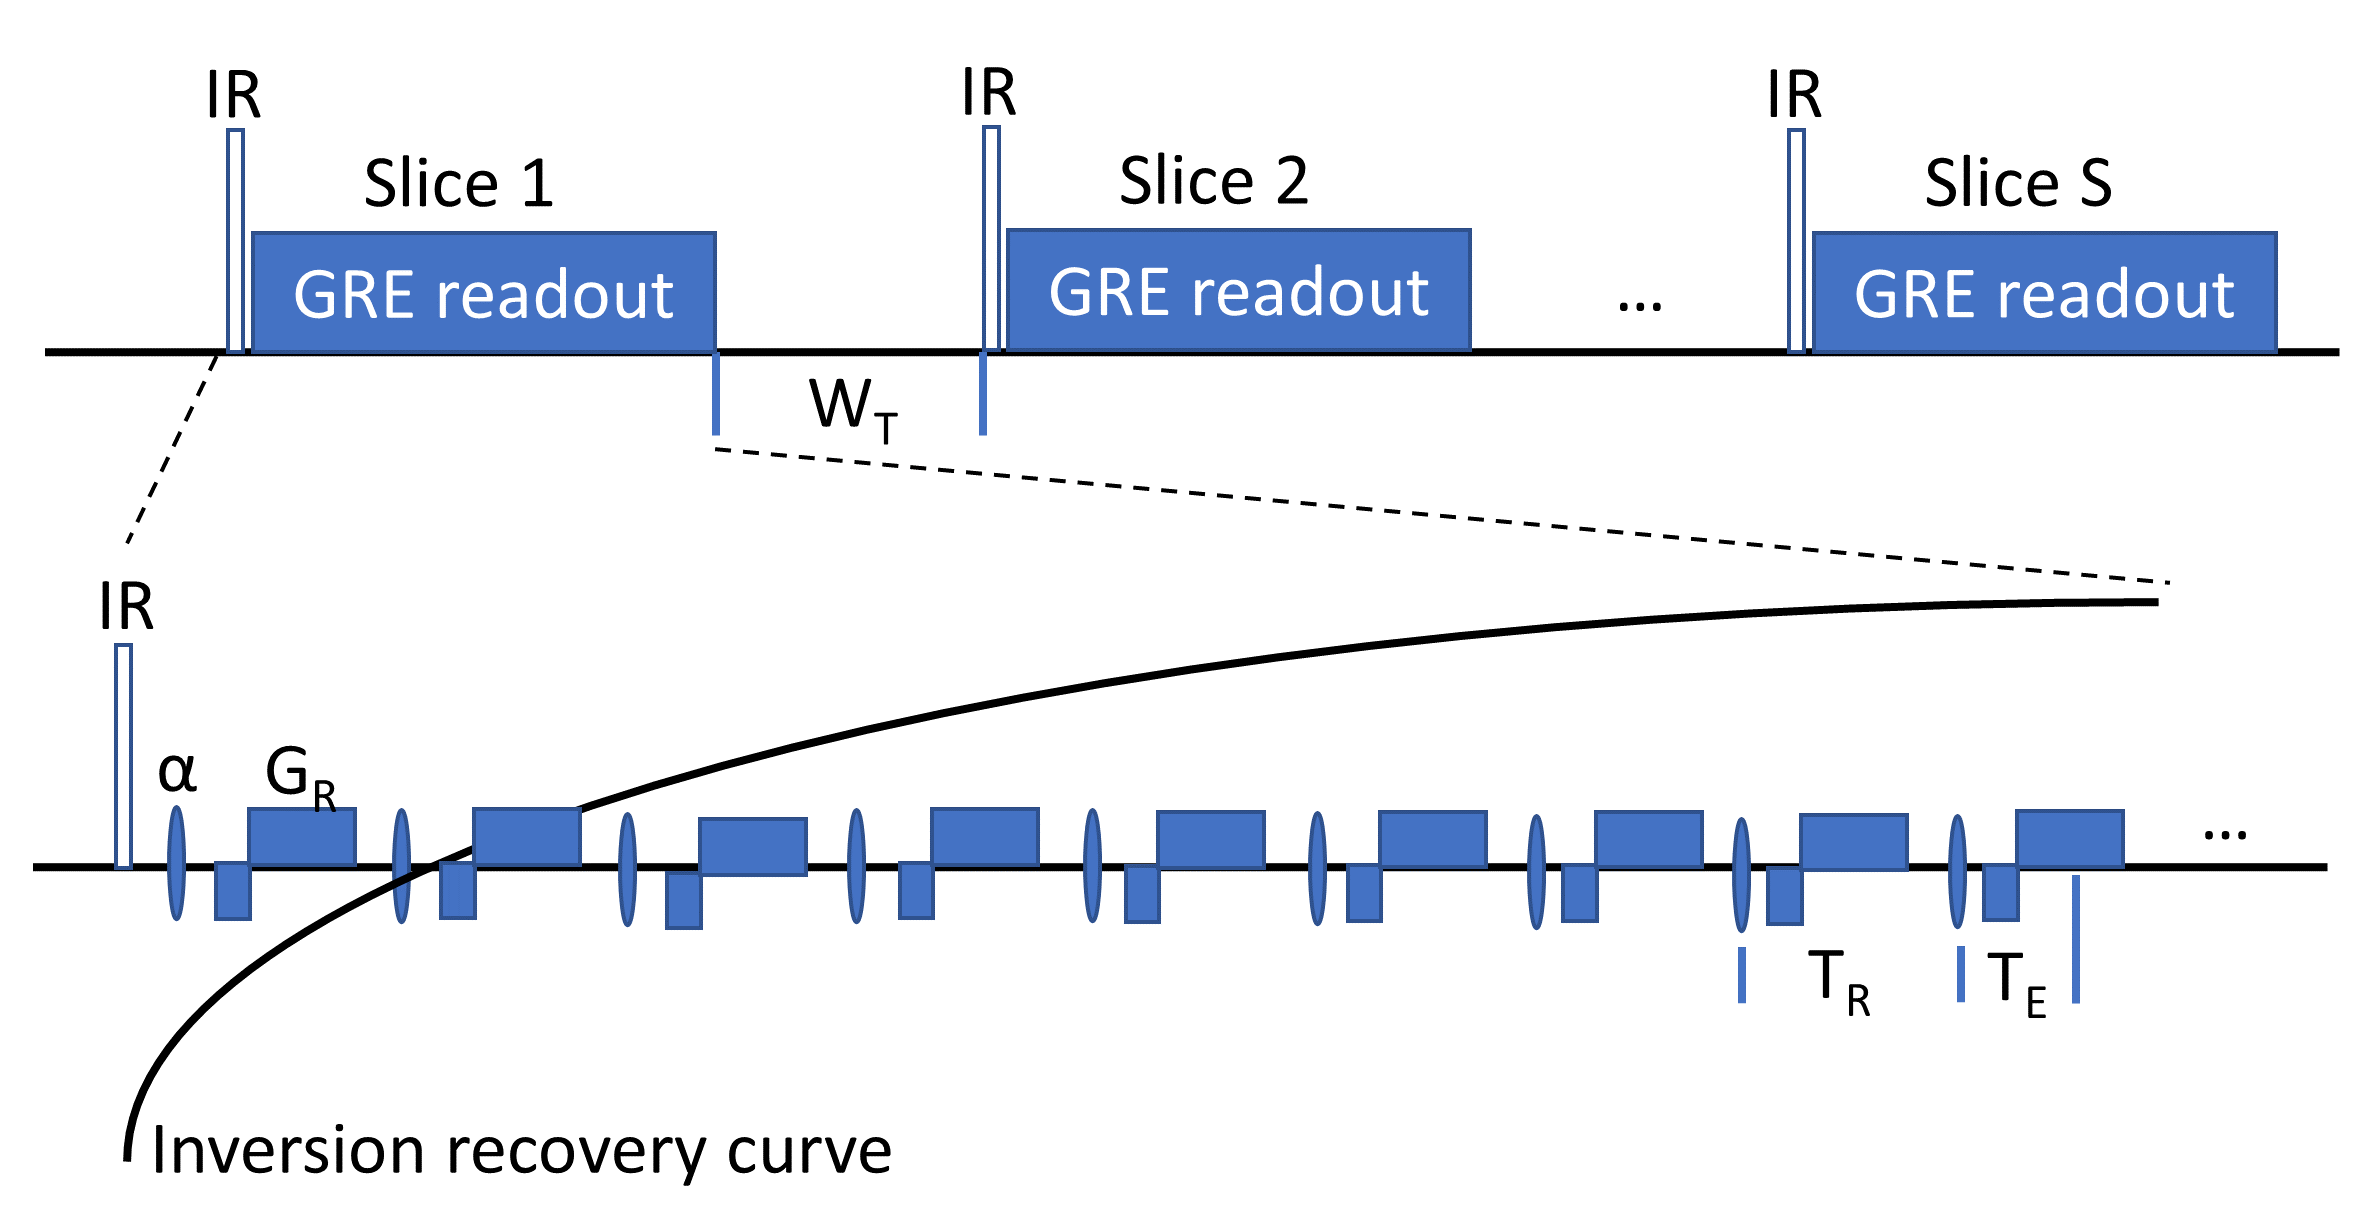
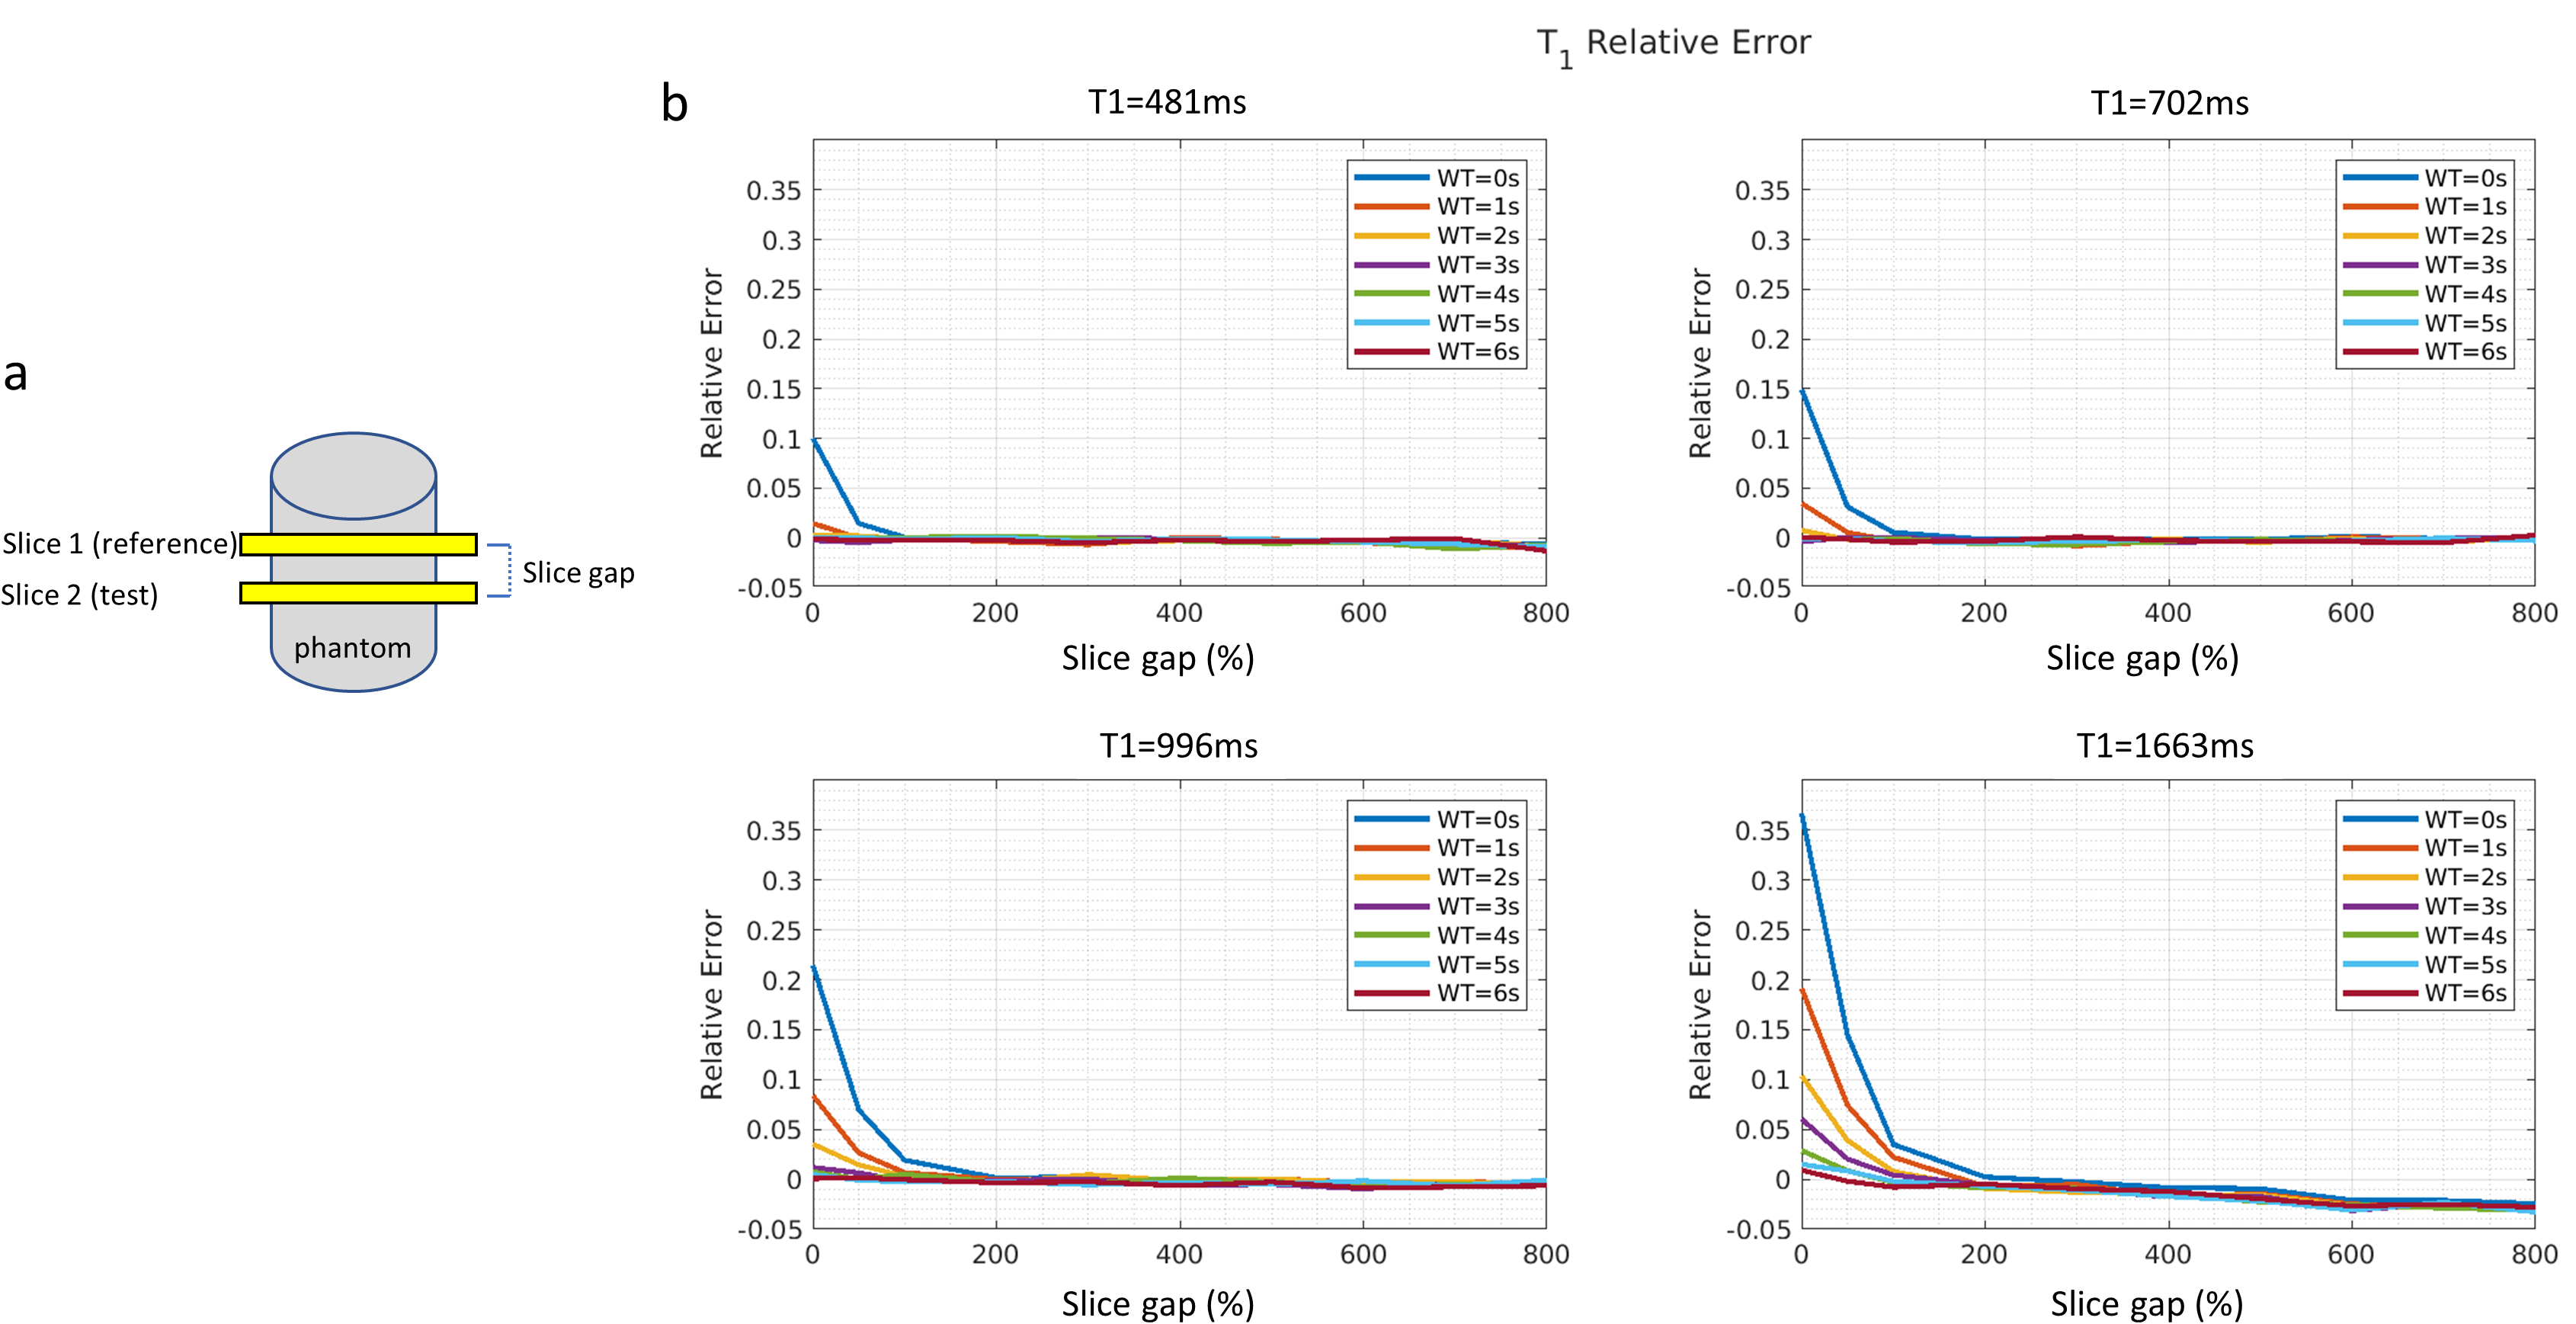
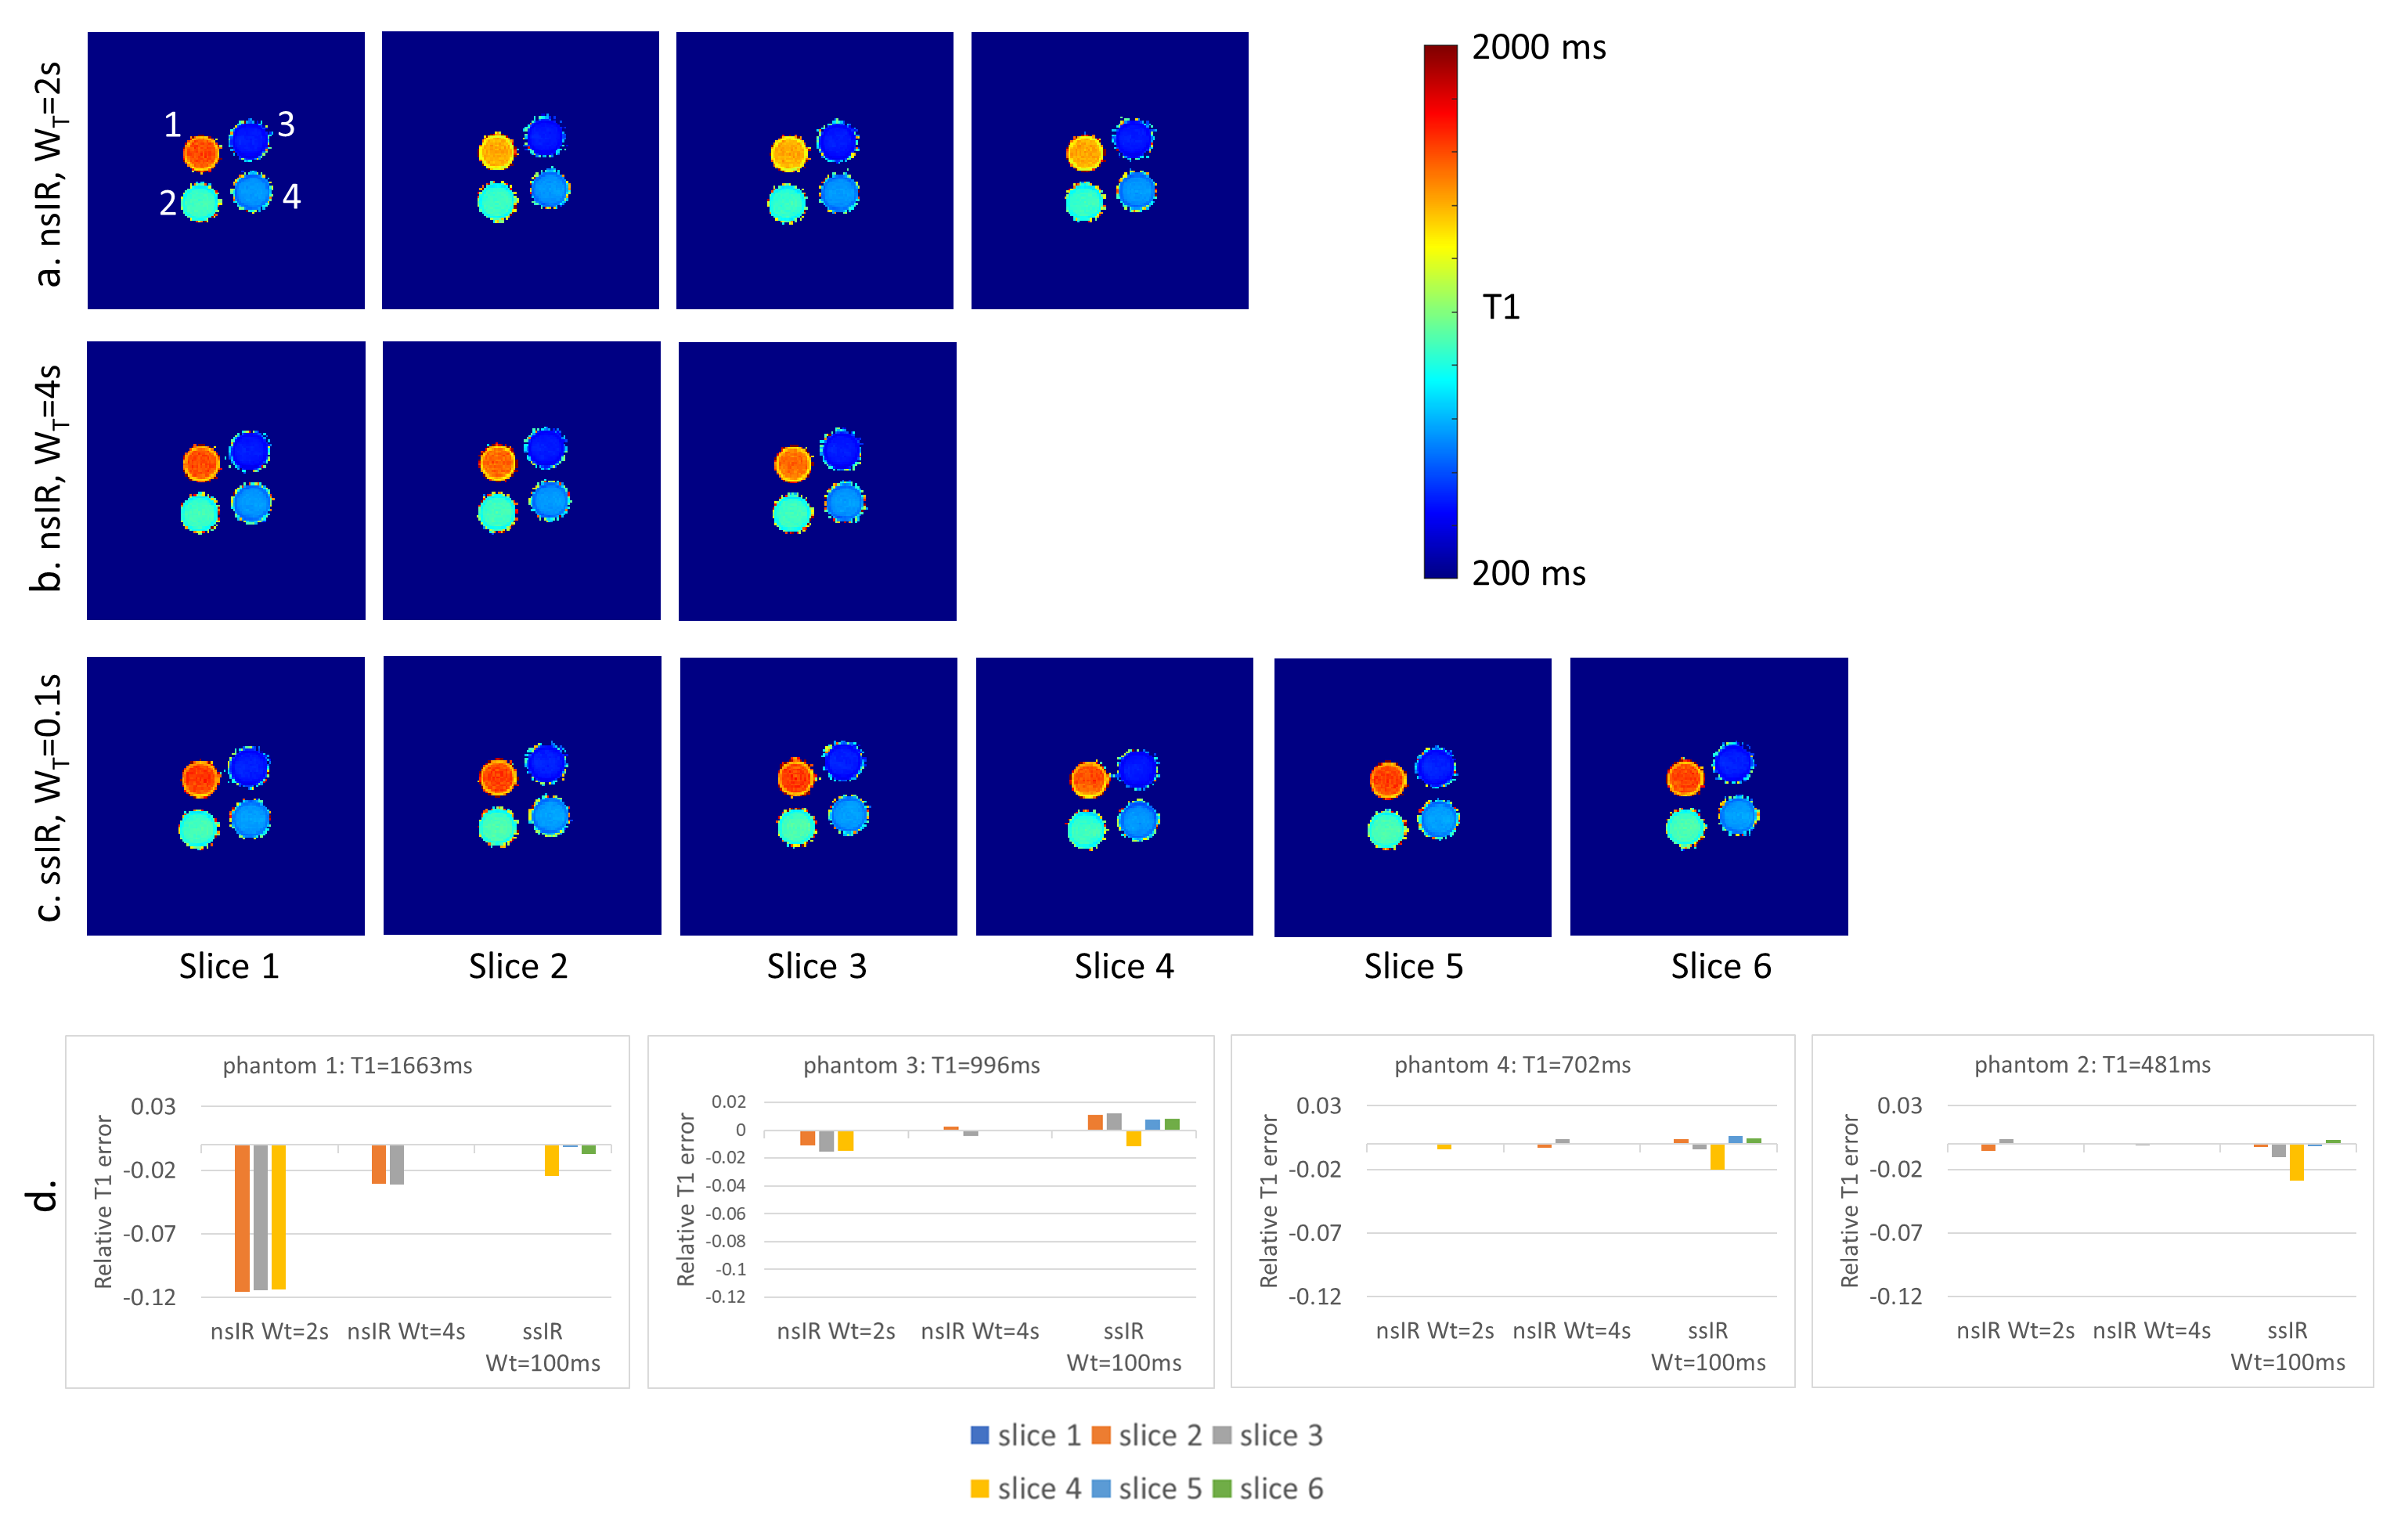
The LL T1 mapping sequence (Fig. 1) consists of an IR-pulse followed by a series of radial GRE readouts sampling the IR-curve. For each slice, this module is repeated after wait time WT. The IR-pulse can be slice-selective (ss) or non-selective (ns). To ensure optimal inversion, the slice thickness of the IR-pulse is set to 200% of the α-pulse nominal slice thickness.Phantom experiments were performed on 2% agarose NiCl2 (0.28, 0.74, 1.19, 2.1mM)7 vials to modulate T1. Experiment 1 was designed to assess the effect WT and slice gap on T1 estimation when using a ssIR pulse. Experiment 2 was designed to compare nsIR and ssIR T1-mapping based on results from experiment 1. The following acquisition schemes were used in experiment 2 using a slice gap 50%, with interleaved slice acqusition: “ssIR, WT=100ms” “nsIR, WT=2s”, “nsIR, WT=4s”. T1-values were calculated from voxels within the four vials.
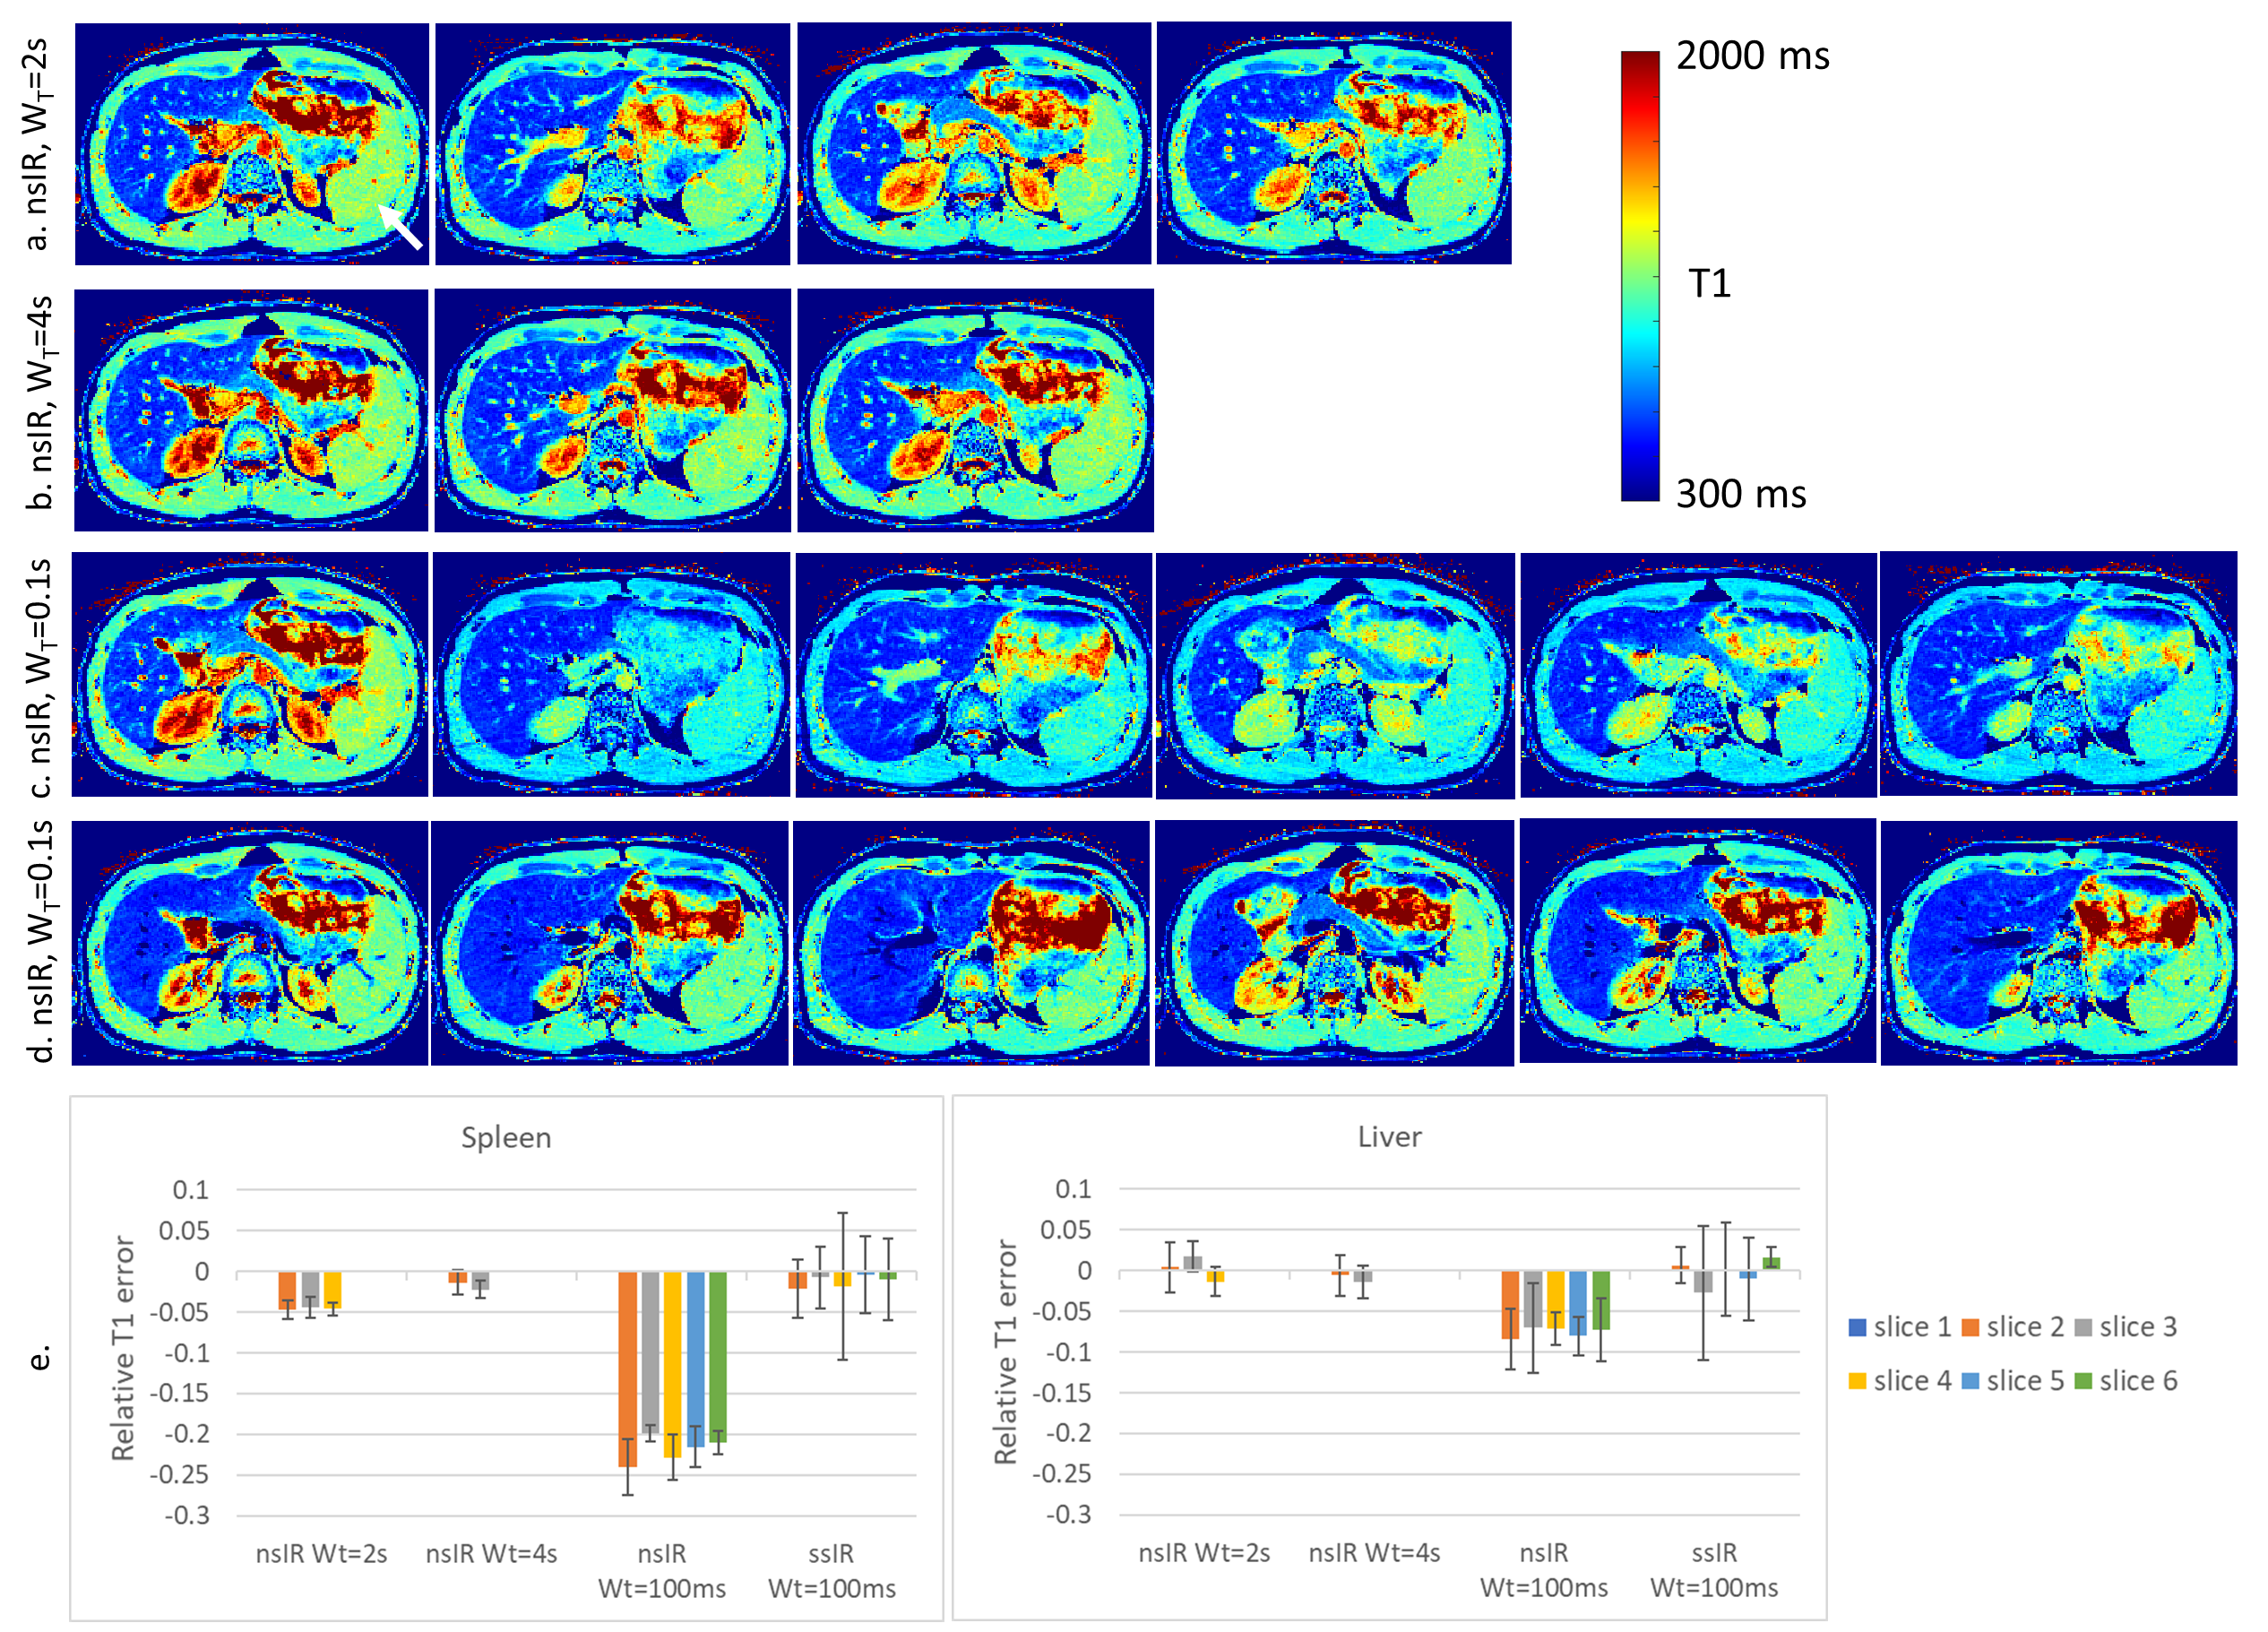
For abdominal T1-mapping, five subjects were consented according to the IRB regulations of the University of Arizona. The same imaging parameters as in phantom experiment 2 were used. In addition, data were acquired with “nsIR, WT=100ms”. All experiments were performed at 3T (Magnetom Skyra, Siemens Healthcare, Erlangen, Germany) with FOV=40cm, readout points=256, slice thickness (α-pulse)=6mm, TE=1.7ms, TR=5ms, α=10°, radial views per slice=640.
Images were reconstructed using the local low rank algorithm8 by grouping 16 radial views per TI set yielding 40 TI images along the 2.8s recovery curve (temporal resolution=80ms). T1 fitting was performed using the ABT1-model9.
Results and Discussion
In phantom experiment 1, the effect of T1-saturation from the ssIR-pulse was investigated by choosing two slices (Fig. 2a) and varying slice gap and WT between them. Fig. 2b displays the relative T1-error for various T1-values. T1-error increases with shorter WT with T1-values becoming stable at slice gaps≥200% even for the longest T1s indicating cross talk between ssIR-pulses. From this experiment, we concluded that a “ssIR, WT=100ms” parameter set - for highest slice duty cycle, that is, minimal WT - required a 50% gap given an odd/even slice interleaving scheme.Fig. 3 shows phantom T1-maps for (a) “nsIR, WT=2s”, (b) “nsIR, WT=4s’’, and (c) “ssIR, WT=100ms”. For “nsIR, WT = 2s” the vial with longest T1 (vial “1”) shows T1-attenuation with increasing slice number; the T1-error relative to the reference slice is shown in Fig. 3d. This T1-saturation effect is reduced when WT=4s at the expense of reduced number of slices within a breath-hold (Fig. 3b). T1-values obtained with “ssIR, WT=100ms” remain constant across slices (Fig. 3c) and 6 slices can be acquired in one breath-hold compared to three slices with “nsIR, WT=4s’’ (Fig. 3b).
A similar experiment was performed in vivo for abdominal data (Fig. 4). In this experiment we also added a “nsIR, WT=100” acquisition as a direct comparison to the slice efficient “ssIR, WT=100” (Fig. 4c). The effect of T1-saturation in the spleen (arrow), an organ with T1-value of ~1.3s, is seen in slices after the first acquired slice for “nsIR, WT=2s” and “nsIR, WT=100ms”. In contrast, the T1-maps for the “nsIR, WT=4s” and the “ssIR, WT=100ms” are not deteriorated. The advantage of “ssIR, WT=100ms” is the 50% increase in slice efficiency. Another advantage of using a ssIR-pulse is that signal from blood vessels appears dark in the T1-maps due to flow (while these appear bright in the nsIR T1-maps). This reduces the confounding vessel effect when assessing anatomy (e.g., focal liver lesions).
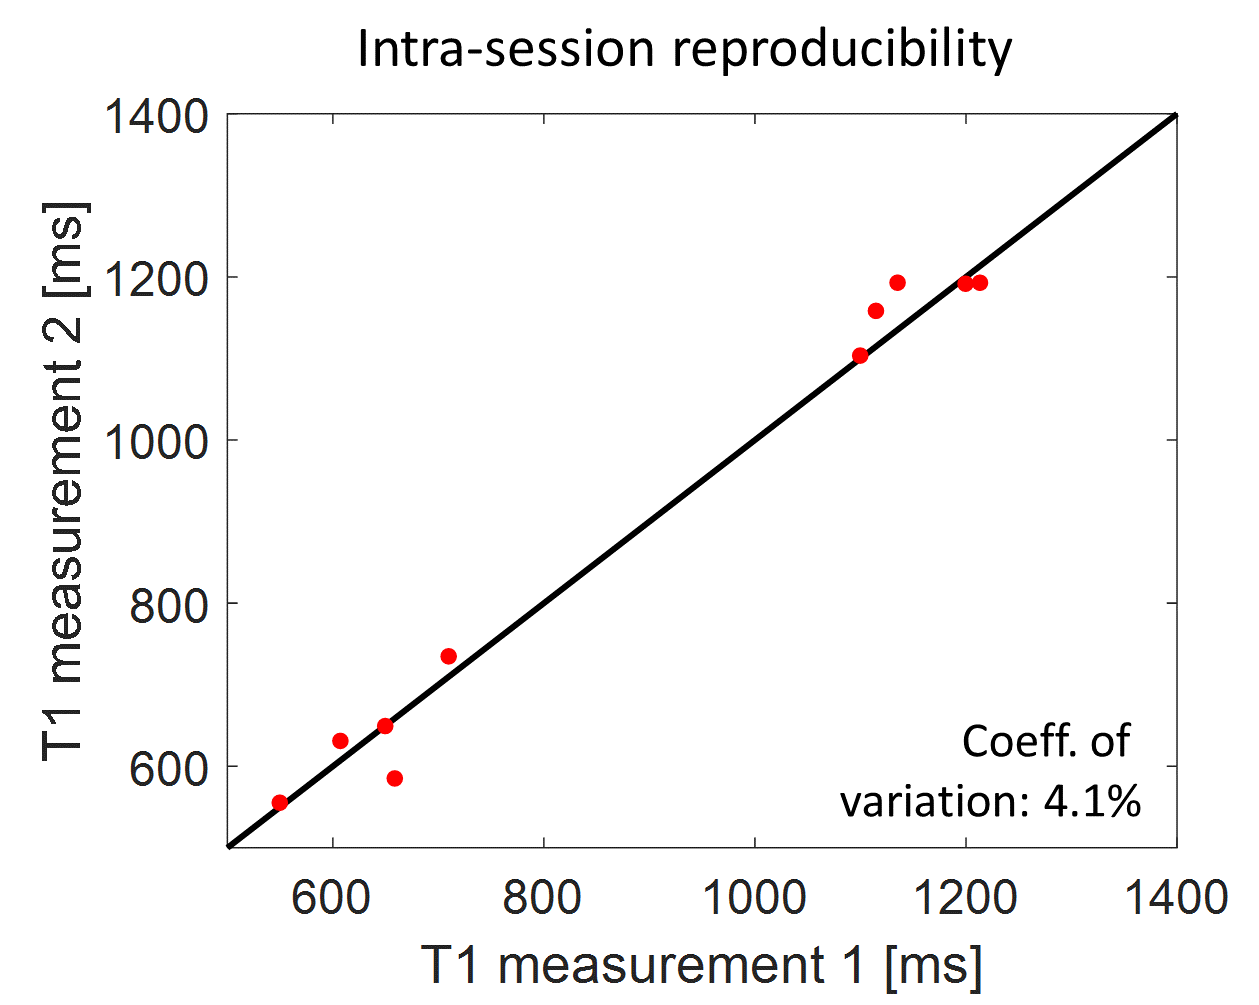
To test reproducibility the imaging scans were repeated for all subjects after re-running the calibration scans. The correlation plot for liver and spleen ROIs from T1-maps for the optimized “ssIR, WT=100ms” is displayed in Fig. 5. The coefficient-of-variation is 4.1%.
Conclusion
A ssIR-pulse allows to minimize the WT and therefore doubles the number of slices per breath-hold in a T1-mapping experiment. Attenuation-free T1-maps are obtained with an optimized slice gap and slice interleaving, an important step towards efficient coverage of abdominal organs within a single breath-hold.Acknowledgements
The authors would like to acknowledge the support by NIH (R01CA245920), the Arizona Biomedical Research Commission (CTR056039), and the Technology and Research Initiative Fund (TRIF) Improving Health Initiative.References
1. Kim JW, Lee YS, Park YS, Kim BH, Lee SY, Yeon JE, Lee CH. Multiparametric MR Index for the Diagnosis of Non-Alcoholic Steatohepatitis in Patients with Non-Alcoholic Fatty Liver Disease. Sci Rep. 2020;10(1):2671.
2. Huang Y, Sadowski EA, Artz NS, et al. Measurement and comparison of T1 relaxation times in native and transplanted kidney cortex and medulla. J Magn Reson Imaging. 2011;33:1241-1247.
3. Tirkes T, Lin C, Fogel EL, Sherman SS, Wang Q, Sandrasegaran K. T1 mapping for diagnosis of mild chronic pancreatitis. J Magn Reson Imaging. 2017 Apr;45(4):1171-1176.
4. Fahlenkamp, U.L., Ziegeler, K., Adams, L.C. et al. Native T1 mapping for assessment of the perilesional zone in metastases and benign lesions of the liver. Sci Rep 10, 12889 (2020).
5. Goldberg MA, Hahn PF, Saini S, Cohen MS, Reimer P, Brady TJ, Mueller PR. Value of T1 and T2 relaxation times from echoplanar MR imaging in the characterization of focal hepatic lesions. AJR Am J Roentgenol. 1993;160(5):1011-1017.
6. Li Z, Bilgin A, Johnson K, Galons JP, Martin DR, and Altbach MI, Rapid high-resolution T1 mapping using highly accelerated radial steady-state free-precession acquisition, J Magn Reson Imaging 2019; 49(1):239-252
7. Zhao R, Hamilton G, Brittain JH et al. Design and evaluation of quantitative MRI phantoms to mimic the simultaneous presence of fat, iron, and fibrosis in the liver. Magn Res Med 2021; 85(2): 734-747
8. https://mrirecon.github.io/bart/
9. Deichmann R, Haase A. Quantification of T1-values by SNAPSHOT-FLASH NMR imaging. J Magn Reson 1992; 96: 608-612
Figures