0097
Deep-Learning-based contrast synthesis from MRF parameter maps in the knee1Research Unit of Medical Imaging, Physics and Technology,, University of Oulu, Oulu, Finland, 2Department of Applied Physics, University of Eastern Finland, Kuopio, Finland, 3Medical Research Center, University of Oulu and Oulu University Hospital, Oulu, Finland, 4Department of Diagnostic Radiology, Oulu University Hospital, Oulu, Finland, 5Center for Advanced Imaging Innovation and Research (CAI2R) and Bernard and Irene Schwartz Center for Biomedical Imaging, Department of Radiology, New York University Grossman School of Medicine, New York, NY, United States, 6Centre for Advanced Imaging, Queensland University, Brisbane, Australia
Synopsis
In this study, deep convolutional neural networks (DCNN) are used to synthesize contrast-weighted magnetic resonance (MR) images from quantitative parameter maps of the knee joint obtained with magnetic resonance fingerprinting (MRF). Training of the neural networks was performed using data from 142 patients, for which both standard MR images and quantitative MRF maps of the knee were available. The study demonstrates that synthesizing contrast-weighted images from MRF-parameter maps is possible utilizing DCNNs. Furthermore, the study indicates a need to tune up the dictionary used in MRF so that the parameters expected from the target anatomy are well-covered.
Introduction
Magnetic resonance fingerprinting (MRF) is a technique that allows quantitative MRI, e.g., T1 and T2-mapping, in a clinically feasible scan time. However, the clinical adoption of MRF is held back because standard contrast-weighted MR images are still required for radiological evaluation. Although both AI- and model-based methods exist for synthesizing these MR images either from reconstructed parameter maps or directly from raw MRF data1–4, they are not optimal and a need for further studies exists. First, model-based methods may lead to generation of unrealistic contrasts due to difficulty of modelling, e.g., noise characteristics or partial volume effects. Further, AI-based strategies so far have been utilized only in brain imaging3,4, where methods like spectral fat saturation are rarely used. In this work, we developed convolutional neural networks for synthesizing various contrasts (PD-weighted, fat saturated T2-weighted, and DESS contrasts) from MRF parameter maps (PD, T1, T2 and B1) and demonstrated them for MRI of the knee joint.Materials and Methods
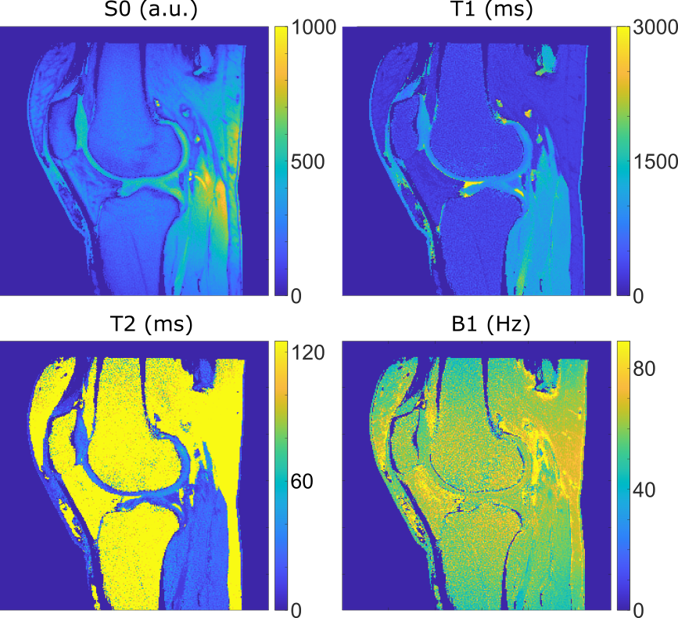
The MRI data was acquired at 3T (Siemens Skyra, Erlangen, Germany) from 142 knee joints of patients form Northern Finland Birth Cohort 19865 under relevant ethical permission. Standard contrast-weighted images were collected using relevant 3-D sequences (PD-weighted SPACE sequence, fat-saturated T2-weighted SPACE sequence and fat-saturated DESS sequence). During the same scanning session ten 2-D slices of MRF data was obtained from each patient. An MRF sequence previously introduced for articular cartilage evaluation6 was utilized to reconstruct PD-, T1-, T2- and B1-maps (Fig. 1). The conventional 3-D imaging data was resliced to match the MRF-slice geometry using Slicer7 (version 4.11.20200930).Convolutional neural networks (Fig. 2) were trained to generate desired MRI contrasts from the MRF data. A total number of 1420 slices were used: 1390 slices for training the networks and 30 slices as the validation set. The networks were generated using Tensorflow8 (version 2.5.1) The network weights were initialized using Kaiming He-uniform initialization and trained using RMSProp algorithm with a batch size of 8 images per batch for 240 epochs. L1-loss and perceptual loss functions using the outputs of the third convolution of the third layer of VGG19 networks, and their combinations were tested. The combined loss functions were realized as a weighted sum of the L1- and perceptual loss functions. The utilized weights for perceptual loss were 0.01, 0.05, and 0.20.
The resulting images were qualitatively compared with the target images as well as using structural similarity and peak signal-to-noise ratio.
Results
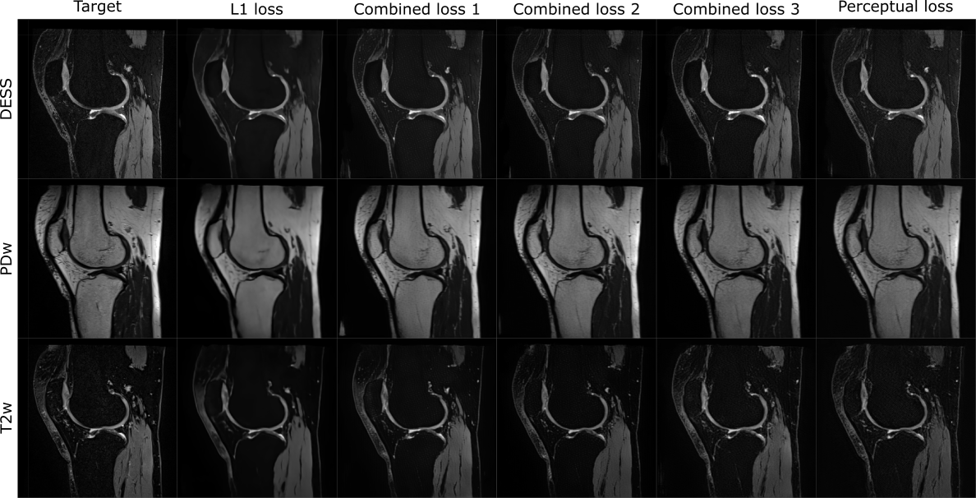
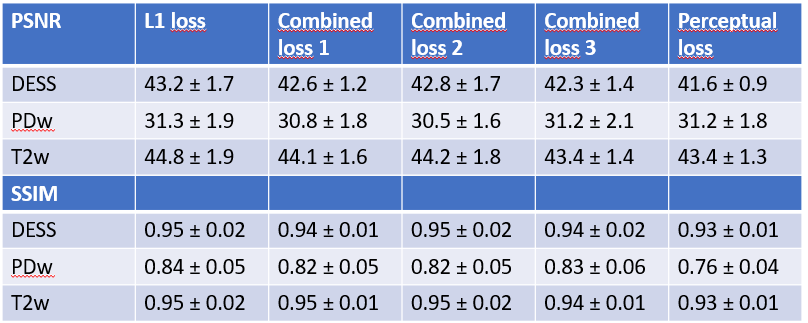
In general, the proposed network was able to produce the targeted contrast-weighted images (Fig. 3). Minimizing the perceptual loss function yielded the most pleasing results visually while minimizing the L1-loss expectedly lead to better performance when evaluated by single number metrics (Table 1). Error metrics indicated better performance for the fat-saturated contrasts (T2, DESS) than for the non-saturated contrast (PD) (Table 1). Specifically, all images generated by the L1-minimizing network appeared overly smooth and lacked details that were present in the perceptual loss minimizing images (Fig. 3). Furthermore, all details in the result images and targets do not exactly overlap, likely due to imperfect co-registration (Fig. 3).Discussion and Conclusions
Our study suggests that synthesizing contrast-weighted MR images (even fat-saturated) of the knee is feasible from MRF parameter maps and results in images that closely resemble those obtained with dedicated sequences.The results also suggest that for the given task, minimizing perceptual loss using CNNs lead to more feasible image quality, since utilizing L1-loss alone leads to overly smooth generated contrast weighted images. This tendency to smoothen the predicted contrast-weighted images was reduced by adding perceptual loss to L1-loss or using only perceptual loss functions.
From the error metrics and qualitative assessment of the generated images, it is evident that creating fat-saturated contrast proved to be an easier task for the network than producing non-fat-saturated PD-weighted contrast. This can be explained by the fact that the MRF technique was optimized for studying cartilage and hence the quantitative information from fatty tissues was neither properly encoded by the pulse sequence nor sufficiently accurately modeled in the dictionary (Fig. 1). In fat-saturated contrasts, the fatty tissues appear dark and thus are easier to generate by CNNs even though the quantitative information from fat is incomplete.
In the resulting synthesized images, some details of the target contrast images are not present. While this admittedly could be due to hallucinations that could be generated when minimizing the perceptual loss function using neural networks, other explanations exist as well. First, the target contrasts were not originally imaged in the same slices as the MRF data, but instead they were resliced to 2-D from pure 3-D data. Due to this, the slice profile for the target images does not match that of the purely 2-D MRF slices. Moreover, patient motion during scanning could have partly compromised the co-registration between the target images and MRF-data. This geometric mismatch between the target images and the MRF-data probably also explains the smooth nature of the L1-minimized images. Considering this, the image synthesis using convolutional neural networks leads to very encouraging results while leaving room for development in the future.
Acknowledgements
The funding from the Funding Program of Technology Industries of Finland Centennial Foundation, Jane and Aatos Erkko Foundations is gratefully acknowledged. This work was also supported in part by NIH R21 EB020096 and NIH R01 AR070297 and by the Academy of Finland (grant: #325146).References
1. Hagiwara A, Warntjes M, Hori M, et al. SyMRI of the Brain: Rapid Quantification of Relaxation Rates and Proton Density, with Synthetic MRI, Automatic Brain Segmentation, and Myelin Measurement. Invest Radiol. 2017;52(10):647-657. doi:10.1097/RLI.0000000000000365
2. Trial M, Tanenbaum XLN, Tsiouris XAJ, et al. Synthetic MRI for Clinical Neuroimaging: Results of the Magnetic Resonance Image Compilation (MAGiC) Prospective, Multicenter, Multireader Trial. Am J Neuroradiol. 2017;38:1103-1110.
3. Virtue P, Tamir JI, Doneva M, Yu SX, Lustig M. Direct Contrast Synthesis for Magnetic Resonance Fingerprinting. In: Proceedings of the 2018 ISMRM Workshop on Machine Learning. ; 2018.
4. Wang K, Doneva M, Amthor T, et al. High fidelity direct-contrast synthesis from magnetic resonance fingerprinting in diagnostic imaging. In: Proceedings of the 28th Annual Meeting of ISMRM. Vol 867. ; 2020.
5. University of Oulu. Northern Finland Birth Cohort 1986. University of Oulu. http://urn.fi/urn:nbn:fi:att:f5c10eef-3d25-4bd0-beb8-f2d59df95b8e.
6. Cloos MA, Assländer J, Abbas B, et al. Rapid Radial T1 and T2 Mapping of the Hip Articular Cartilage With Magnetic Resonance Fingerprinting. J Magn Reson Imaging. 2019;50(3):810-815. doi:10.1002/jmri.26615
7. Fedorov A, Beichel R, Kalpathy-Cramer J, et al. 3D Slicer as an image computing platform for the Quantitative Imaging Network. Magn Reson Imaging. 2012;30(9):1323-1341. doi:10.1016/j.mri.2012.05.001
8. Abadi M, Barham P, Chen J, et al. TensorFlow: A system for large-scale machine learning. In: 12th USENIX Symposium on Operating Systems Design and Implementation (OSDI ’16). Savannah, GA, USA; 2016.
Figures