0096
Gadolinium Free Synthetic Inflammation Imaging1University of Illinois at Urbana-Champaign, Champaign, IL, United States, 2UCSF, San Francisco, CA, United States, 3Cleveland Clinic, Cleveland, OH, United States
Synopsis
Traditional MRI imaging involves injecting gadolinium-diethylenetriamine pentaacetic acid (Gd-DTPA) , a pure substance that induces contrast to highlight inflammation and blood vessels in MRI images, proven to increase accuracy in radiologic diagnosis. We present a 2D V-net image contrast generation model that accurately predicts Gd-DTPA induced contrast from corresponding images without Gd-DTPA induced contrast.
Introduction
Rheumatoid arthritis (RA) is a chronic, auto-immune disease characterized by inflammation in the synovium in the joints. Each year, over 1.5 million Americans have been diagnosed with RA. Inflammation is investigated by means of contrast-based MRI, which quantifies the absorption of Gd-DTPA by areas with significant inflammation and/or blood vessels. Nevertheless, the injected contrast may cause patients discomfort and pose a socio-economic burden. In addition, previous studies depict the side-effects of Gd-DTPA such as contributing to NSF in patients with renal insufficiency1 and deposition of Gd-DTPA in brain and other tissues2. Recent advancement in deep learning brought new techniques with unprecedented results in the field of image synthesis applied to MRI with some recent examples in synthetic post contrast imaging, mostly applied to cancer3. No previous attempts have been made to generalize such techniques to non oncological contrast enhanced (CE) imaging, specifically to image inflammatory processes. In this work, we attempt to use deep learning to predict Gd-DTPA induced contrast in MRI of wrist RA patients from pre contrast images.Methods
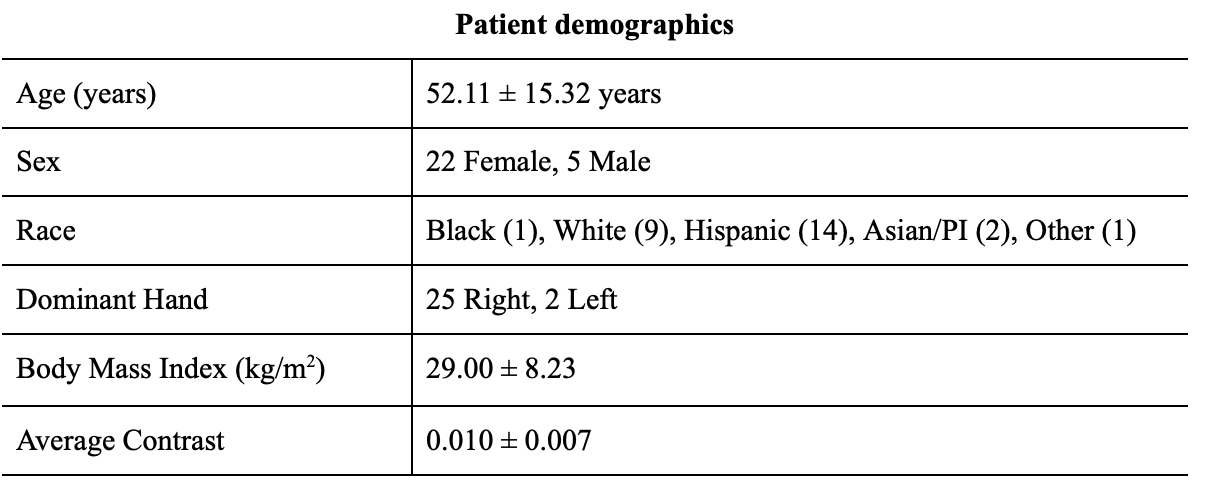
Dataset: A dataset comprising 58 wrist MRI studies from 27 unique subjects scanned at three different time intervals: Baseline, 3 months and 1 year follow-up was used in this study. Summary of the demographics are reported in Table 1. Imaging data were acquired on a 3.0T MR scanner (GE Medical Systems, Milwaukee, WI) with an 8-channel phased array wrist coil1. The scan parameters were4: coronal view, FOV = 12×9 cm2, TR/TE = 11.1/2.5 ms, FA = 20°, BW = ± 62.5 kHz, image matrix = 384×288, 28~32 slices, spatial resolution = 0.3×0.3×1.5 mm2. The scan time before contrast injection was ~100s, immediately followed by the dynamic contrast enhanced acquisition (~400 s) with a 40 s injection delay (Gd-DTPA, 0.2mmol/kg). MRI frames of the dynamic acquisition were registered to a common frame of reference to ensure voxel based correspondence in the data, by using the elastix registration toolbox. This work leverages the time series nature of the acquisitions at disposal, and aims to predict Gd-DTPA induced contrast MRI (i.e. last frame in the acquired dynamic MRI) from the pre-contrast MRI (i.e. first frame in the acquired dynamic MRI).Data preparation: Subjects were split into 21/3/3 train/val/test sets for a total of 1764/252/252 slices. Data splitting was done controlling for Body Mass Index (BMI), age, and sex statistical independence across the splits. Before training, each training, test and validation image was normalized by the maximum of each original parent 3-D image and confirmed each value in the matrix greater than 0.
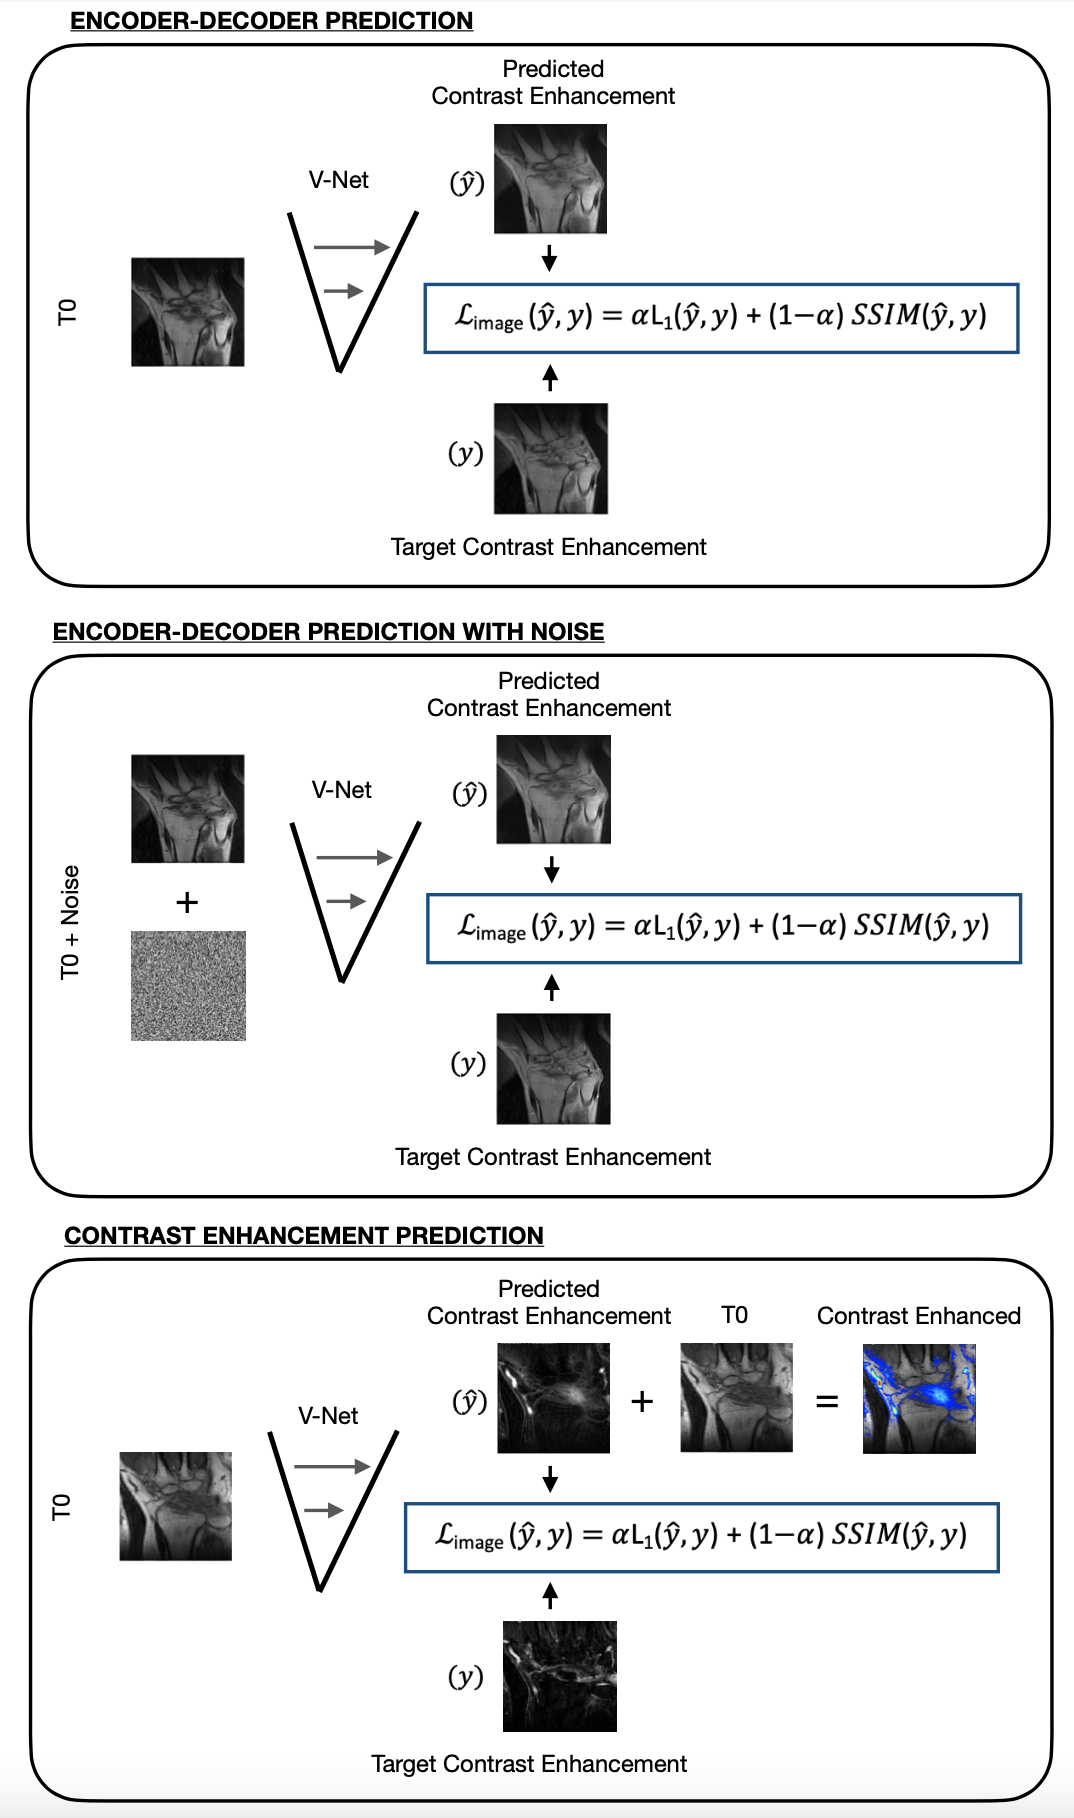
Deep Learning Model: To predict Gd-DTPA induced contrast MRI, inspired by recent work5, we tested three 2D approaches based on a modified V-Net. In the first, the model receives a pre-contrast MRI as input, and it outputs the induced contrast image. We refer to this model with “enc-dec”. In the second approach, the input is corrupted with white noise (mu=0, var=0.03), prior to being inputted in the V-Net. We refer to this model with “denoiser”. In the third approach, the network directly predicts a tissue contrast intake map. We refer to this model with “delta-contrast” (Figure 2). Set hyperparameters included batch size=8, dropout rate=0.05, learning rate= 1x10⁻⁵ and early-stopping.
Models Evaluation: For each network, two sets of experiments involving the usage of a different loss function, such as mean-squared error (MSE), or a combination of mean-absolute error (MAE) and structural similarity index metric (SSIM) loss, were conducted. Evaluation was done in terms of SSIM between actual and predicted post-contrast MRI.
Results
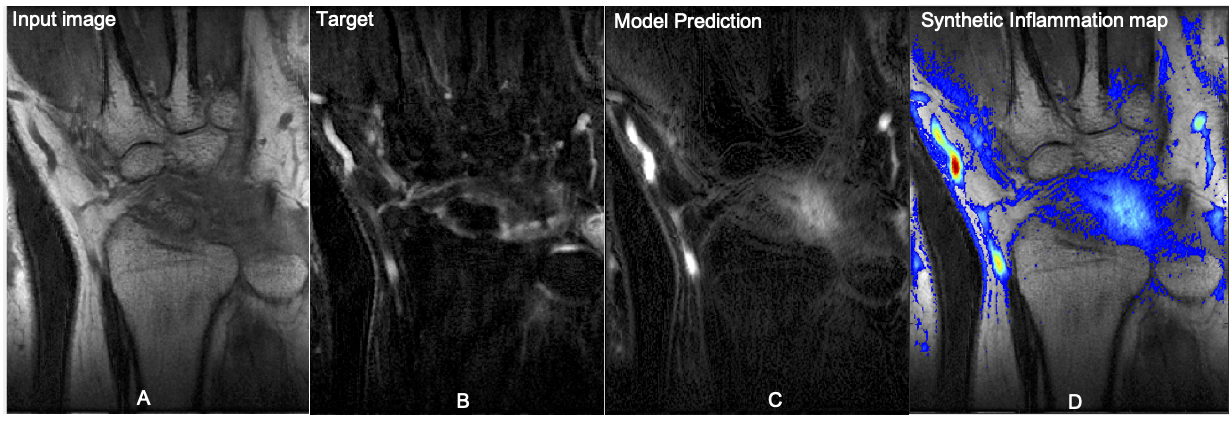
For the encoder decoder approach, the SSIM value between the predicted and expected output images was 0.6052 when using the combined loss function and 0.5492 when using just MSE loss. The same model trained as a denoiser obtained a SSIM equal to 0.5308 and 0.5061 when trained with MSE or both MAE and SSIM combined loss respectively. The best results were obtained by the model that predicted the difference between pre and post contrast images. The model trained with SSIM and MAE loss function obtained a SSIM equal to 0.6900. For the contrast difference experiment with MSE loss function, the average SSIM of 0.7130 was obtained in the validation set. Just the best model was inferred on the test set, obtaining an average SSIM of 0.5965. Figure 3 shows an example of the best model input, output and prediction in a test subject. The overlay in Figure 3D highlights inflammation to be used by radiologists as a guide during their image reading.Discussion
We attempted for the first time a synthetic generation of post contrast imaging from pre contrast in RA subjects. While the results are preliminary and model improvements are needed for a more fine detailed simulation of CE imaging, our findings suggest that the model correctly identifies location of tissue that will enhance with contrast from pre-contrast wrist MRI images. Although fine details are not captured we argue this is a useful tool to guide image readings. It is worth noting that the eterogenty of contrast location is much higher in this use case than oncological applications where the contrast is expected in the tumor area.Acknowledgements
This work was supported by the NIH R01AR078762 grant.References
1 Mathur M, Jones JR, Weinreb JC. Gadolinium Deposition and Nephrogenic Systemic Fibrosis: A Radiologist's Primer. Radiographics. 2020 Jan-Feb;40(1):153-162. doi: 10.1148/rg.2020190110. Epub 2019 Dec 6. PMID: 31809230.2
2 Murata N, Murata K, Gonzalez-Cuyar LF, Maravilla KR. Gadolinium tissue deposition in brain and bone. Magn Reson Imaging. 2016 Dec;34(10):1359-1365. doi: 10.1016/j.mri.2016.08.025. Epub 2016 Oct 5. PMID: 27720805.
3 Calabrese, E., Rudie, J. D., Rauschecker, A. M., Villanueva-Meyer, J. E., & Cha, S. (2021). Feasibility of Simulated Postcontrast MRI of Glioblastomas and Lower Grade Gliomas Using 3D Fully Convolutional Neural Networks. Radiology: Artificial Intelligence, e200276.
4 Liu, J., Pedoia, V., Heilmeier, U., Ku, E., Su, F., Khanna, S., ... & Li, X. (2016). High‐temporospatial‐resolution dynamic contrast‐enhanced (DCE) wrist MRI with variable‐density pseudo‐random circular Cartesian undersampling (CIRCUS) acquisition: evaluation of perfusion in rheumatoid arthritis patients. NMR in Biomedicine, 29(1), 15-23.
5 Caliva, Francesco, Alejandro Morales Martinez, Sharmila Majumdar, and Valentina Pedoia. "Virtual Bone Shape Aging." In Medical Imaging with Deep Learning. 2021.
Figures