0089
Evaluation of BAV Disease in Preserved Ejection Fraction: New Insight from Intra-Cardiac Pressure Drop1University of Calgary, Calgary, AB, Canada
Synopsis
We aimed to detect the reliability of flow component analysis and intra-cardiac pressure drop analysis in the bicuspid aortic valve (BAV)-induced regurgitation cases compared to age-matched healthy control in the preserved ejection fraction (EF). Flow component analysis did not show differences while intra-cardiac pressure drop differentiated groups.
Introduction
Bicuspid aortic valve (BAV), as a common congenital valvular disease, is an enigmatic condition that can cause a variety of disorders in different age groups1,2. Many cardiac abnormalities are associated with hemodynamic alteration, and BAV is not an exception3. Recently, time-resolved three-dimensional (3D) phase-contrast magnetic resonance imaging (4D-flow MRI), among various diagnostic techniques, have massively enhanced the understanding of multifaceted and pulsatile flow within the heart and mediastinal vessels by uncovering and characterizing different flow parameters and advanced flow biomarkers (wall shear stress, turbulent kinetic energy, and pressure drop)4,5. BAV-induced impairment on the left ventricle as a hardworking cardiac chamber needs additional attention6. In this study, we aimed to 1) assess the left ventricular flow components during the cardiac cycle (Global measurement), 2) analyze left-sided pressure drop (Local measurement) to differentiate BAV cohorts with regurgitation and age-matched controls. Hence, we hypothesize that both intracardiac 4D flow parameters and pressure drop can identify abnormal left ventricular workflow in BAV patients with regurgitation.Methods
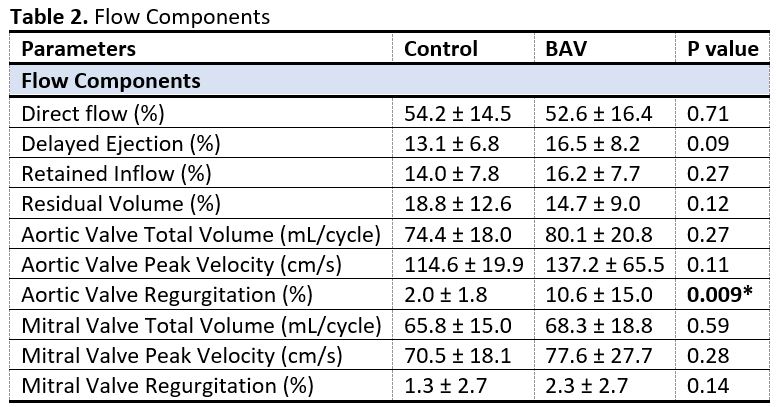
We randomly have retrieved 48 BAV patients (age=41.7 ± 13.1, female=17) and 22 age-matched controls (age=39.1 ± 14.4, female=7) retrospectively. The clinical characteristics and the left ventricular functions of BAV and control cohorts have been provided in Table 1. MRI was performed using 3T MRI scanners (Skyra, Prisma, Siemens, Erlangen, Germany). All subjects underwent a standardized imaging protocol, including retrospectively electrocardiogram-gated, time-resolved balanced steady-state free precession cine imaging in 4-chamber, 3-chamber, 2-chamber, and short-axis views of the left ventricle (LV) at end-expiration. Moreover, a contrast-enhanced phase-contrast magnetic resonance angiography (PC-MRA) was acquired. Finally, 4D flow MRI was performed using retrospective electrocardiogram-gated for comprehensive intracardiac 3D in vivo flow assessment and the parameters were set as follows: velocity encoding range (venc) = 150–200 cm/s, FA = 15°, spatial resolution = 2.0–3.6 x 2.0–3.0 x 2.5–3.5 mm3, temporal resolution = 25–35 ms, phases = 30. The cvi42 v5.11 (Circle Cardiovascular Imaging Inc., Calgary, Canada) was used to analyze individuals' 4D flow MRI acquisitions regarding the left ventricular flow components and left-sided pressure drop. Segmentation, contouring, and plane setting were achieved semiautomatically. The workflows have been shown in Figure1 for both analyses.Flow components:
The four components of the left ventricular flow (direct flow, retained inflow, delayed ejection and residual volume) and aortic and mitral valves total volume and peak velocity acquired throughout the cardiac cycle.
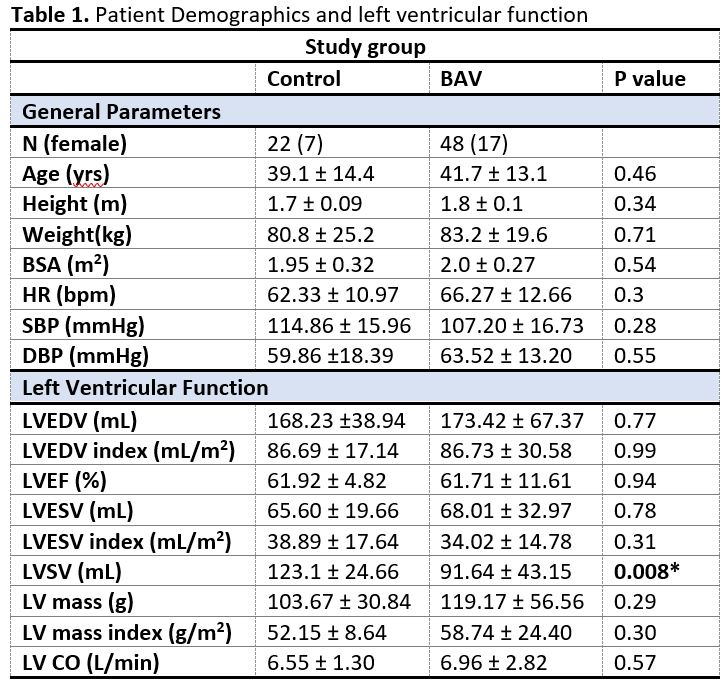
Pressure analysis:
PC-MRA acquisitions were used for left atrium (LA) and left ventricle (LV) 3D segmentation. Five planes, including a reference, were positioned at the segmented LA and LV as follows: upper part of the LA (reference plane), left atrium mid, mitral valve, left ventricle mid, left ventricle apex. For each plane, the maximum and average pressure as well as pressure at four cardiac time points, including peak systole, end systole, E-wave, and A-wave, were measured.
Statistical analyses were conducted using IBM SPSS (Version 27). An unpaired two-tailed equal variance student t-test was used to detect any significant difference between BAV and control subjects. P-values less than 0.05 are considered statistically significant.
Results
Based on Table 1, the ejection fraction (EF) for both groups was the same, within the normal range. The p-values (p > 0.05) of Table 2 show that LV flow components (global measurement) in BAV and control groups were not significantly distinguishable.Regarding pressure at four user-defined planes, the maximum pressure at the mitral valve, left ventricle mid, left ventricle apex planes were significantly different between BAV and control groups (p= 0.01, p= 0.04, and p = 0.03; respectively). The mean pressure difference was also significant at E-wave (-0.63±0.8 mmHg vs. -1.29±1.1 mmHg, p = 0.01) and A-wave (-0.42±0.4 mmHg vs. -0.92±0.6 mmHg, p = 0.001) for mitral valve plane. In addition, there was a remarkable difference for left ventricle midplane mean pressure at the A-wave timepoint (-0.28±0.4 mmHg vs. -0.68±0.8 mmHg, p = 0.03). Consequently, we could differentiate BAV with regurgitation and control groups by measuring local pressure (Table 3).
Discussion
The important role of flow components and pressure abnormalities in cardiac failure has been shown in recent studies7,8. We found out that while there is some degree of LV dysfunction in the BAV cohorts, flow component parameters cannot identify it when EF is preserved. The reason is that flow components and EF are both global measurements. This means that the first part of our hypothesis is rejected. On the other hand, the pressure analysis can reveal some local differences and identify diastolic dysfunction in the BAV patients with preserved EF, which confirms the second part of our hypothesis. Regarding the limitations of this study, future cross-sectional studies with more subjects and classified BAV regurgitation severity are required.Conclusion
The findings of this study propose that pressure (local measurement) is a more reliable parameter compared to flow components to prognose left ventricular dysfunction in the BAV related regurgitation cases with preserved EF. The findings have a beneficial effect on patient risk stratification and better disease management.Acknowledgements
No acknowledgement found.References
1. Michelena, H. I. et al. International consensus statement on nomenclature and classification of the congenital bicuspid aortic valve and its aortopathy, for clinical, surgical, interventional and research purposes. European Journal of Cardio-Thoracic Surgery 60, 448–476 (2021).Figures
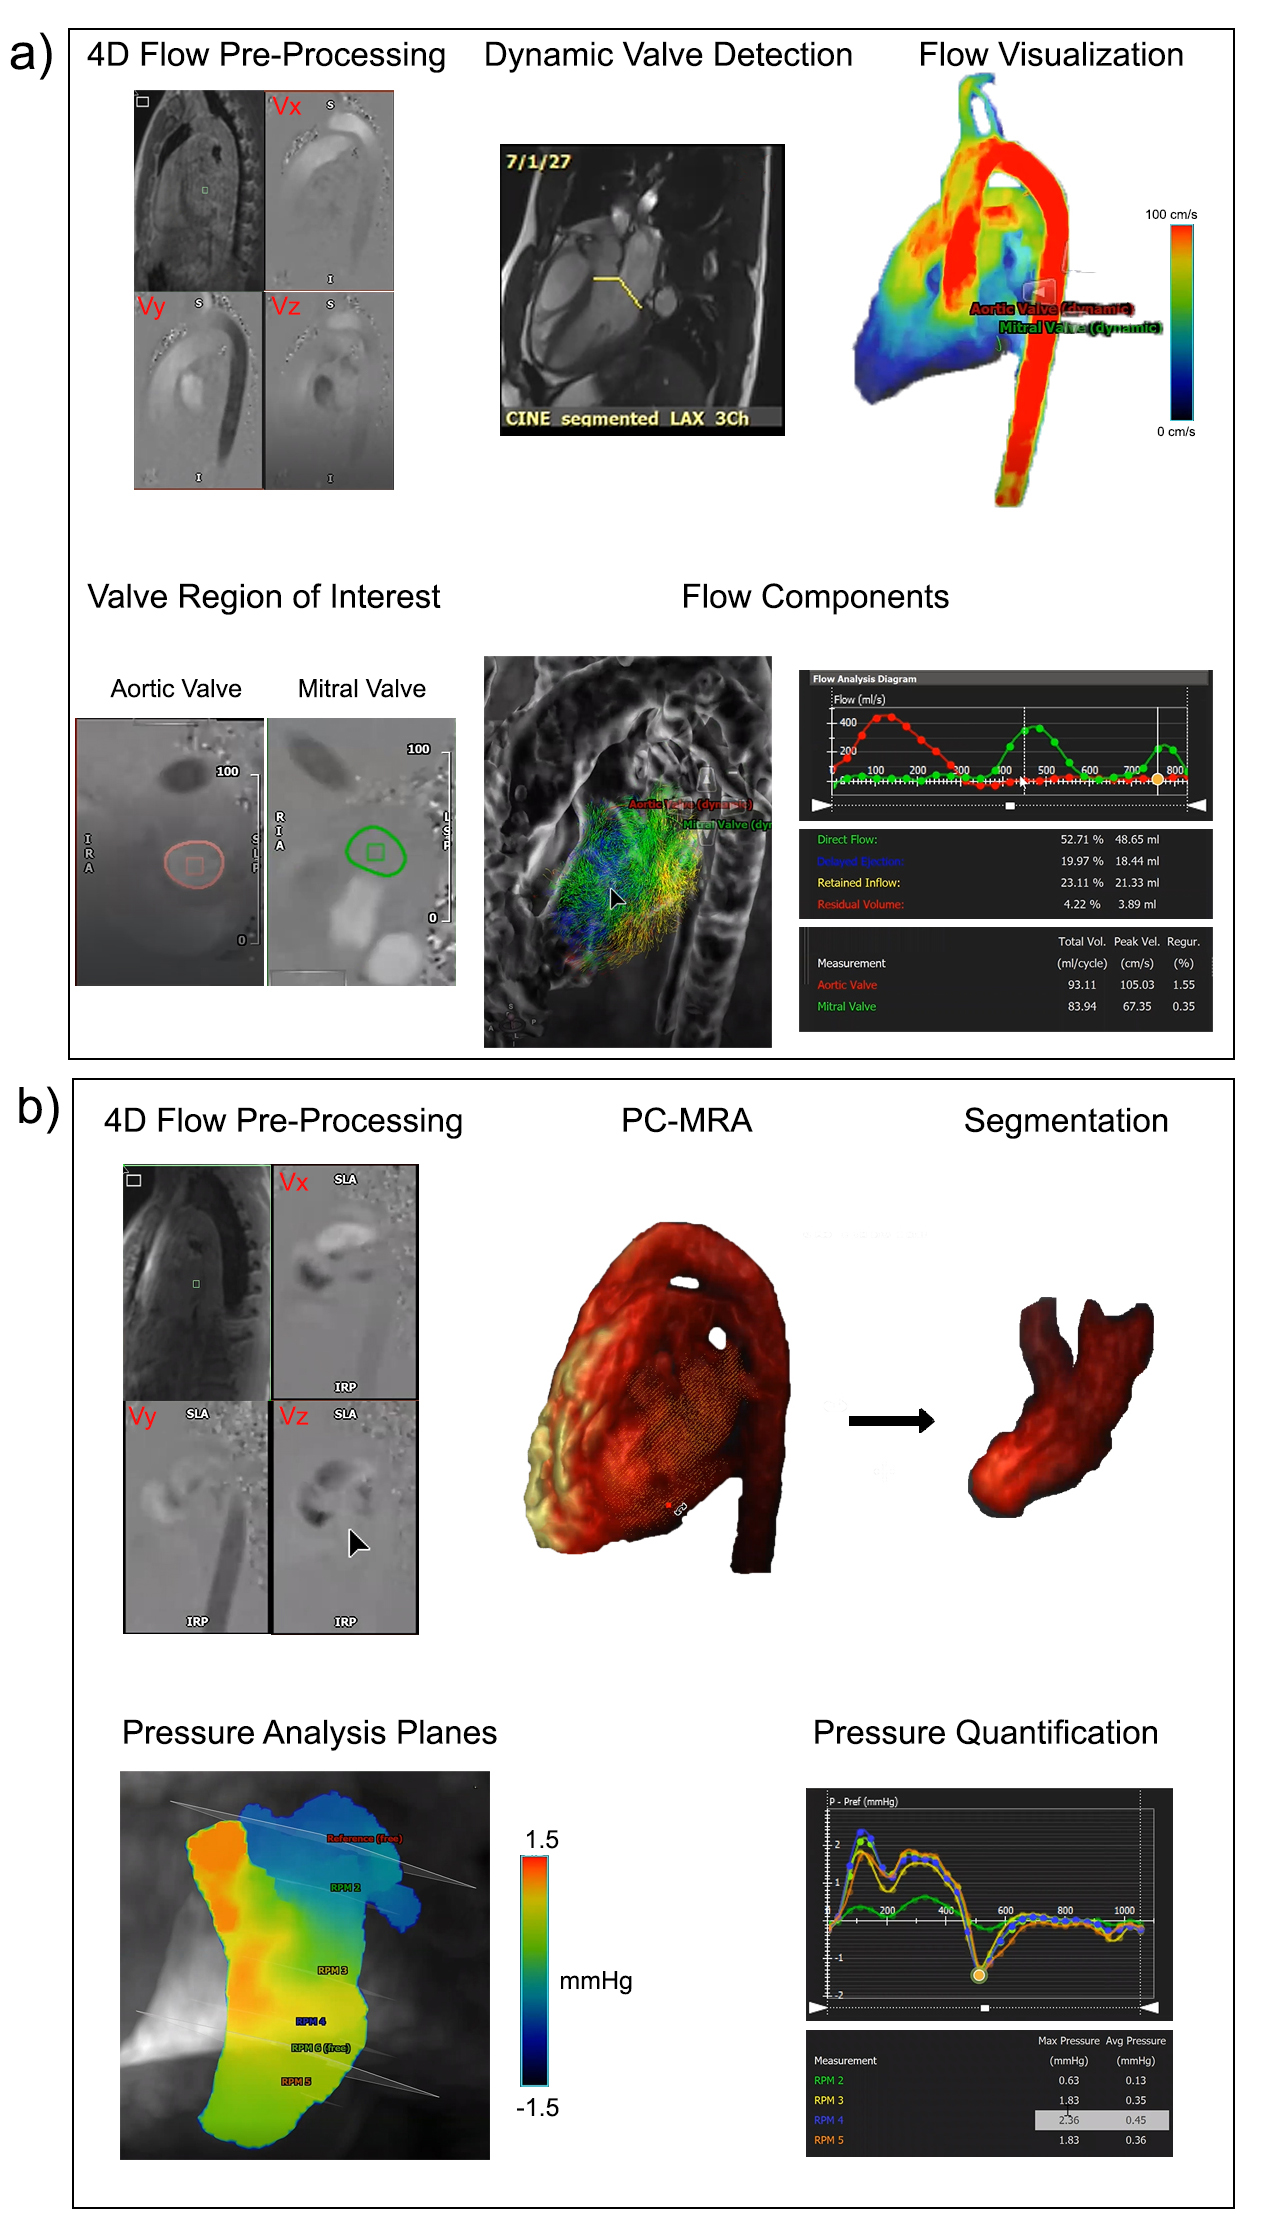
Figure 1. Workflow: a) Flow component analysis, b) Pressure analysis
BSA stands for body surface area; HR, heart rate; SBP, systolic blood pressure; DBP, diastolic blood pressure; LVEDV, left ventricular end diastolic volume; LVSV, LVEF, left ventricular ejection fraction; LVESV, left ventricular end systolic volume; SV, stroke volume; CO, cardiac output, values are shown as mean ± standard deviation
Unpaired two-tailed equal variance student t-test (*Significant for P < 0.05)
Unpaired two-tailed equal variance student t-test (*Significant for P < 0.05)

Unpaired two-tailed equal variance student t-test (*Significant for P < 0.05)