0088
In Vitro 4D Flow MRI for the Analysis of Aortic Coarctation
James Rice1,2, Labib Shahid1,2, Haben Berhane3,4, Cynthia K Rigsby5, Joshua D Robinson5, Lindsay M Griffin5, Michael Markl3,4, and Alejandro Roldan-Alzate1,2
1Mechanical Engineering, University of Wisconsin-Madison, Madison, WI, United States, 2Radiology, University of Wisconsin-Madison, Madison, WI, United States, 3Radiology, Northwestern University Feinberg School of Medicine, Chicago, IL, United States, 4Biomedical Engineering, Northwestern University, Evanston, IL, United States, 5Medical Imaging, Lurie Children's Hospital of Chicago, Chicago, IL, United States
1Mechanical Engineering, University of Wisconsin-Madison, Madison, WI, United States, 2Radiology, University of Wisconsin-Madison, Madison, WI, United States, 3Radiology, Northwestern University Feinberg School of Medicine, Chicago, IL, United States, 4Biomedical Engineering, Northwestern University, Evanston, IL, United States, 5Medical Imaging, Lurie Children's Hospital of Chicago, Chicago, IL, United States
Synopsis
4D flow MRI can be used to assess aortic coarctation (COA) repair hemodynamics in-vivo, however, challenges arise depending on hemodynamics and clinical presentation. This study presents a modeling pipeline for in-vitro COA hemodynamic assessment. Three patient-specific in-vitro models were created representing pre- and post-repair COA geometries, connected to a pulsatile flow loop, and imaged with 4D flow MRI to assess model hemodynamics. In all cases, aortic flow profiles are shown to improve after intervention. This agrees with clinical expectation, suggesting in-vitro 4D flow MRI can be used to analyze COA hemodynamics.
Introduction
Coarctation of the aorta (COA) is a common congenital heart defects (5-8%), presenting as narrowing of the proximal descending aorta1. COA can be discrete or complex and associated with severe secondary complications such as diffuse arch hypoplasia and descending aortic aneurysm. The most common therapy is intervention to restore normal aortic blood flow thus, understanding pre- and post-interventional COA hemodynamics is crucial1-4. 4D flow MRI shows promise in assessing 3D aortic hemodynamics in patients with COA2-3. However, 4D flow MRI data are acquired with velocity encoding sensitivity (Venc), set above the maximum expected velocity. High Venc is necessary to capture high velocity regions without aliasing, like in the stenosis in COA. However, noise in velocity measurements is directly proportional to Venc and increasing results in low velocities indistinguishable from noise, like in an aortic aneurysm (slow vortex flow)4-5. This complicates measurements in complex flow regimes. Pulsatile in-vitro models allow systematic evaluation of 4D flow performance by providing a way to produce anatomically realistic geometries and physiological flow that can be analyzed with higher resolution flow methods6-7. The goal of this study was develop an accurate and reproducible framework using in-vitro modeling and 4D flow MRI to evaluate pre- and post-intervention COA anatomies and hemodynamics.Methods
In this HIPAA compliant study, three pediatric patients underwent standard-of-care cardiothoracic MRI pre- and post-COA repair following an IRB approved protocol (Table 1). MR imaging included aortic 4D flow MRI and 3D contrast enhanced (CE)-MR angiography (MRA), which was used to segment aortic geometries and construct two in-vitro, patient-specific models using additive manufacturing (Figure 1)8. The models were connected to a pulsatile flow circuit and scanned on a 3.0T MRI scanner (Signa Premier, GE). 3D flow dynamics were measured using the 4D flow MRI sequence PC-VIPR9. Scan parameters were 1.3mm isotropic spatial resolution, TR = 6.1ms, flip angle = 8°, 320mm FOV, and 160 velocity encoding. Heart rate was controlled to 60 beats/min and 35% systolic cardiac waveform was prescribed resulting in mean aortic flow of 2.0 liters/min. ECG gating was achieved via signal output from the pump. A blood-mimicking solution of water and glycerol (42:58 by weight) was used in the flow loop.Results
Study cohort demographic information is outlined in Table 1. The cohort included three patients (mean age 10 ± 4 years) with a median follow-up duration of 5 ± 3 years (2 males). Figures 2-4 depict the 4D flow MRI data obtained in pre- and post-intervention cases for patients 1-3, respectively. For patients 1 and 2, high velocity jets extending into the descending aorta are observed in pre-interventional models in the COA location. For both patients, it is evident that COA-interventions reduced peak velocity at the site of the repair. Similar consistencies are seen in the flow maps depicted for patient 3 in Figure 4, which shows improvement in flow profiles between pre- and post-cases despite prior stenting, suggesting re-intervention improved aortic hemodynamics. For patient 1, full-field flow visualization is achieved in the pre-repair aortic aneurysm, which is not available in the in-vivo dataset (Figure 2). The same is true for the stented region in patient 3, where in-vitro flow information fills the void seen in the in-vivo flow map (Figure 4). Pre- and post-repair peak velocities at the location of the coarctation and results of volumetric flow analysis are summarized in Table 1.Discussion
This study utilized patient-specific, in-vitro models and 4D flow MRI for hemodynamic analysis of different presentations of COA. In cases where narrowing is observed (patient 1 and 2), velocities in the stenosis are shown to reduce after intervention. This agrees with clinical expectation, suggesting in-vitro modeling can potentially shed light on the effect of surgical intervention on post-repair COA hemodynamics. Imposing the same inlet flowrate induced similar model inflow conditions for comparison of the effect of presentation on COA hemodynamics. It is noted that this does not reflect in-vivo flow conditions. Comparisons to in-vivo 4D flow MRI datasets are necessary and prescribing patient-specific inflow rates must be carried out in the future. Another aspect of interest is the ability to analyze flow in regions potentially inaccessible in in-vivo MR imaging: areas that contain both high and low velocity flow (patient 1, aortic aneurysm) and regions that have high susceptibility to MRI artifact (patient 3, stent). This is seen in the flow fields for patient 1 and 3, respectively. These results hint that in-vitro modeling can be used in other cases where flow information is lost due to a high Venc setting or medical device influence. Results from the volumetric flow analysis yielded an average difference between inlet flow and outflow of 8.95%, agreeing previously published studies validating the consistency of 4D flow MRI10.Conclusion
This study showed in-vitro modeling capabilities for three different presentations of COA utilizing patient-specific, MRI-compatible models of COA anatomy pre- and post-intervention. 4D flow MRI successfully uncovered aortic hemodynamics. Robust comparison to in-vivo datasets are needed, but the in-vitro approach enhanced visualization in problematic flow regions, highlighting one benefit of using this framework to model COA. Use of in-vitro models for COA hemodynamic assessment using 4D flow MRI could enhance surgical planning and predictive capabilities.Acknowledgements
The authors acknowledge grant support by American Heart Association (AHA) 19TPA34850066 and GE Healthcare, which provides research support to the University of Wisconsin-Madison.References
- Rao P. Coarctation of the aorta. Curr Cardiol Rep. 2005;7(6):425-434. doi: 10.1007/s11886-005-0060-0.
- Hope M, Meadows A, Hope T, et al. Clinical evaluation of aortic coarctation with 4D flow MR imaging. J Magn Reson Imaging. 2005;31(3):711-718. doi: 10.1002/jmri.22083.
- Frydrychowicz, A, Alex MD, Markl, M, et al. Aortic hemodynamics in patients with and without repair of aortic coarctation. Investigative Radiology. 2011;46(5):317-325. doi: 10.1097/RLI.0b013e3182034fc2.
- Dyverfeldt P, Bissell, M, Barker J, et al. 4D flow cardiovascular magnetic resonance consensus statement. J Cardiovasc Magn Reson. 2015;17(72). doi:10.1186/s12968-015-0174-5.
- Markl M, Fridaychowicz A, Kozerke S, et al. 4D flow MRI. J Magn Reson Imaging. 2012;36(5):1015-1036. doi: 10.1002/jmri.23632.
- Rutkowski D, Medero R, Ruesink T, et al. Modeling physiological flow in Fontan models with four-dimensional flow magnetic resonance imaging, particle image velocimetry, and arterial spin labeling. J Biomech Eng. 2019;141(12):121004. doi: 10.1115/1.4045110.
- Medero R, Ruedinger K, Rutkowski D, et al. In vitro assessment of flow variability in an intercranial aneurysm model using 4D flow MRI and tomographic PIV. Ann Biomech Eng. 2020;48:2484-2493. doi: 10.1007/s10439-020-02543-8.
- Ruedinger K, Medero R, Roldán-Alzate A. Fabrication of Low-Cost Patient-Specific Vascular Models for Particle Image Velocimetry. Cardiovasc Eng Tech. 2019;10(3):500-507. doing: 10.1007/s13239-019-00417-2.
- Johnson K, Lum D, Turski P, et al. Improved 3D phase contrast MRI with off-resonance corrected dual echo VIPR. Magn Reson Med 2008; 60(6):1329-1336. doi: 10.1002/mrm.21763.
- Roldán-Alzate, A, Frydrychowicz A, Niespodzany E, et al. In vivo validation of 4D flow MRI for assessing the hemodynamics of portal hypertension. J Magn Reson Imaging. 2013;37(5):1100-8. doi: 10.1002/jmri.23906.
Figures
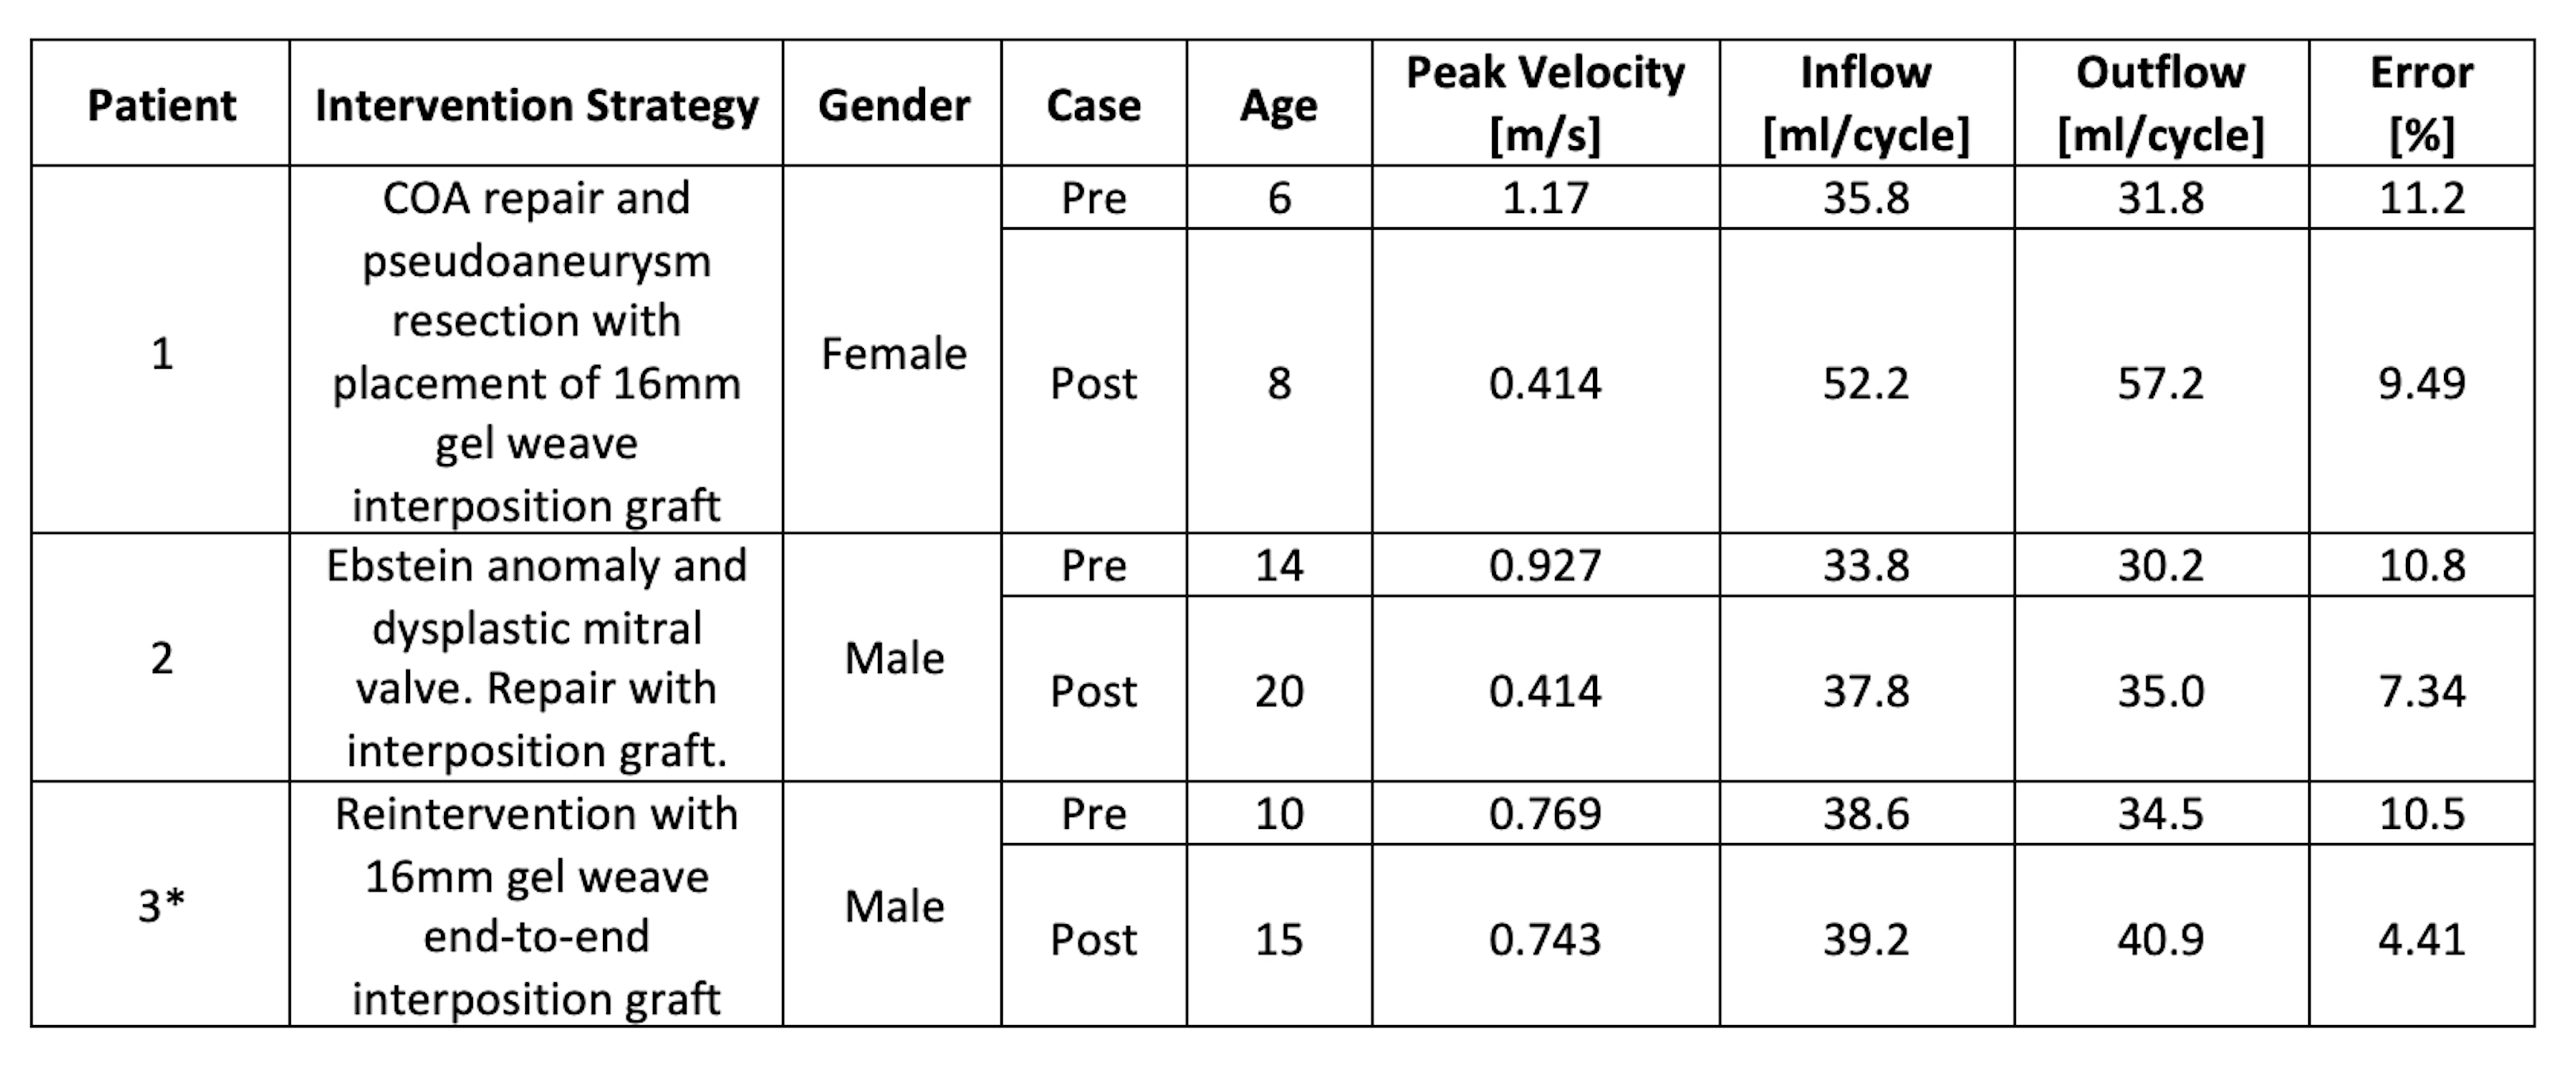
Table 1: Demographic and intervention procedure information for patient cohort used to generate patient-specific, in-vitro models, 4D Flow MRI obtained peak velocities pre- and post-intervention, and results from volume flow analysis for validation of 4D flow MRI data (* indicates patient underwent reintervention for COA).
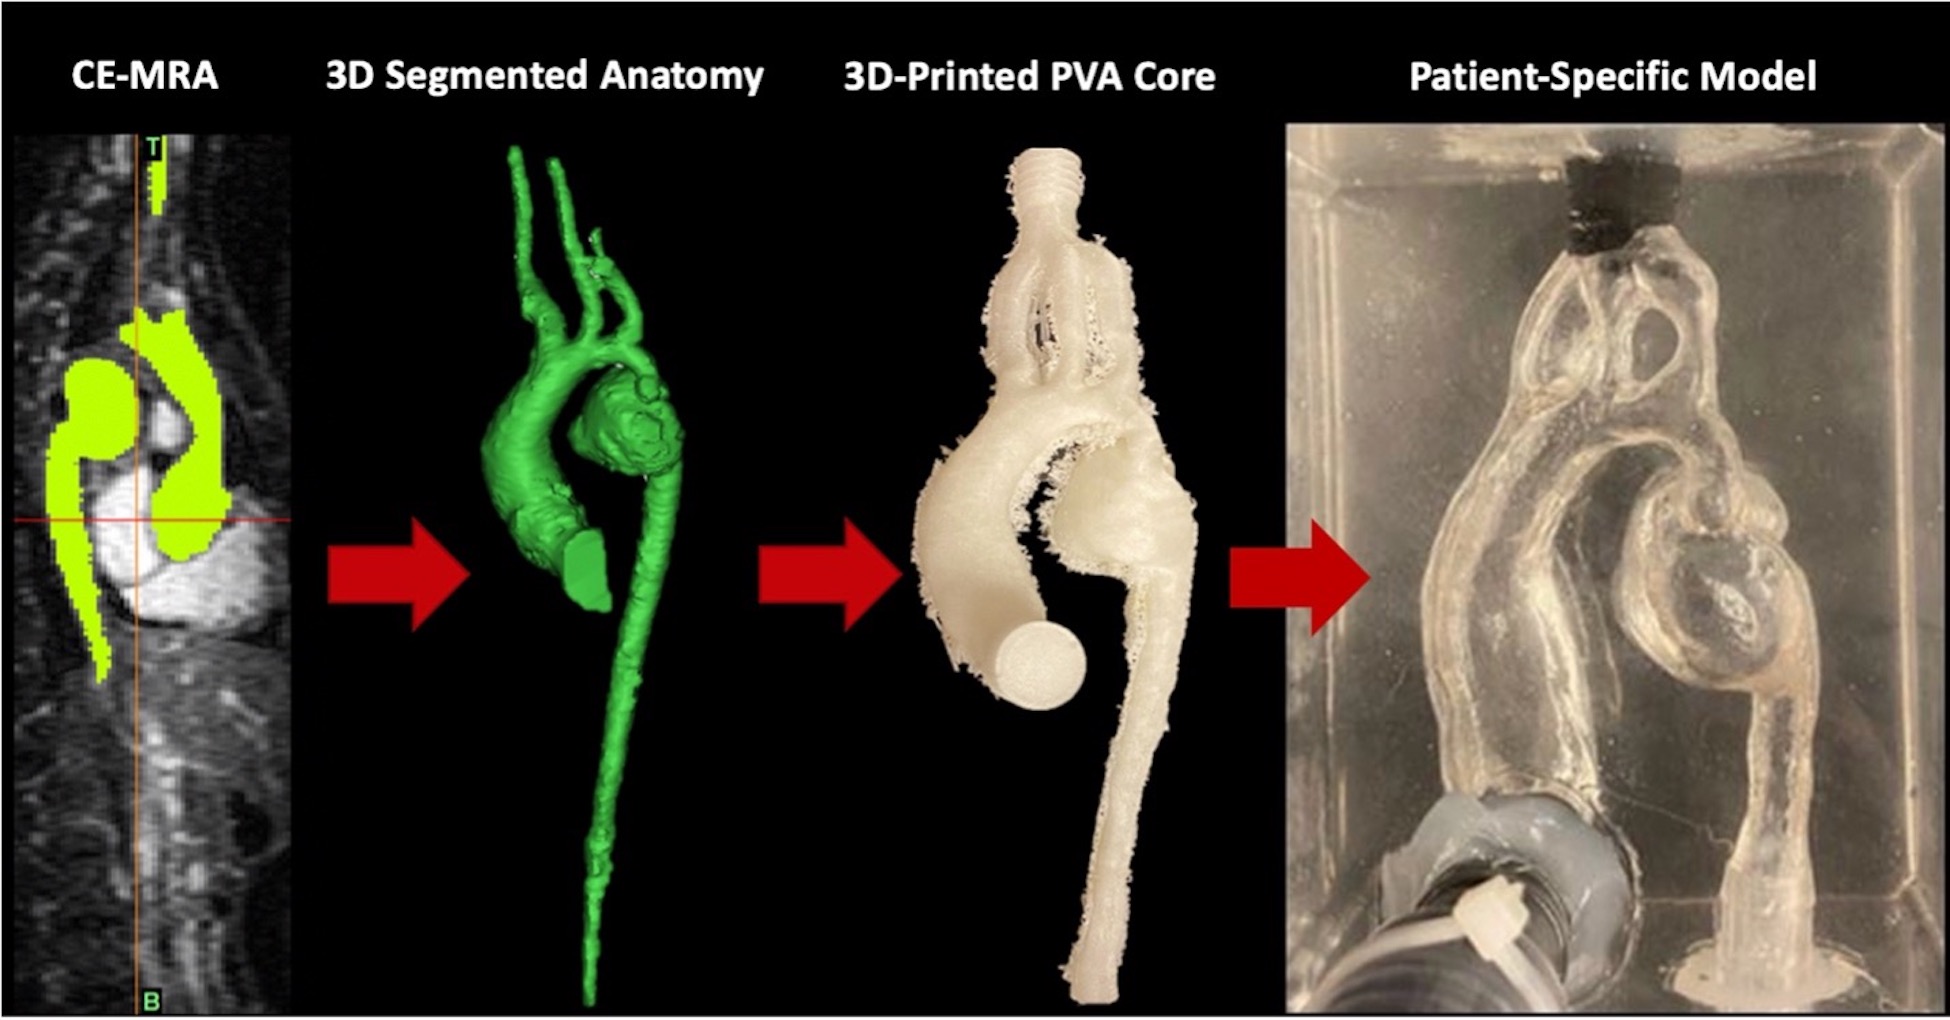
Figure 1: Pipeline for constructing patient-specific, MRI compatible in vitro flow models. From left-to-right: CE-MRA pre-intervention COA dataset. Raw 3D segmentation of aortic geometry that is altered to enhance compatibility with pulsatile flow loop. 3D printed PVA aortic geometry serves as the model cavity. PVA core is cast in a silicone block where it is allowed to fully cure and then the core is dissolved with water producing patient-specific pre-intervention COA flow cavity inside the clear silicone block and connectors are placed at the inlet and outlets of the model.

Figure 2: Comparison of pre- (left) and post-repair (right) in-vitro model flow fields derived from 4D flow MRI acquisitions for Patient 1. Flow curve portrays inlet flow conditions during the cardiac cycle. Highlighted is a comparison of the in-vitro and in-vivo flow profiles in the aneurysm region of the descending aorta. Slow flow circulation is not seen in the in-vivo dataset due to velocities lost due to noise. This information is clearly recovered in the case of the in-vitro model.
Figure 3: Comparison of pre- (left) and post-repair (right) in-vitro model flow fields derived from 4D flow MRI acquisitions for patient 2. Flow curve portrays inlet flow conditions during the cardiac cycle. High velocity jet resulting from COA observed in pre-repair case is relieved with post-repair anatomy.
Figure 4: Comparison of pre- (left) and post-repair (right) in-vitro model flow fields derived from 4D flow MRI acquisitions for Patient 3. Flow curve portrays inlet flow conditions during the cardiac cycle. Highlighted is a comparison of the in-vitro and in-vivo flow profiles in the stented location. Clear signal loss is observed in the in-vivo dataset, while enhanced visualization in stented region is achieved in the in-vitro model.
DOI: https://doi.org/10.58530/2022/0088