0086
Characterization of Pulmonary Flow Hemodynamic Patterns in Patients with repaired Tetralogy of Fallot using 4D Flow MRI1University of Calgary, Calgary, AB, Canada, 2Alberta Children's Hospital Research Institute, Calgary, AB, Canada, 3Libin Cardiovascular Institute, Calgary, AB, Canada
Synopsis
Tetralogy of Fallot (TOF) occurs in 1 in 3,500 births and is the most common cyanotic congenital heart defect. Patients with repaired TOF (rTOF) require constant monitoring to prevent life-threatening adverse effects. Hence, this study used 4D Flow MRI to assess pulmonary flow hemodynamics in patients with rTOF. All hemodynamic parameters calculated along the main pulmonary were shown to be higher in patients compared to controls.
Background
Tetralogy of Fallot (TOF) is the most common form of cyanotic (“blue baby”) Congenital Heart Disease (CHD), occurring in 4 of every 10,000 live births and accounts for ~10% of all CHD1. Current surgical techniques allow patients with TOF to survive until adulthood1. However, these patients require multiple repeat surgeries and procedures over their lifetime but the hemodynamic factors contributing to the optimal quality of life and outcomes are understudied and poorly understood2. Hence, the objective of this study was to use 4D Flow MRI to assess pulmonary flow hemodynamics in patients with repaired TOF (rTOF) to better identify and characterize altered hemodynamic patterns to assist with future interventions. We hypothesize patients with rTOF and those with main pulmonary artery (mPA) dilation will have higher Peak Velocity (PV), Wall Shear Stress (WSS), Energy Loss (EL), and Pressure drop as compared to non-dilated and controls.Methods
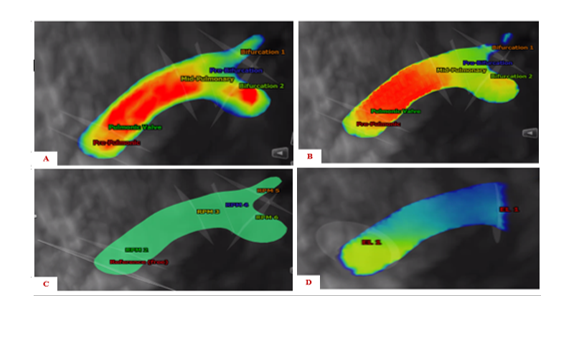
A total of 17 rTOF patients (29 ± 9 years, 35% women) and 20 controls (36 ± 12 years, 25% women) were enrolled in this study. Both controls and patients underwent standard cardiac MRI followed by 4D Flow MRI acquisition. 4D Flow MRI acquisition parameters included the following: temporal resolution 44.0-48.0 ms, spatial resolution 2.5-3.9×2.0–3.1×3.0–3.5 mm3, echo time = 2.85-3.24 ms, flip angle = 15°, Venc = 150-450 cm/s, matrix 130-160×110–160, pulse repetition time = 5.50-6.00 ms, bandwidth 490 pixel/MHz, FOV 240-400×320–400 mm2, and time frames per cardiac cycle = 12-20. Figure 1 demonstrates the workflow of the analysis that was performed using CVI42 (Circle Cardiovascular Imaging, Calgary, AB, Canada). First, the main pulmonary artery along with the left and right bifurcations were segmented. Followed by placing analysis planes perpendicular to the flow of interest. Flow visualization and quantitative flow analysis was performed at each plane shown in Figure 1 as well. Hemodynamic parameters that were calculated included PV, WSS, EL, and Pressure drop3. Diameters of the mPA for both cohorts were calculated using RadiAnt DICOM Viewer (Medixant, Poznan, Poland). This data was compared to a standard mPA diameter of 25.7 mm and both cohorts were categorized into two groups including dilated mPA diameters and non-dilated mPA diameters4. Statistics on the data collected were calculated using SPSS (IBM, Chicago, IL). First, an independent-samples t-test was used to compare the hemodynamic parameter along with identifying significant differences between controls and patients. Values of p < 0.05 were considered significant. This was followed by computing the Pearson correlation for each hemodynamic parameter along the mPA and mPA diameter. Values of p < 0.01 were considered significant.Results
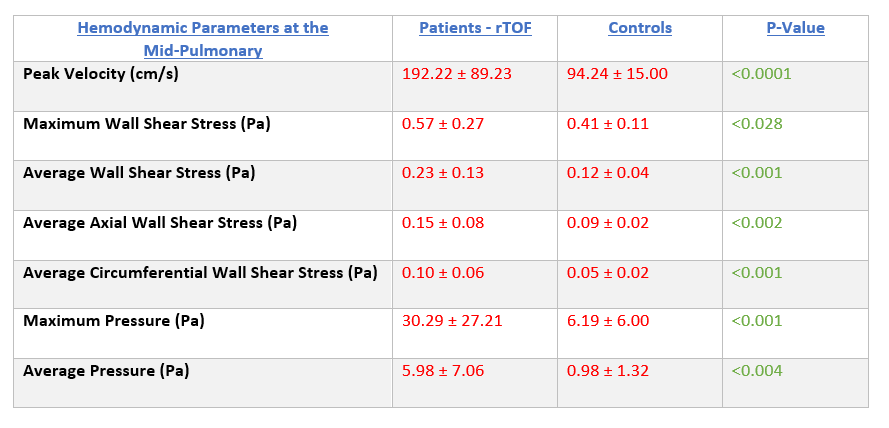
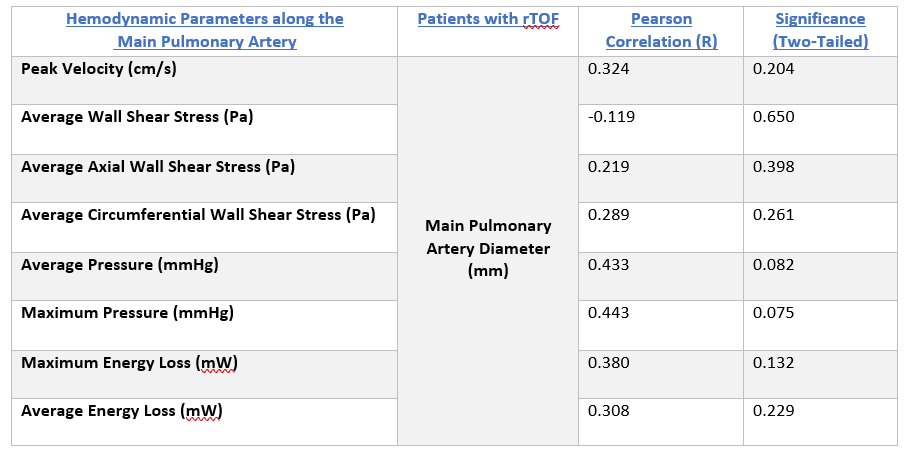
The hemodynamic parameters that were calculated in this study at the mid-pulmonary were shown to be higher in patients compared to controls (p<0.05) as shown in Table 1. However, the correlation between the mPA diameter and abnormal hemodynamics present along the mPA in patients with rTOF was not shown to be statistically significant as shown in Table 2. Maximum pressure along the mPA was shown to be highly correlated with pulmonary diameter in patients with rTOF (R = 0.443, P = 0.0075) as demonstrated in Table 2. While average WSS along the mPA was shown to be negatively correlated with pulmonary diameter in patients (R = -0.119, P = 0.650) as seen in Table 2 as well. Lastly, patients demonstrated a higher mPA diameter compared to controls (Average Mean = 34.11mm vs. Average Mean = 23.95 mm, p<0.05).Conclusion
In conclusion, this study unveiled abnormal pulmonary blood flow in patients with rTOF demonstrating increased PV, WSS, EL, and Pressure drop along the mPA. However, a high correlation was not observed between the diameter of the mPA and pulmonary hemodynamic parameters observed in patients with rTOF. This may be due to the small sample size available along with mild to moderate cases of obstruction along the right ventricular outflow tract demonstrated in the patient cohort. Future studies will focus on collecting more data as well as assessing the hemodynamic parameters present in the right ventricle.Acknowledgements
No acknowledgement found.References
1. Geiger J, Markl M, Jung B, et al. 4D-MR flow analysis in patients after repair for tetralogy of Fallot. Eur Radiol. 2011;21(8):1651-1657. doi:10.1007/s00330-011-2108-4
2. François CJ, Srinivasan S, Schiebler ML, et al. 4D cardiovascular magnetic resonance velocity mapping of alterations of right heart flow patterns and main pulmonary artery hemodynamics in tetralogy of Fallot. J Cardiovasc Magn Reson. 2012;14(1):16. doi:10.1186/1532-429X-14-16
3. Geeraert P, Kim H, Ali SI, et al. Four-Dimensional Flow Magnetic Resonance Imaging and Applications in Cardiology. IntechOpen; 2021. doi:10.5772/intechopen.99362
4. Truong QA, Massaro JM, Rogers IS, et al. Reference Values for Normal Pulmonary Artery Dimensions by Noncontrast Cardiac Computed Tomography. Circ Cardiovasc Imaging. 2012;5(1):147-154. doi:10.1161/CIRCIMAGING.111.968610
Figures