0085
4D flow MRI derived global intracranial pulse wave velocity and T1 white matter hypointensities among a population-based group of older people1Department of Radiation Sciences, Umeå University, Umeå, Sweden, 2Umeå Center for Functional Brain Imaging (UFBI), Umeå University, Umeå, Sweden, 3Department of Clinical Science, Neurosciences, Umeå University, Umeå, Sweden, 4Department of Applied Physics and Electronics, Umeå University, Umeå, Sweden
Synopsis
Arterial stiffening occurs with age and could be detrimental to the brain through several pathways. This potentially aggravates factors causing cerebral small vessel disease. We assessed arterial stiffness of the intracranial arteries through a newly developed global intracranial pulse wave velocity (PWV) measurement using 4D flow MRI data in a population-based cohort of older people and compared it to white matter hypointensity volume (WMH). Results revealed a weak but significant correlation between WMH and PWV, suggesting that such PWV measurement could be a useful tool to assess the brain’s vascular health.
Introduction
Arterial stiffening occurs with biological ageing1 and increases the pulse wave velocity (PWV), the rate at which systolic pressure wave propagates through the vasculature. Arterial stiffening could be a factor worsening various neurological diseases such as small vessel disease6, mild cognitive impairment and Alzheimer’s disease7. The pathological mechanism potentially involves increased transmission of excessive cardiac related pulsatility to the capillary bed2 causing microvascular damage, neurovascular uncoupling and blood brain barrier disruption3. Another potential pathway is the disruption of glymphatic flow (were vascular wall movements are hypothesized to drive the flow) prohibiting brain waist clearance4-5. This urges the investigation of stiffness in the “target organ”, i.e., the intracranial cerebral arteries. Here we apply 4D flow MRI to assess cerebral arterial stiffness with a new global intracranial PWV measurement8 in a large population-based sample. The method utilizes all cross-sections in the detectable intracranial vasculature in the estimation of PWV. Furthermore, we investigate the relationship between PWV and white matter lesions (WML) volume, a feature of cerebral small vessel disease.Method
Participants: A population-based cohort with older people was recruited from the population registry (N=212, mean age 75y, age-range: 66y-85y).MRI Data Collection: All MRI data was collected on a 3T scanner (Discovery MR 750; GE Healthcare, Milwaukee, Wisconsin). 4D flow MRI data was collected using a PC-VIPR sequence with the following scan parameters; venc: 110 cm/s; TR/TE: 6.5/2.7 ms; flip angle: 8 degrees; radial projections: 16000; temporal resolution: 20 frames per cardiac cycle; acquisition matrix: 300×300×300 and 0.69 mm isotropic voxel size. Velocity volumes for all three directions and an angiographic complex difference (CD) volume were reconstructed. T1-weighted volumes were obtained using a 3D fast-spoiled gradient echo sequence. 176 slices were acquired with the parameters: TR/TE: 8.2/3.2 ms; flip angle: 12; slice thickness: 1 mm; in-plane resolution: 0.98 mm; field of view: 25×25 cm, and phase acceleration: 2.
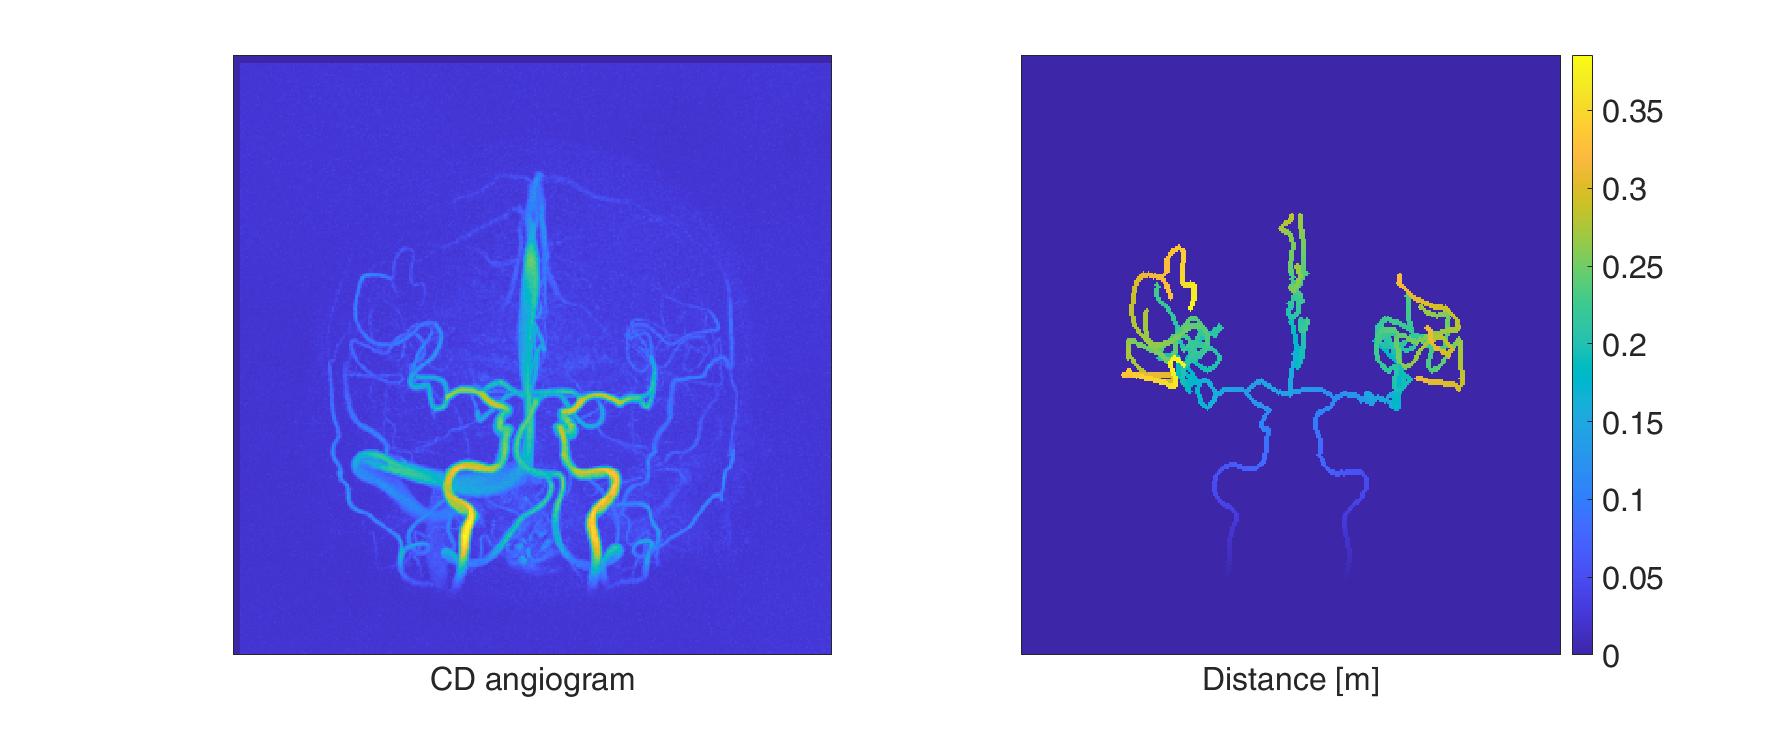
PWV and WML assessment: Global intracranial PWV calculations were performed according to a newly described method8. Using the CD, a branch representation of the vasculature was created in which each cross-section was assigned a distance from the root of the visible vasculature (only the carotid/anterior circulation was analyzed, see Fig. 1). 4D flow MRI data was used to assign each cross-section with time-resolved velocities. Then, PWVs were performed by a maximum likelihood estimator on a least squared formulated equation utilizing all available cross-sections. FreeSurfer 6.1 together with T1-weighted images were used to automatically quantify WML severity by looking at the volume of white matter hypointensities (WMH).
Results
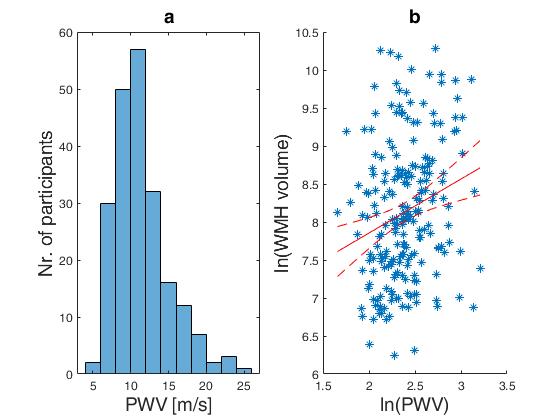
The obtained median PWV and interquartile range was 10.8(8.9-13.0) m/s and is visualized in Fig. 2a as a histogram. The relationship between PWV and WMH volume can be seen in Fig. 2b and yielded a correlation of rho=0.23 (p=9.9.×104 ), after taking the natural logarithm of each variable and accounting for age. The median and interquartile range for WMH volume were 3.2(1.7-6.0) ml.Discussion
This is the first study, including a large population-based sample of older people, demonstrating the feasibility of global intracranial PWV estimations from 4D flow MRI data. Importantly, global intracranial PWV aligned with WMH volume, supporting its role as an imaging biomarker of vascular health. The observed distribution of PWV seemed reasonable compared to reported PWVs of 7.9±2.4 m/s (N=10, age: 62±10y) in the arteries leading up from the neck9 and 17.2±7.4 m/s (N=42, age: 73±7y) measured in the cervical aspects of the arteries in the neck10. In addition, it is in good agreement with global PWVs of 10.7(9.2–13.6) m/s obtained using this approach in a considerably smaller sample of older people (N=35, mean age 79y; range 70-91y)8. WMH volumes were similar to a study utilizing FreeSurfer 6.0 and T1 weighted images in subjects of a similar age (N=56, WMH: 3.7(2.4-7.7) ml, age: 80(75.5-86)y)11. Using the obtained WMH volumes a weak, although significant, positive correlation can be seen with the obtained PWV.Conclusion
4D flow MRI allows deriving global estimations of cerebral arterial PWV. Such measurement opens up for new possibilities to study “target organ” arterial stiffness and may contribute to the understanding of how vascular alterations contribute to several common neurological diseases.Acknowledgements
We want to acknowledge research nurse Hanna Ackelind for excellent handling of research persons.
The study was supported by the Swedish Research Council and the Swedish Foundation for Strategic Research
References
1. Najjar SS, Scuteri A, Lakatta EG. Arterial aging: Is it an immutable cardiovascular risk factor? Hypertension 2005; 46: 454–462.
2. Poels MMF, Zaccai K, Verwoert GC, et al. Arterial stiffness and cerebral small vessel disease: The rotterdam scan study. Stroke 2012; 43: 2637–2642.
3. Donato AJ, Machin DR, Lesniewski LA. Mechanisms of dysfunction in the aging vasculature and role in age-related disease. Circ Res 2018; 123: 825–848.
4. Wåhlin A, Nyberg L. At the Heart of Cognitive Functioning in Aging. Trends in Cognitive Sciences. Epub ahead of print 2019. DOI: 10.1016/j.tics.2019.06.004.
5. Iadecola C. The Neurovascular Unit Coming of Age: A Journey through Neurovascular Coupling in Health and Disease. Neuron; 96. Epub ahead of print 2017. DOI: 10.1016/j.neuron.2017.07.030.
6. Mortensen KN, Sanggaard S, Mestre H, et al. Impaired Glymphatic Transport in Spontaneously Hypertensive Rats. J Neurosci 2019; 39: 6365–6377.
7. Nedergaard M, Goldman SA. Glymphatic failure as a final common pathway to dementia. Science (80- ) 2020; 370: 50–56.
8. Björnfot C, Garpebring A, Qvarlander S, et al. Assessing cerebral arterial pulse wave velocity using 4D flow MRI. J Cereb Blood Flow Metab 2021; 41: 2769–2777.
9. Peper ES, Strijkers GJ, Gazzola K, et al. Regional assessment of carotid artery pulse wave velocity using compressed sensing accelerated high temporal resolution 2D CINE phase contrast cardiovascular magnetic resonance. J Cardiovasc Magn Reson 2018; 20: 1–12.
10. Rivera-Rivera LA, Cody KA, Eisenmenger L, et al. Assessment of vascular stiffness in the internal carotid artery proximal to the carotid canal in Alzheimer’s disease using pulse wave velocity from low rank reconstructed 4D flow MRI. J Cereb Blood Flow Metab. Epub ahead of print 2020. DOI: 10.1177/0271678X20910302.
11. Wei K, Tran T, Chu K, et al. White matter hypointensities and hyperintensities have equivalent correlations with age and CSF β-amyloid in the nondemented elderly. Brain Behav 2019; 9: 1–9.
Figures