0077
Amyloid burden and vascular risk factors correlate with regional cerebral blood flow in a cognitively unimpaired population1Department of Radiology and Nuclear Medicine, Amsterdam Neuroscience, Amsterdam University Medical Center, Location VUmc, Amsterdam, Netherlands, 2Department of Neurology, Alzheimer Center, Neuroscience Campus Amsterdam, VU University Medical Center, Amsterdam, the Netherlands, Amsterdam, Netherlands, 3Department of Biological Psychology, Vrije Universiteit Amsterdam, Amsterdam, Netherlands, 4Queen Square Institute of Neurology and Centre for Medical Image Computing (CMIC), University College London, London, United Kingdom, 5Helmholtz-Zentrum Dresden-Rossendorf, Institute of Radiopharmaceutical Cancer Research, Dresden, Germany
Synopsis
Studying the association between cerebral blood flow (CBF), amyloid burden, and vascular risk factors in a cognitively unimpaired elderly population could clarify the role of CBF as a biomarker of cognitive decline. In 196 cognitively unimpaired participants, regional CBF was associated with regional amyloid-PET Centiloid. Vascular risk scores as measured by the Framingham risk score combined with amyloid Centiloid values were associated with increased CBF in vascular territories. Longitudinally, global CBF changes were associated with baseline precuneus amyloid burden.
1. Introduction
Recent findings indicate considerable overlap between cerebrovascular disease and Alzheimer's disease (AD), suggesting additive or synergistic effects of both pathologies on cognitive decline1,2. Perfusion imaging holds great promise for detecting alterations in neuronal functioning at early stages of cognitive decline3 since adequate cerebral blood flow (CBF) is essential to maintain neuronal metabolism and brain function. Supply and demand of blood flow in the brain can be affected by, respectively, the loss of vascular health and the decrease of neuronal activity — as a consequence of AD4. This study investigates to what extent the vascular and AD components affect CBF and how they interact with each other. We hypothesize that the amyloid burden in early-accumulation regions5,6 and vascular risk factors are related to brain perfusion alterations in an elderly cognitively unimpaired (CU) population.2. Methods
2.1. ParticipantsA total of 196 CU participants, aged 70±7.3 years; 57% female, were included from the EMIF-AD PreclinAD7 Twin60++ cohort. Four years after baseline, 135 participants were scanned again with an identical scanner, scanner software, and scan protocol.
2.2. Vascular risk assessment and image acquisition
The cardiovascular risk profile for each participant was summarized using the Framingham score index8.
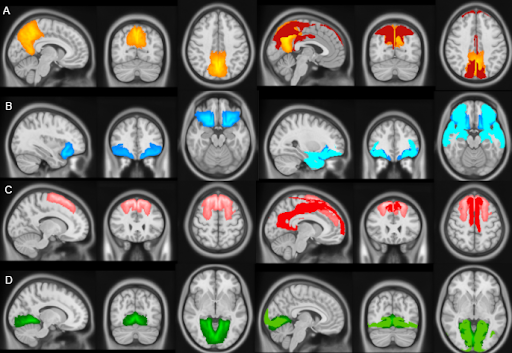
Amyloid-PET using the [18F]flutemetamol radiotracer was used to image cortical amyloid burden and quantified using the Centiloid method9 globally and for four early amyloid accumulation regions of interest (ROIs) obtained from the LEAP atlas10,11: Early Frontal Gyrus —orbital frontal + basal frontal — Precuneus, Superior Frontal Gyrus, and Lingual Gyrus (Figure 1).
Whole-brain 3D T1-weighted and 2D EPI Arterial Spin Labeling (ASL) images were obtained using a 3T PET-MRI Ingenuity scanner (Philips Healthcare, Best, The Netherlands). After visual quality-control, 172 baseline and 117 follow-up scans were included. Image processing was performed with ExploreASL12. Mean regional CBF was assessed in the total gray matter (GM) and in the same four amyloid-based ROIs. Additionally, we investigated the mean CBF in the vascular territories13 (Figure 1) that overlapped with these ROIs (Figure 2).
2.3. Statistical analysis
All statistical analyses were performed in R 3.3.1 using generalized estimating equations (GEEs).
Cross-sectionally, we first examined the relation between Centiloid and CBF values in early amyloid accumulation regions5,6. Second, we examined the association between the amyloid ROIs with the spatially overlapping vascular territories CBF (Figure 2), including the association between global GM CBF values and global Centiloid. Analyses were adjusted for age, sex, and twin dependency. For both analyses, we studied the interaction between Centiloid and Framingham scores on CBF in the same regions.
In the longitudinal analysis (n=117), we examined whether global and regional amyloid burden at baseline predicts global GM CBF at follow-up.
3. Results
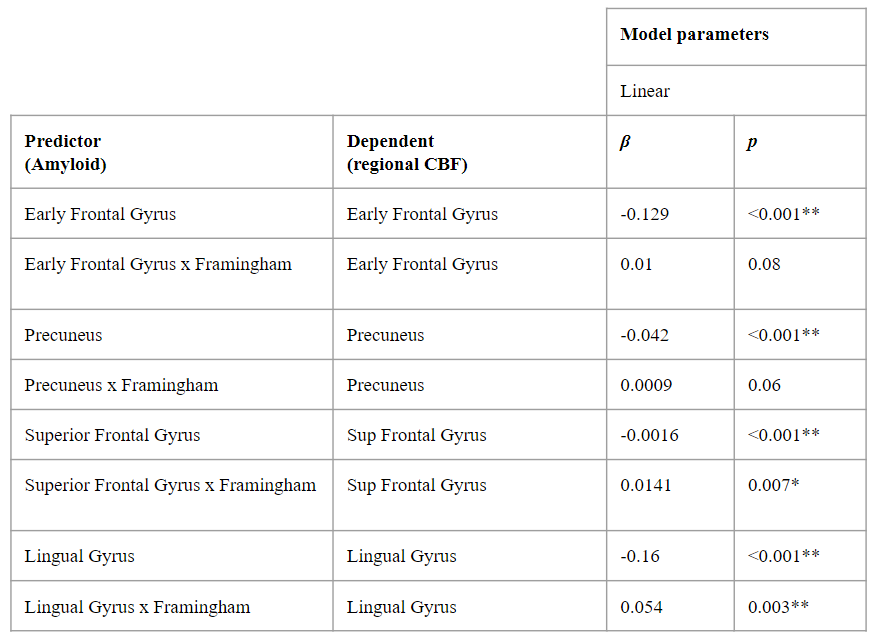
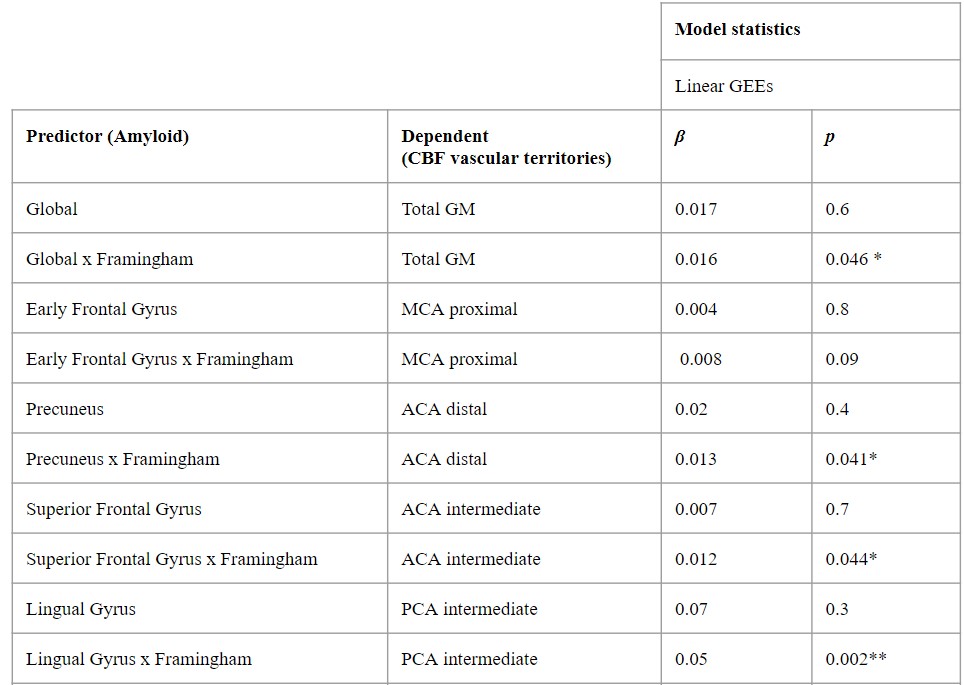
3.1. Cross-sectional associationsWe found significant associations between regional Centiloid and CBF in corresponding regions from the LEAP atlas (Table 1). A significant interaction between amyloid and Framingham on CBF was found only for the Lingual Gyrus ROI (p=0.003). Both global and regional associations were found between global Centiloid with Framingham scores and CBF values for all of the vascular territories except for the MCA proximal region (Table 2).
3.2. Baseline Centiloid and longitudinal CBF changes
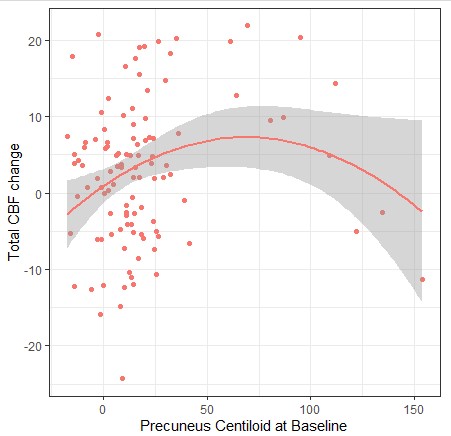
No significant association between global Centiloid at baseline and total CBF changes was found. Regionally, linear models detected no significant predictors, however, using quadratic models, Precuneus Centiloid significantly predicted total CBF changes over time (p = 0.0285, ΔQIC = 187) (Figure 3).
4. Discussion
We found regional amyloid burden in AD signature regions to be associated with altered CBF in cognitively intact individuals. Interestingly, the interaction between amyloid Centiloid values and Framingham Risk scores was associated with vascular territory CBF values, suggesting the importance of vascular risk factors when studying CBF in the context of cognitive decline. The missing association between the Early Frontal Centiloid region and MCA proximal territory could be explained by the susceptibility artifact in the orbitofrontal cortex in the 2D EPI ASL acquisition used. Unexpectedly, we observed an increase in vascular territories CBF with increasing Centiloid; which could be explained by compensatory mechanisms at the beginning of amyloid accumulation14. From the longitudinal assessment, we found an association between total CBF change over time and Precuneus Centiloid values at baseline, which is one of the first AD-related regions for amyloid accumulation and atrophy15. However, these results might be driven by outliers as we only had a few participants with high amyloid load in this CU cohort. This work demonstrates the potential value of the joint analysis of regional CBF, cardiovascular risk scores, and amyloid burden. Future work will include the investigation of their joint impact on cognitive performance.Acknowledgements
BP, JP, and HM are supported by the EU Joint Program for Neurodegenerative Disease Research, provided by the Netherlands Organisation for health Research and Development and Alzheimer Nederland (DEBBIE JPND2020-568-106).References
1. Attems, J. & Jellinger, K. A. The overlap between vascular disease and Alzheimer’s disease--lessons from pathology. BMC Med. 12, 206 (2014).
2. Bangen, K. J. et al. Interactive effects of vascular risk burden and advanced age on cerebral blood flow. Front. Aging Neurosci. 6, 159 (2014).
3. Wierenga, C. E., Hays, C. C. & Zlatar, Z. Z. Cerebral Blood Flow Measured by Arterial Spin Labeling MRI as a Preclinical Marker of Alzheimer ’ s Disease. 42, 411–419 (2014).
4. D. Allan Butterfield, B. H. Oxidative stress, dysfunctional glucose metabolism and Alzheimer disease. Nat Rev Neurosci 20, 148–160 (2019).
5. Mattsson, N. et al. Association of brain amyloid-β with cerebral perfusion and structure in Alzheimer’s disease and mild cognitive impairment. Brain 137, 1550–1561 (2014).
6. Collij, L. E. et al. Multitracer model for staging cortical amyloid deposition using PET imaging. Neurology 95, e1538–e1553 (2020).
7. Konijnenberg, E. et al. The EMIF-AD PreclinAD study: study design and baseline cohort overview. Alzheimers. Res. Ther. 10, 75 (2018).
8. Wilson, P. W. et al. Prediction of coronary heart disease using risk factor categories. Circulation 97, 1837–1847 (1998).
9. Klunk, W. E. et al. The Centiloid Project: standardizing quantitative amyloid plaque estimation by PET. Alzheimers. Dement. 11, 1–15.e1–4 (2015).
10. Wolz, R. et al. LEAP: learning embeddings for atlas propagation. Neuroimage 49, 1316–1325 (2010).
11. Lopes Alves, I. et al. Quantitative amyloid PET in Alzheimer’s disease: the AMYPAD prognostic and natural history study. Alzheimers. Dement. 16, 750–758 (2020).
12. Mutsaerts, H. J. M. M. et al. ExploreASL: An image processing pipeline for multi-center ASL perfusion MRI studies. Neuroimage 219, 117031 (2020).
13. Mutsaerts, H. J. M. M. et al. Cerebral Perfusion Measurements in Elderly with Hypertension Using Arterial Spin Labeling. PLoS One 10, e0133717 (2015).
14. Hahn, A. et al. Association Between Earliest Amyloid Uptake and Functional Connectivity in Cognitively Unimpaired Elderly. Cereb. Cortex 29, 2173–2182 (2019).
15. Thomas, B., Sheelakumari, R., Kannath, S., Sarma, S. & Menon, R. N. Regional Cerebral Blood Flow in the Posterior Cingulate and Precuneus and the Entorhinal Cortical Atrophy Score Differentiate Mild Cognitive Impairment and Dementia Due to Alzheimer Disease. AJNR Am. J. Neuroradiol. 40, 1658–1664 (2019).
Figures