0073
Multi-delay pseudo-continuous arterial spin labeling for perfusion quantification in the spleen
Sergio M. Solis-Barquero1,2, Verónica Aramendia-Vidaurreta1,2, Marta Vidorreta3, Rebeca Echeverria-Chasco1,2, Leyre García-Ruiz1,2, Ana Ezponda1,2, Gorka Bastarrika1,2, and María A. Fernández-Seara1,2
1Departament of Radiology, Clínica Universidad de Navarra, Pamplona, Navarra, Spain, 2IdiSNA, Instituto de Investigación Sanitaria de Navarra, Navarra, Spain, 3Siemens Healthineers, Madrid, Spain
1Departament of Radiology, Clínica Universidad de Navarra, Pamplona, Navarra, Spain, 2IdiSNA, Instituto de Investigación Sanitaria de Navarra, Navarra, Spain, 3Siemens Healthineers, Madrid, Spain
Synopsis
The spleen plays an important role in diseases related to portal circulation. Pseudo-continuous arterial spin labeling (PCASL) was used to assess the Splenic Blood Flow (SBF) using six different post labeling delays in five different healthy volunteers. SBF and ATT maps were generated by fitting the one compartment Buxton kinetic model. This study shows the feasibility of using single and multi-delay PCASL to measure blood flow in the spleen. Obtained SBF values are in agreement with previous studies. PCASL enables a reliable measure of splenic blood flow in healthy volunteers.
Introduction
The spleen is an important organ in the cardiovascular homeostasis. It can influence blood pressure, plasma volume and renal function1. It is also of importance to understand the involvement of the spleen in diseases related to portal circulation such as portal hypertension, cirrhosis, chronic liver disease, hepatic disfunction and others2. Studies using PET2 and contrast enhanced CT have been done to assess splenic perfusion3,4, but the first method requires the use of a radioactive tracer, while the second exposes the patient to ionizing radiation5. Arterial spin labeling (ASL) is an interesting non-invasive alternative to measure splenic blood flow (SBF), although it has been scarcely used in the spleen6. The purpose of this study was to evaluate the feasibility of noninvasively imaging splenic perfusion using multi-delay pseudo-continuous arterial spin labeling (PCASL) and to derive SBF and arterial transit time (ATT) measurements in healthy volunteers.Methods
Written informed consent was obtained before scanning, and the protocol was approved by the institutional research committee. A total of five healthy volunteers (4 men, mean age 24.8, SD 3.8, range 21-29 years old) were scanned in a 1.5 T Aera MRI scanner (Siemens Healthcare, Erlangen, Germany) using a PCASL sequence with six different post-labeling delays (PLDs) (500, 700, 1000, 1200, 1500, and 2000 ms). Acquisition parameters are presented in Figure 1 A. Volunteers were coached to synchronize their breathing to the sequence, so that image readout took place at the expiration phase. The labeling was performed axially, 4 to 6 cm above the imaging slice, avoiding the heart and perpendicular to the descending aorta, whenever possible, according to volunteer anatomy. The axial imaging slice was located approximately at the middle of the spleen (see Figure 1 B). A total of 50 control and label images were acquired for each PLD. Images were analyzed using custom scripts in Matlab. SBF and ATT maps were calculated by fitting the one compartment Buxton kinetic model7:$$\left(SI_c-SI_L\right)=\ 0\mathrm{\mathrm{,\ }when\ }0<\ \tau+PLD<ATT$$
$$\left(SI_c-SI_L\right)=\frac{2\alpha T1_b}{6000\lambda}M_0SBFe^\frac{-ATT}{T1_b}\left(1-e^\frac{-\left(\tau+PLD-ATT\right)}{T1_b}\right)\mathrm{\mathrm{,\ }when\ }ATT<\tau+PLD<\tau+ATT$$
$$\left(SI_c-SI_L\right)=\frac{2\alpha T1_b}{6000\lambda}M_0SBFe^\frac{-PLD}{T1_b}\left(1-e^\frac{-\tau}{T1_b}\right)\mathrm{\mathrm{,\ }when\ }\tau+ATT<\tau+PLD$$
Where $$$\left(SI_C-SI_L\right)$$$ is the signal difference between control and label scans for each PLD, $$$\alpha =\mathrm{0.70\times0.93\times0.93}$$$ is the labeling efficiency, considering PCASL efficiency and the effects of 2 background suppression (BS) pulses, $$$\lambda =\mathrm{0.9ml/g}$$$ is the tissue-blood partition coefficient, $$${T1}_{blood} = 1480\ ms$$$8 is the longitudinal relaxation time of blood at 1.5T and $$$\tau$$$ is the labeling duration. Single delay SBF maps were also computed from the data acquired with PLD of 1000 ms. Mean SBF and ATT values were obtained from a splenic ROI, manually drawn. Statistical analyses were performed in RStudio. A Wilcoxon signed rank test was done to check for differences in SBF between single and multi-delay analyses.
Results
Successful ASL acquisitions were performed in all volunteers (see perfusion images from a representative subject in Figure 2). A mean of 148.1 ml/100g/min (SD 32.29) was obtained for the spleen from the single PLD data, and 135.9 ml/100g/min (SD 25.35) in the multi-delay analysis. The difference was not statistically significant (p = 0.19) (See Figure 3). A mean arterial transit time (ATT) of 740 s (SD 480) was obtained across volunteers. Figure 4 shows SBF maps for a single volunteer. Other results are shown in Figure 5 A. ASL signal values for each PLD are shown graphically in Figure 5 B. All images are shown in radiological orientation.Discussion
Initial results in five healthy volunteers show the feasibility of using single and multi-delay PCASL to measure blood flow in the spleen. The multi-delay strategy has the advantage of additionally allowing estimation of ATT values, which can be beneficial in cases of prolonged ATT. Measured SBF values are in agreement with a previous ASL study6 using single-delay FAIR and comparable to those obtained with contrast enhanced CT in healthy volunteers4. The results of this study indicate that in single PLD acquisitions, a PLD of 1000 ms would be appropriate in healthy volunteers, as it yielded the highest mean perfusion signal and tSNR. The effects of organ motion were adequately minimized using synchronize breathing and background suppression.Conclusion
PCASL enables a reliable measure of splenic blood flow in healthy volunteers. More studies need to be performed to assess the spleen blood flow in pathological conditions.Acknowledgements
Funding: Sergio M. Solís-Barquero received PhD grant support from Fundación Carolina and Universidad de Costa Rica. Spanish Ministry of Science and Innovation (grant: PI21/ 00578).References
- Kaufman, S. & Levasseur, J. Effect of portal hypertension on splenic blood flow, intrasplenic extravasation and systemic blood pressure. Am J Physiol Regul Interg Comp Physiol 284, R1580–R1585 (2003).
- Oguro, A. et al. Quantification of human splenic blood flow (Quantitative measurement of splenic blood flow with H 2 15 0 and a dynamic state method: 1). Annals of Nuclear Medicine vol. 7 (1993).
- Sauter, A. W. et al. Assessment of Splenic Perfusion in Patients with Malignant Hematologic Diseases and Spleen Involvement, Liver Cirrhosis and Controls Using Volume Perfusion CT (VPCT). A Pilot Study. Acad. Radiol. 19, 579–587 (2012).
- Kanda, T. et al. Perfusion measurement of the whole upper abdomen of patients with and without liver diseases: Initial experience with 320-detector row CT. Eur. J. Radiol. 81, 2470–2475 (2012).
- Sauter, A. W., Spira, D., Schulze, M. & Horger, M. S. Explanations for the heterogeneity of splenic enhancement derived from blood flow kinetic measurements using dynamic contrast-enhanced CT (DCE-CT). Acta radiol. 55, 645–653 (2014).
- Bradley, C. R. et al. Multi-organ assessment of compensated cirrhosis patients using quantitative magnetic resonance imaging. J. Hepatol. 69, 1015–1024 (2018).
- Buxton, R. B. et al. A general kinetic model for quantitative perfusion imaging with arterial spin labeling. Magn. Reson. Med. 40, 383–396 (1998).8. Zhang, X. et al. In vivo blood T1 measurements at 1.5 T, 3 T, and 7 T. Magn. Reson. Med. 70, 1082–1086 (2013).
Figures
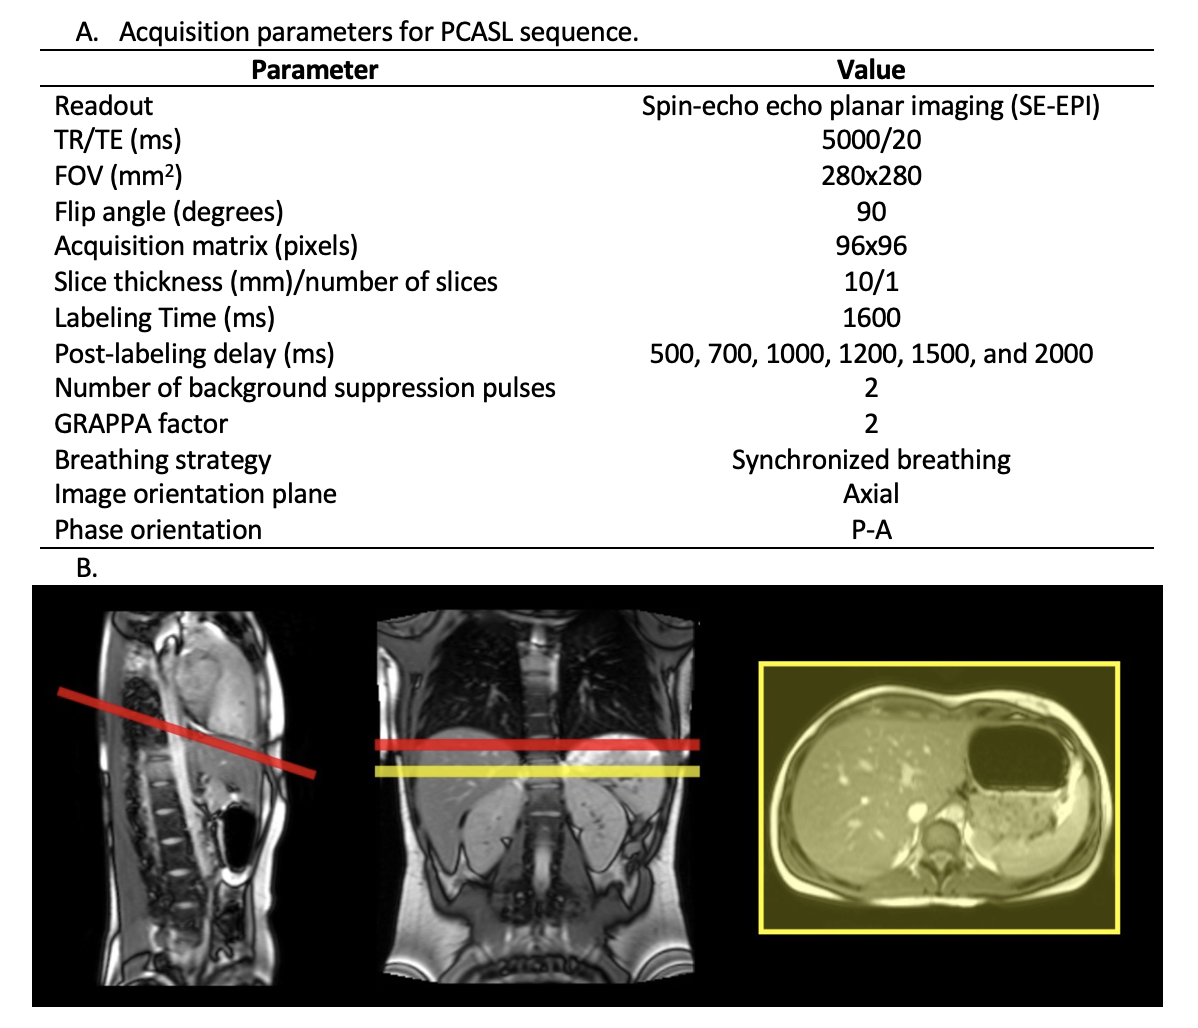
Figure 1. A. Acquisition parameters for PCASL sequence B. Labeling and imaging plane position in one subject. Red line represents the labeling plane, and the yellow line represents the imaging slice. The distance from the labeling plane to the imaging slice was 4-6 cm. The labeling plane was positioned as perpendicular to the aorta as possible, but in some cases, it had to be rotated to avoid the heart.
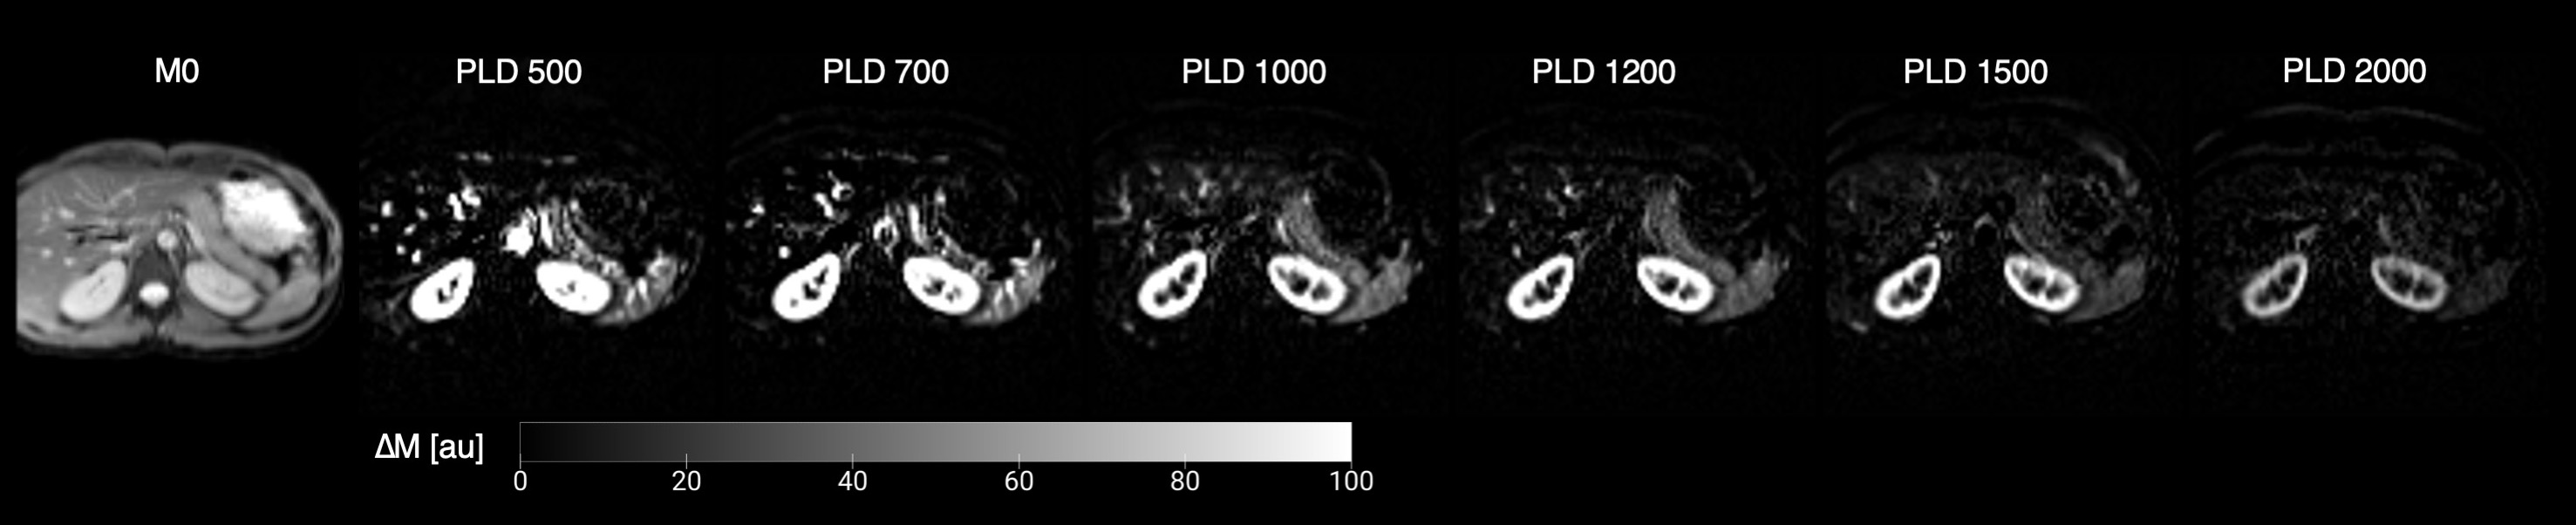
Figure 2. Perfusion images obtained in a representative subject across the different PLDs used. The first image to the left, M0 image, is shown as an anatomical reference. The other images depict the different perfusion maps obtained for each PLD used. Perfusion images are shown as DM (control-label) in arbitrary units (au).
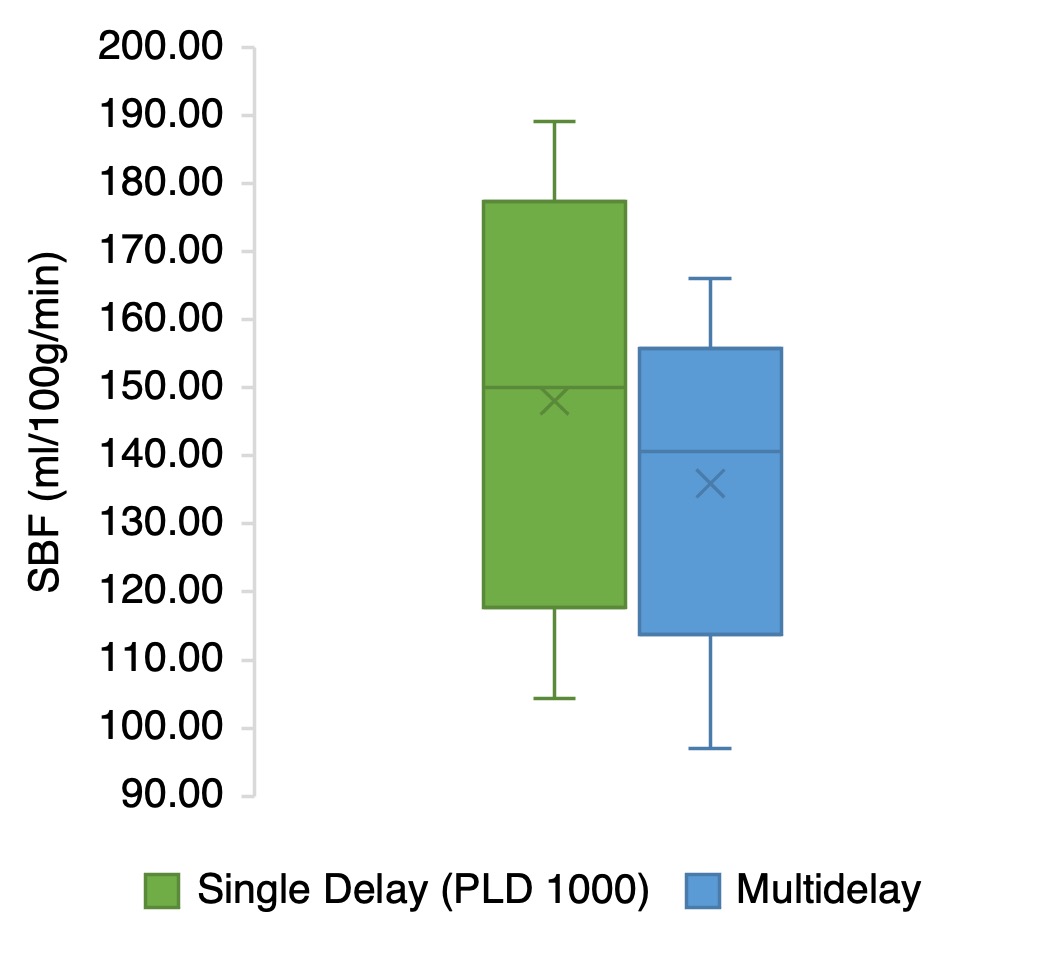
Figure 3. SBF values obtained in the single delay, and multi-delay analysis. There are no statistically significant differences in SBF between analyses used (p = 0.19).
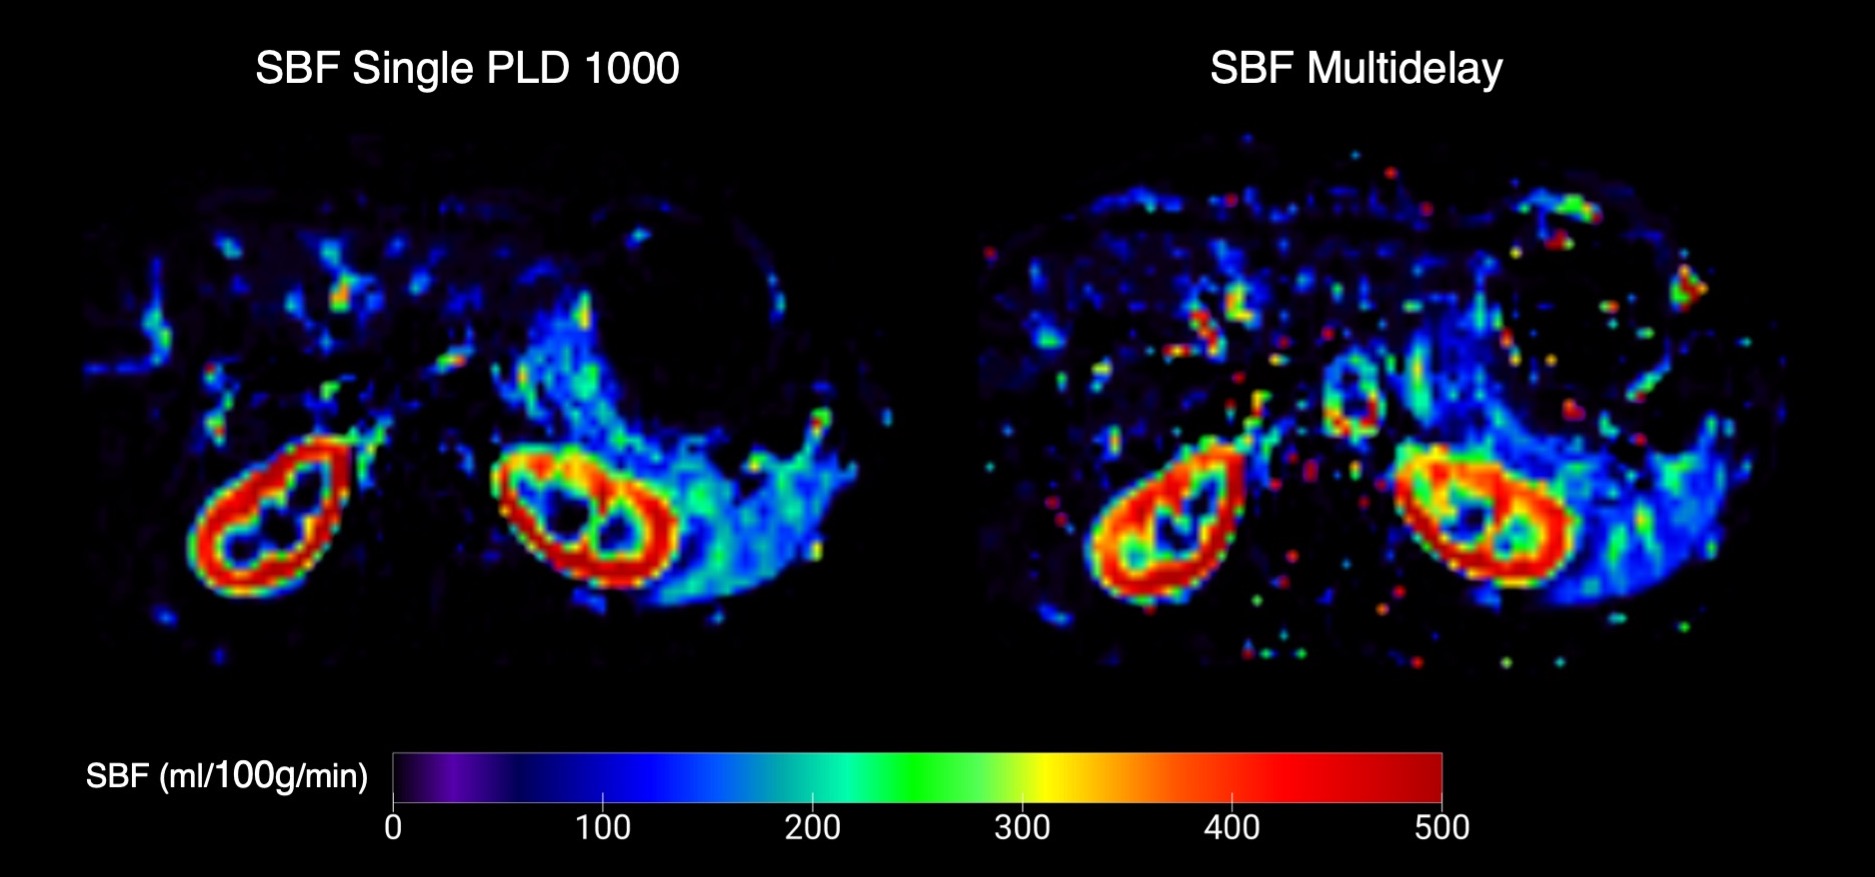
Figure 4. SBF maps for one subject. Splenic blood flow maps shown are the mean SBF obtained for the single PLD (1000 ms) to the left, and the multi delay SBF to the right.
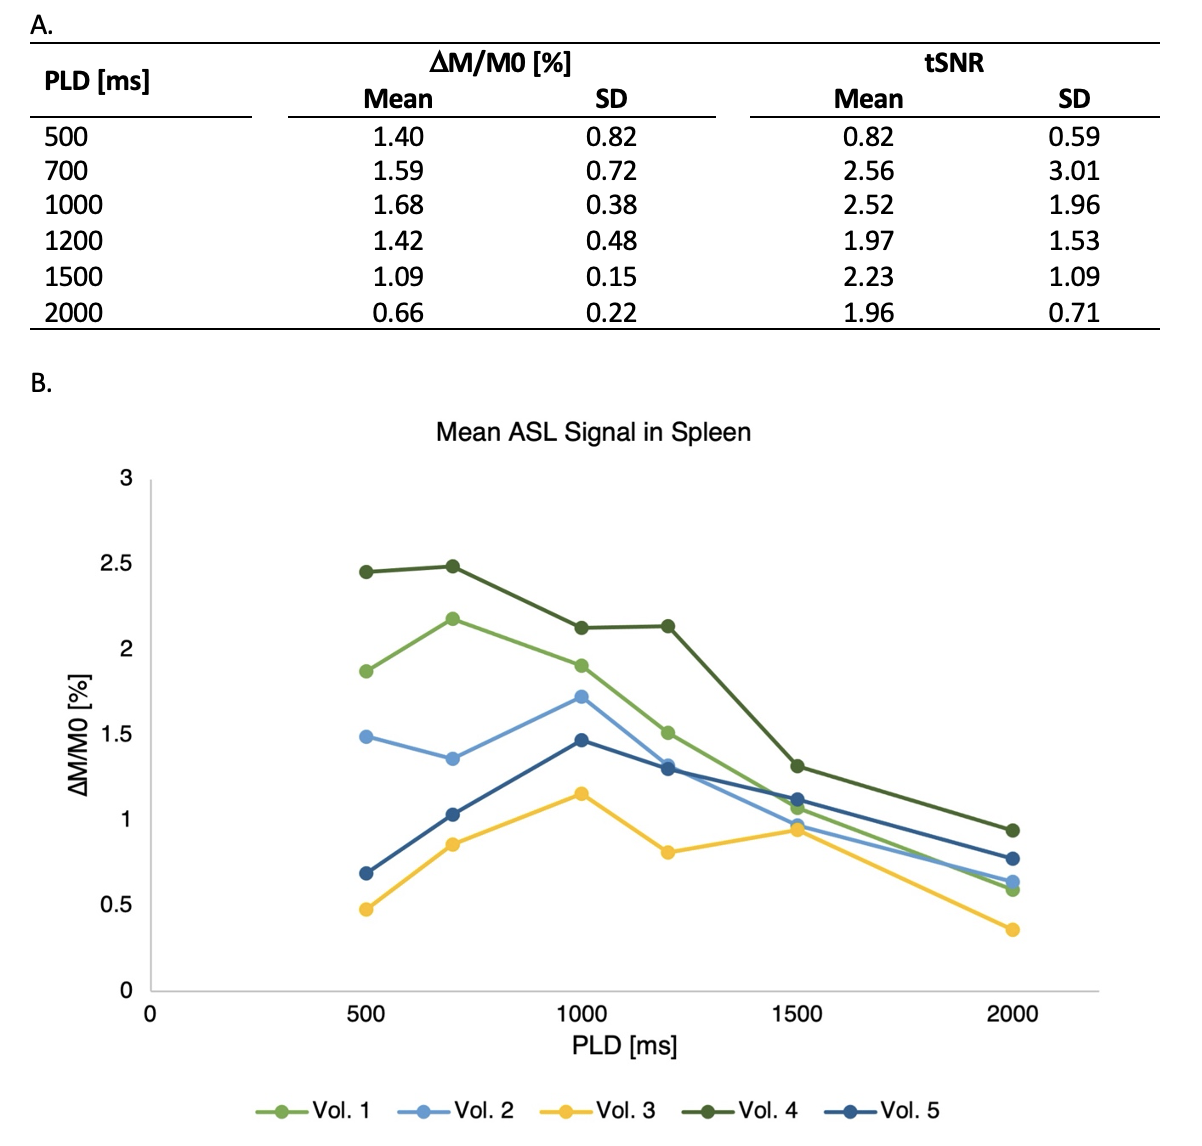
Figure 5. A. Results for every PLD used. Mean and SD across subjects are shown. B. ASL signal change in percentage in the spleen across the different PLDs used. Each line represents the ASL signal change for one volunteer (n = 5).
DOI: https://doi.org/10.58530/2022/0073