0071
Measuring glomerular blood transfer rate in kidney using diffusion-weighted arterial spin labeling1Department of Bio and Brain Engineering, Korea Advanced Institute of Science and Technology, Daejeon, Korea, Republic of
Synopsis
Imaging methods for the non-invasive measurement of renal function, such as glomerular filtration rate (GFR), are promising. In this study, we propose a renal perfusion kinetic model to estimate the blood transfer rate constant ($$$k_G$$$) in glomerulus with the multi-slice multi-delay diffusion-weighted arterial spin labeling sequence. Mean cortical $$$k_G$$$ values with a caffeine challenge were higher than those with no caffeine challenge, consistent with previous studies with GFR. The current study is promising in that it shows a potential availability of $$$k_G$$$ as a non-invasive quantitative measure of renal function.
Introduction
Glomerular filtration rate(GFR) is one of the important measures of renal function, representing the blood volume filtered from the glomerulus into the Bowman’s capsule per unit time. Various studies have been conducted for measuring GFR using MRI. Representative kinetic models are from DCE-MRI1. Since injected contrast agents of DCE-MRI have a potential risk of nephropathy, non-invasive imaging methods to evaluate renal function are necessary.GFR is affected by the product of filtration coefficient and net filtration pressure, which is the sum of osmotic pressures and hydrostatic pressures within glomerulus and Bowman’s capsule. Specifically, hydrostatic pressure is affected by the resistance in afferent and efferent arterioles, and the arteriole resistance is controlled by adenosine, which increases the resistance in afferent arterioles(vasoconstriction) and results in reduced GFR. If we can measure pressure changes associated with glomerular arterioles using MRI, it would be helpful for investigating GFR and thus renal function noninvasively.
In this study, we proposed a new method measuring the blood transfer rate($$$k_G$$$) from afferent arterioles into glomerulus. We hypothesized that $$$k_G$$$ reflects GFR through changes in net filtration pressure of glomerulus. Temporal signals of compartments were analyzed from the images obtained with the diffusion-weighted ASL(DWASL) technique2. The feasibility of the proposed model was assessed by comparing $$$k_G$$$ values without and with administration of caffeine, which is known as adenosine antagonist.
Theory
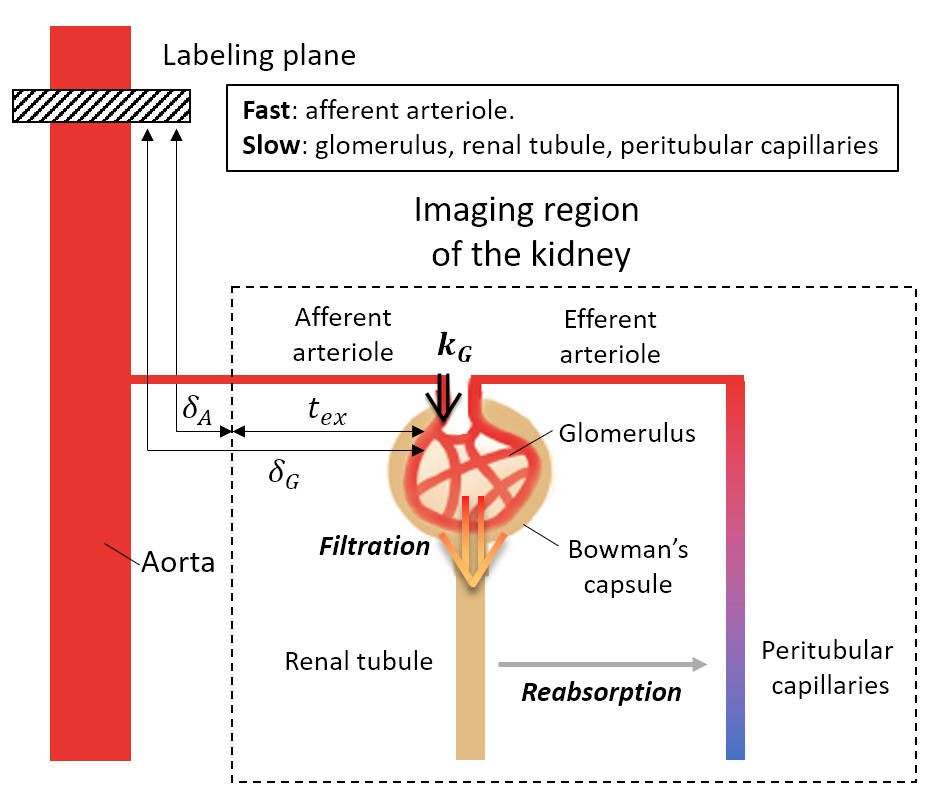
Figure1 is the schematic diagram presenting renal blood flows. Labeled blood in the aorta reaches the kidney after $$$\delta_A$$$ and then is transferred to glomerulus through the afferent arteriole. In the proposed model, we assume the fast component corresponds to pre-glomerular flows(blood in afferent arterioles), and the slow component corresponds to post-glomerular flows(pre-urinary flow in renal tubules and blood in glomerulus and peritubular capillaries). The blood transfer from the afferent arteriole into glomerulus was assumed in the model with the rate of $$$k_G$$$. Pre-glomerulus($$$\Delta{M_{p}(t)}$$$) and post-glomerulus components($$$\Delta{M_{t}(t)}$$$) are expressed as follows:$$\Delta{M_{p}(t)}=\frac{2{\alpha}{M_0}f}{\lambda}{\int_{\max(t-\tau,\delta_A)}^{\max(t,\delta_A)}{{e^{-R_{1a}t'}}\cdot{e^{-k_{G}\cdot{\max(t'-\delta_G,0)}}}dt'}}{\cdots}Eq.(1)$$
$$\Delta{M_{t}(t)}=\frac{2{\alpha}{M_0}f}{\lambda}{\int_{\max(t-\tau,\delta_{G})}^{\max(t,\delta_G)}{\int_{\delta_G}^{t'}{{k_G}{\cdot}e^{-R_{1a}u}{\cdot}e^{-k_{G}(u-\delta_G)}{\cdot}e^{-{R_{1b}}(t'-u)}dudt'}}}{\cdots}Eq.(2)$$
where f is the renal blood flow(RBF), $$$\delta_G$$$ is the transit time of the blood to glomerulus, $$$\alpha$$$=0.85*0.8 denotes the labeling efficiency, $$$\lambda$$$=0.9mL/g denotes the blood-tissue partition coefficient, and $$$T_{1a}=1/{R_{1a}}$$$=1650ms and $$$T_{1b}=1/{R_{1b}}$$$=4300ms are the longitudinal relaxation rates of blood and post-glomerular flows, respectively.
Method
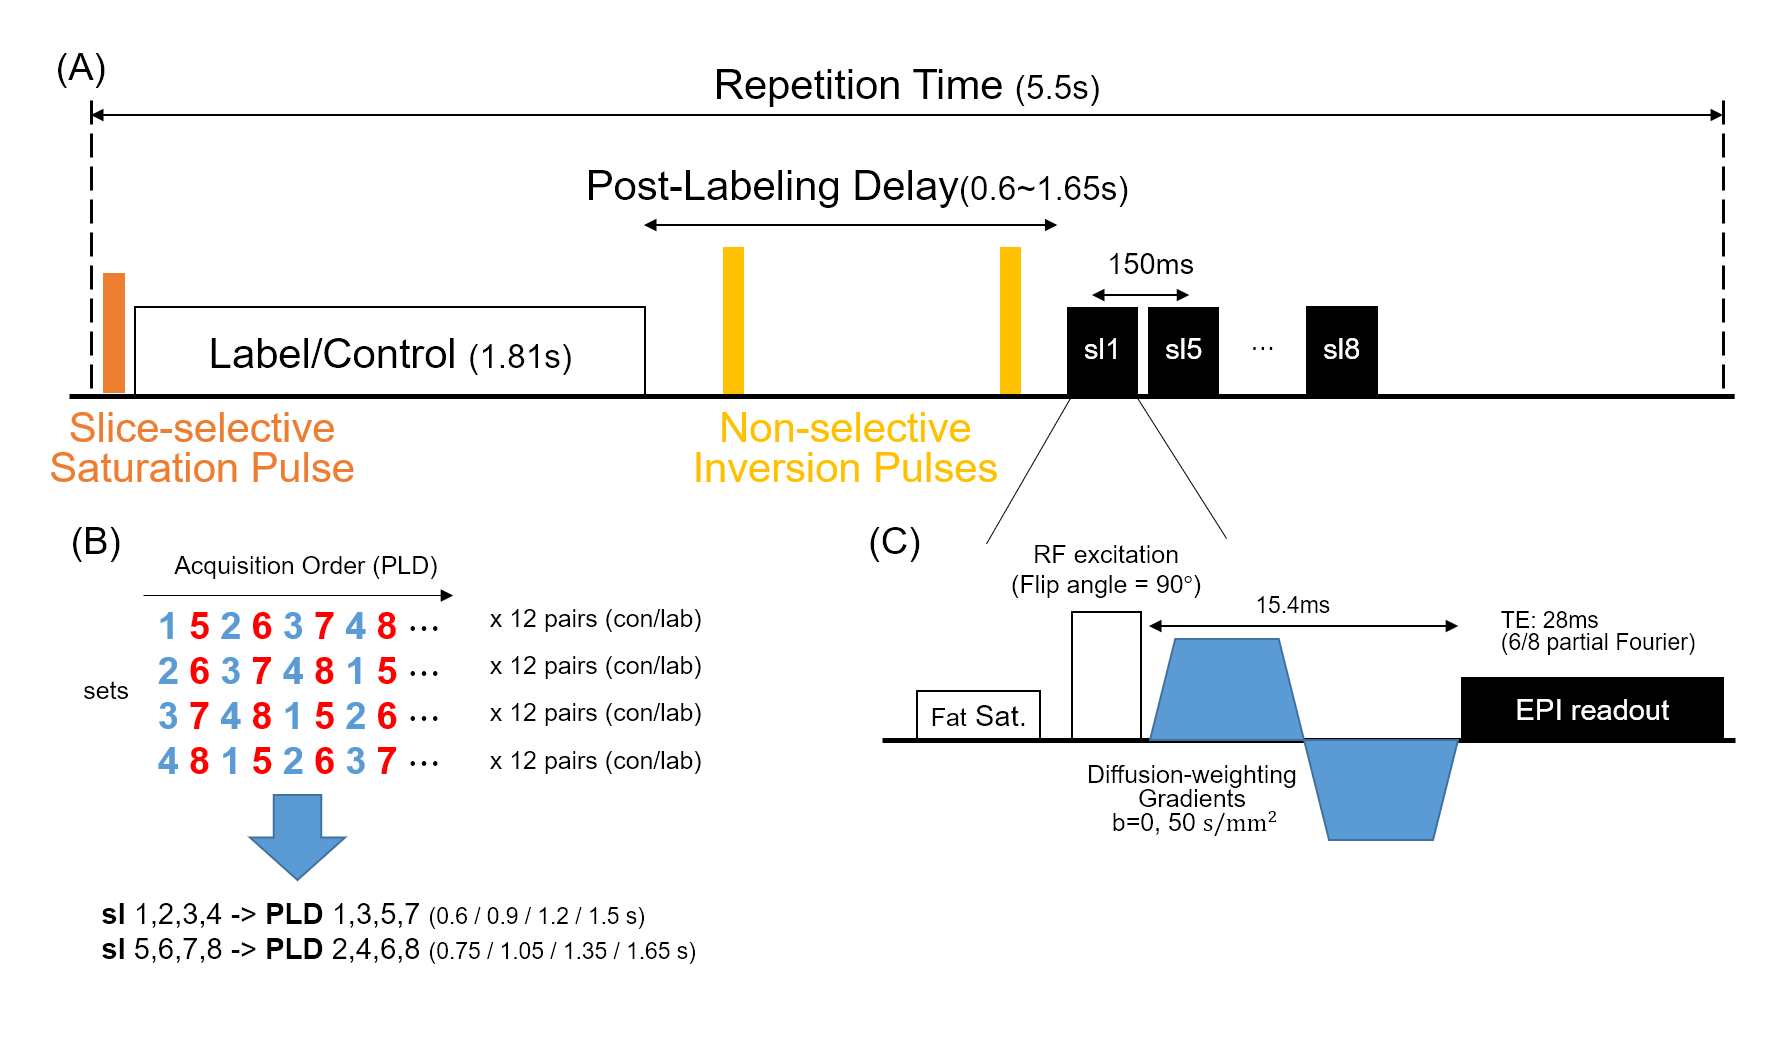
Multi-slice multi-delay DWASL sequence(Figure2)2 was used for image acquisition in the coronal direction, FOV=340×255mm2, matrix size=96×72, and thickness=5mm. Subjects were instructed to breathe in synchrony with the image acquisition. The scan was repeated with and without diffusion gradients($$$\Delta{M_{b50}(t)}$$$, $$$\Delta{M_{b0}(t)}$$$) and an additional set of images($$$M_0$$$) was obtained for normalization. Total scan time was 18min.Six healthy volunteers(28.0±1.6Y, 6M) were examined on a 3T MRI scanner(Verio, Siemens). Subjects were asked to refrain from high sodium or caffeine-containing foods from the night before the experiment day. At 100-mins before the experiment, subjects emptied their bladder, and a dose of 100mg caffeine or empty pill was served with 100mL of water. It was repeated 4-times at 30-min intervals, and the subjects emptied their bladder again before the experiment.
The acquired images were segmented and registered before the analysis3. The ASL signal is related to the renal blood flow and the blood transit time as follows4:
$$\Delta{M(t)}=\frac{2{\alpha}{M_0}f}{\lambda}{\cdot}T_{1a}{\cdot}e^{-\delta{R_{1a}}}{\cdot}[1-e^{-\max(\min(t-\delta,\tau),0)R_{1a})}]{\cdot}e^{-\max(t-(\delta+\tau))R_{1a}}{\cdots}Eq.(3)$$
The $$$\delta_A$$$ and $$$\delta_G$$$ were determined by fitting acquired $$$\Delta{M_{b0}(t)}$$$ and $$$\Delta{M_{b50}(t)}$$$ images to Eq.(3), respectively.
In the renal perfusion signal, fast flowing pre-glomerular flows($$$\Delta{M_{p}(t)}$$$) were assumed to be suppressed under the condition of diffusion gradient with $$$b=50s/mm^2$$$. Therefore, we approximated the ratio of $$$\Delta{M_{b50}(t)}$$$ to $$$\Delta{M_{b0}(t)}$$$ as follows:
$$\frac{{\Delta}M_{b50}(t)}{{\Delta}M_{b0}(t)}\approx\frac{\Delta{M_t}(t)}{\Delta{M_t}(t)+\Delta{M_p}(t)}=F({k_G}|f,\delta_A,\delta_G){\cdots}Eq.(4)$$
The $$$k_G$$$ was determined by fitting acquired dynamic images of $$$\Delta{M_{b50}(t)}/\Delta{M_{b0}(t)}$$$ to Eq.(4).
The least-squares method was used for the curve-fitting, and the Wilcoxon signed-rank test was used to compare perfusion parameters of the caffeine study with those of the control study.
Results and Discussion
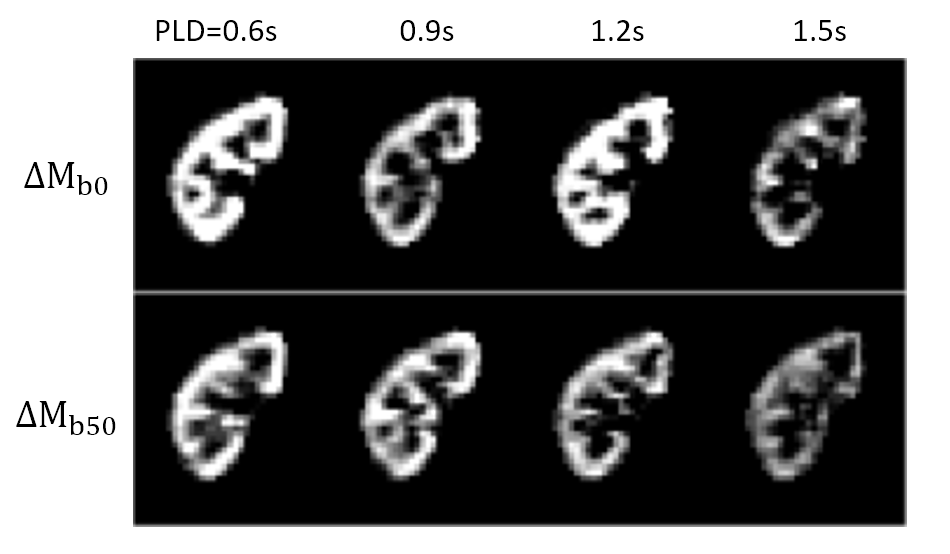
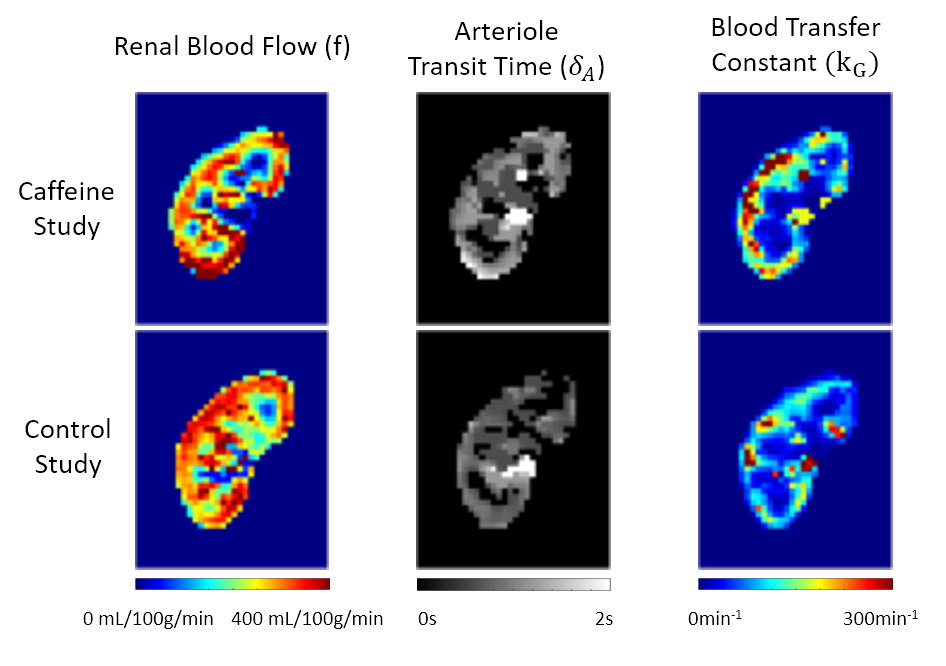
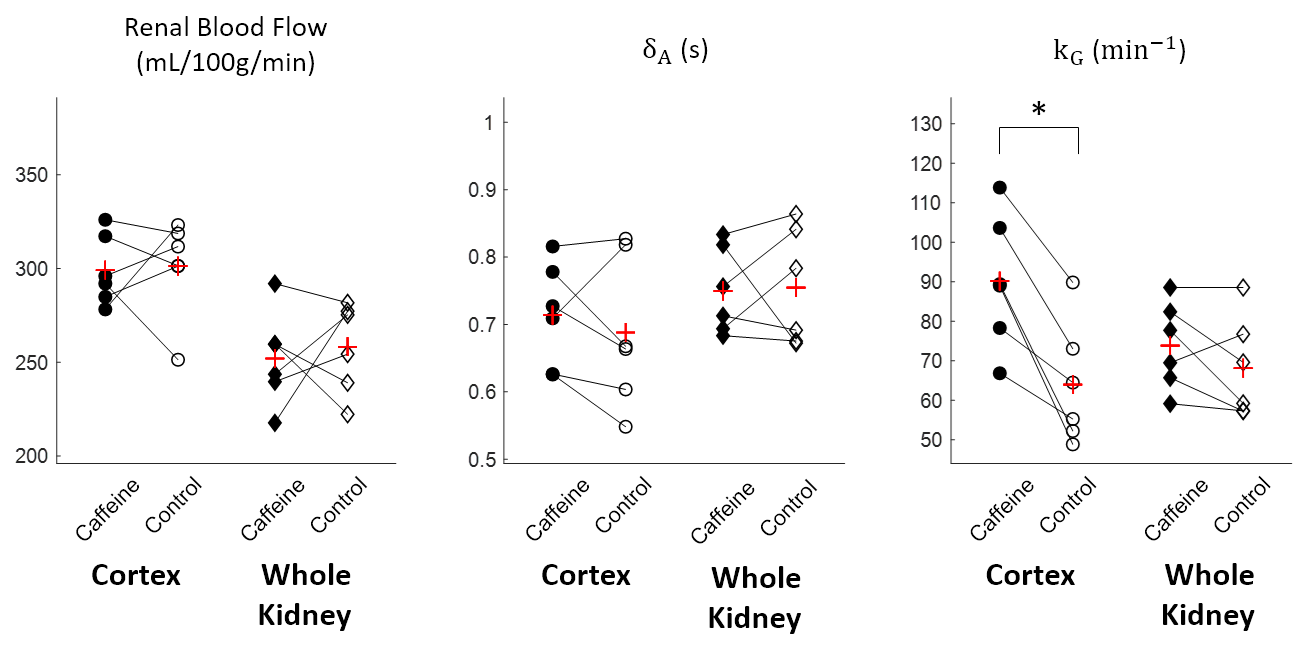
Temporal changes of $$${\Delta}M_{b0}$$$ and $$${\Delta}M_{b50}$$$, and estimated parameter maps are shown in Figure3 and Figure4. Perfusion-weights and blood transfer rates in renal cortex were higher than those in renal medulla, in agreement with the previous studies.Figure5 compares estimated values between the caffeine and the control studies. In the renal cortex, there was no significant difference in RBF(caffeine299.1±18.7mL/100g/min, control:301.3±26.0mL/100g/min) and ATT(caffeine:0.71±0.08s, control:0.69±0.11s). But $$$k_G$$$ in the caffeine study was significantly higher than that in the control study(caffeine:90.2±16.9min-1, control:64.0±15.4min-1; p=0.0206). This finding coincides with previous studies, which showed no changes in estimated renal plasma flow but significantly increased GFR in the caffeine study5,6. Also, caffeine is known to increase GFR by antagonizing adenosine receptors in afferent arterioles. Therefore, distinct from the RBF, the $$$k_G$$$ is sensitive to the caffeine-induced increase in glomerular blood transfer rate, which in turn increases GFR.
Conclusion
We proposed the two components renal perfusion model, which estimates the blood transfer rate from afferent arterioles to the glomerulus. Mean cortical $$$k_G$$$ value was measured in the caffeine and the control studies separately, and it was significantly higher for the caffeine study. The proposed method is promising in that the $$$k_G$$$ is sensitive enough to measure changes in glomerular blood transfer rate mediated by caffeine, which antagonizes adenosine in afferent arterioles, in agreement with the previous GFR studies. Further studies on renal dysfunctions would be attractive to evaluate potential use of $$$k_G$$$ as a non-invasive quantitative measure of renal function.Acknowledgements
No acknowledgement found.References
1. Bokacheva, Louisa, et al. "Estimates of glomerular filtration rate from MR renography and tracer kinetic models." Journal of Magnetic Resonance Imaging: An Official Journal of the International Society for Magnetic Resonance in Medicine 29.2 (2009): 371-382.
2. Ahn, Hyun-Seo, et al. “Quantification of blood-brain barrier water permeability and arterial blood volume with multi-slice multi-delay diffusion-weighted ASL.” Proceedings of ISMRM (2020): Vol.470.
3. Ahn, Hyun-Seo, et al. "Assessment of renal perfusion in transplanted kidney patients using pseudo-continuous arterial spin labeling with multiple post-labeling delays." European Journal of Radiology 130 (2020): 109200.
4. Buxton, Richard B., et al. "A general kinetic model for quantitative perfusion imaging with arterial spin labeling." Magnetic resonance in medicine 40.3 (1998): 383-396.
5. Passmore, A. P., G. B. Kondowe, and G. D. Johnston. "Renal and cardiovascular effects of caffeine: a dose–response study." Clinical Science 72.6 (1987): 749-756. 6. Shirley, D. G., S. J. Walter, and F. H. Noormohamed. "Natriuretic effect of caffeine: assessment of segmental sodium reabsorption in humans." Clinical Science 103.5 (2002): 461-466.
Figures