0068
Choroid plexus function and structure across the lifespan as evaluated using perfusion-weighted MRI: implications for glymphatic dysfunction1Department of Neurology, Vanderbilt University Medical Center, Nashville, TN, United States, 2Department of Radiology and Radiological Sciences, Vanderbilt University Medical Center, Nashville, TN, United States, 3Department of Psychiatry and Behavioral Sciences, Vanderbilt University Medical Center, Nashville, TN, United States
Synopsis
The choroid plexus (ChP) has gained recent attention due to its potential functional relevance for cerebral glymphatic circulation. Here, a novel arterial spin labelling sequence and deep learning algorithm were applied to quantify ChP volume, perfusion, and volumetric flow across the healthy lifespan and in neurodegenerative participants with Parkinson’s disease (PD) to test the hypotheses that ChP hypertrophy and hypoperfusion are associated with increasing age and neurodegeneration. ChP volume increased with age, whereas perfusion decreased with age (p<0.01). In PD, ChP volumetric flow increases were more pronounced relative to age-matched healthy controls, consistent with compensatory stimulation of cerebrospinal fluid production.
Introduction
The purpose of this work is to utilize a novel arterial spin labelling (ASL) sequence and deep learning segmentation approach to quantify choroid plexus (ChP) perfusion across the lifespan in healthy controls (HCs) and to test hypotheses regarding the role of ChP hypertrophy in older adults with and without neurodegenerative disease.The ChP is located in each of the four brain ventricles and is responsible for cerebrospinal fluid (CSF) production1,2. ChP has gained recent attention in light of its potential relevance to waste clearance through the cerebral glymphatic system. Recent work has shown that ASL can be re-parametrized to quantify ChP perfusion3,4, ChP can be segmented using deep learning algorithms5, ASL can provide information on blood-CSF water exchange6, and ChP adjusts in response to angiogenesis and anemia3,7. However, this work has focused on young adults or anesthetized animals, and it remains unclear how ChP structure and function change with healthy aging and neurodegeneration. Here, we apply ASL in HCs across the lifespan and older adults with Parkinson’s disease (PD) to test hypotheses that (1) ChP volume increases and perfusion decreases in healthy aging, and (2) ChP volumetric flow increases in PD.
Methods
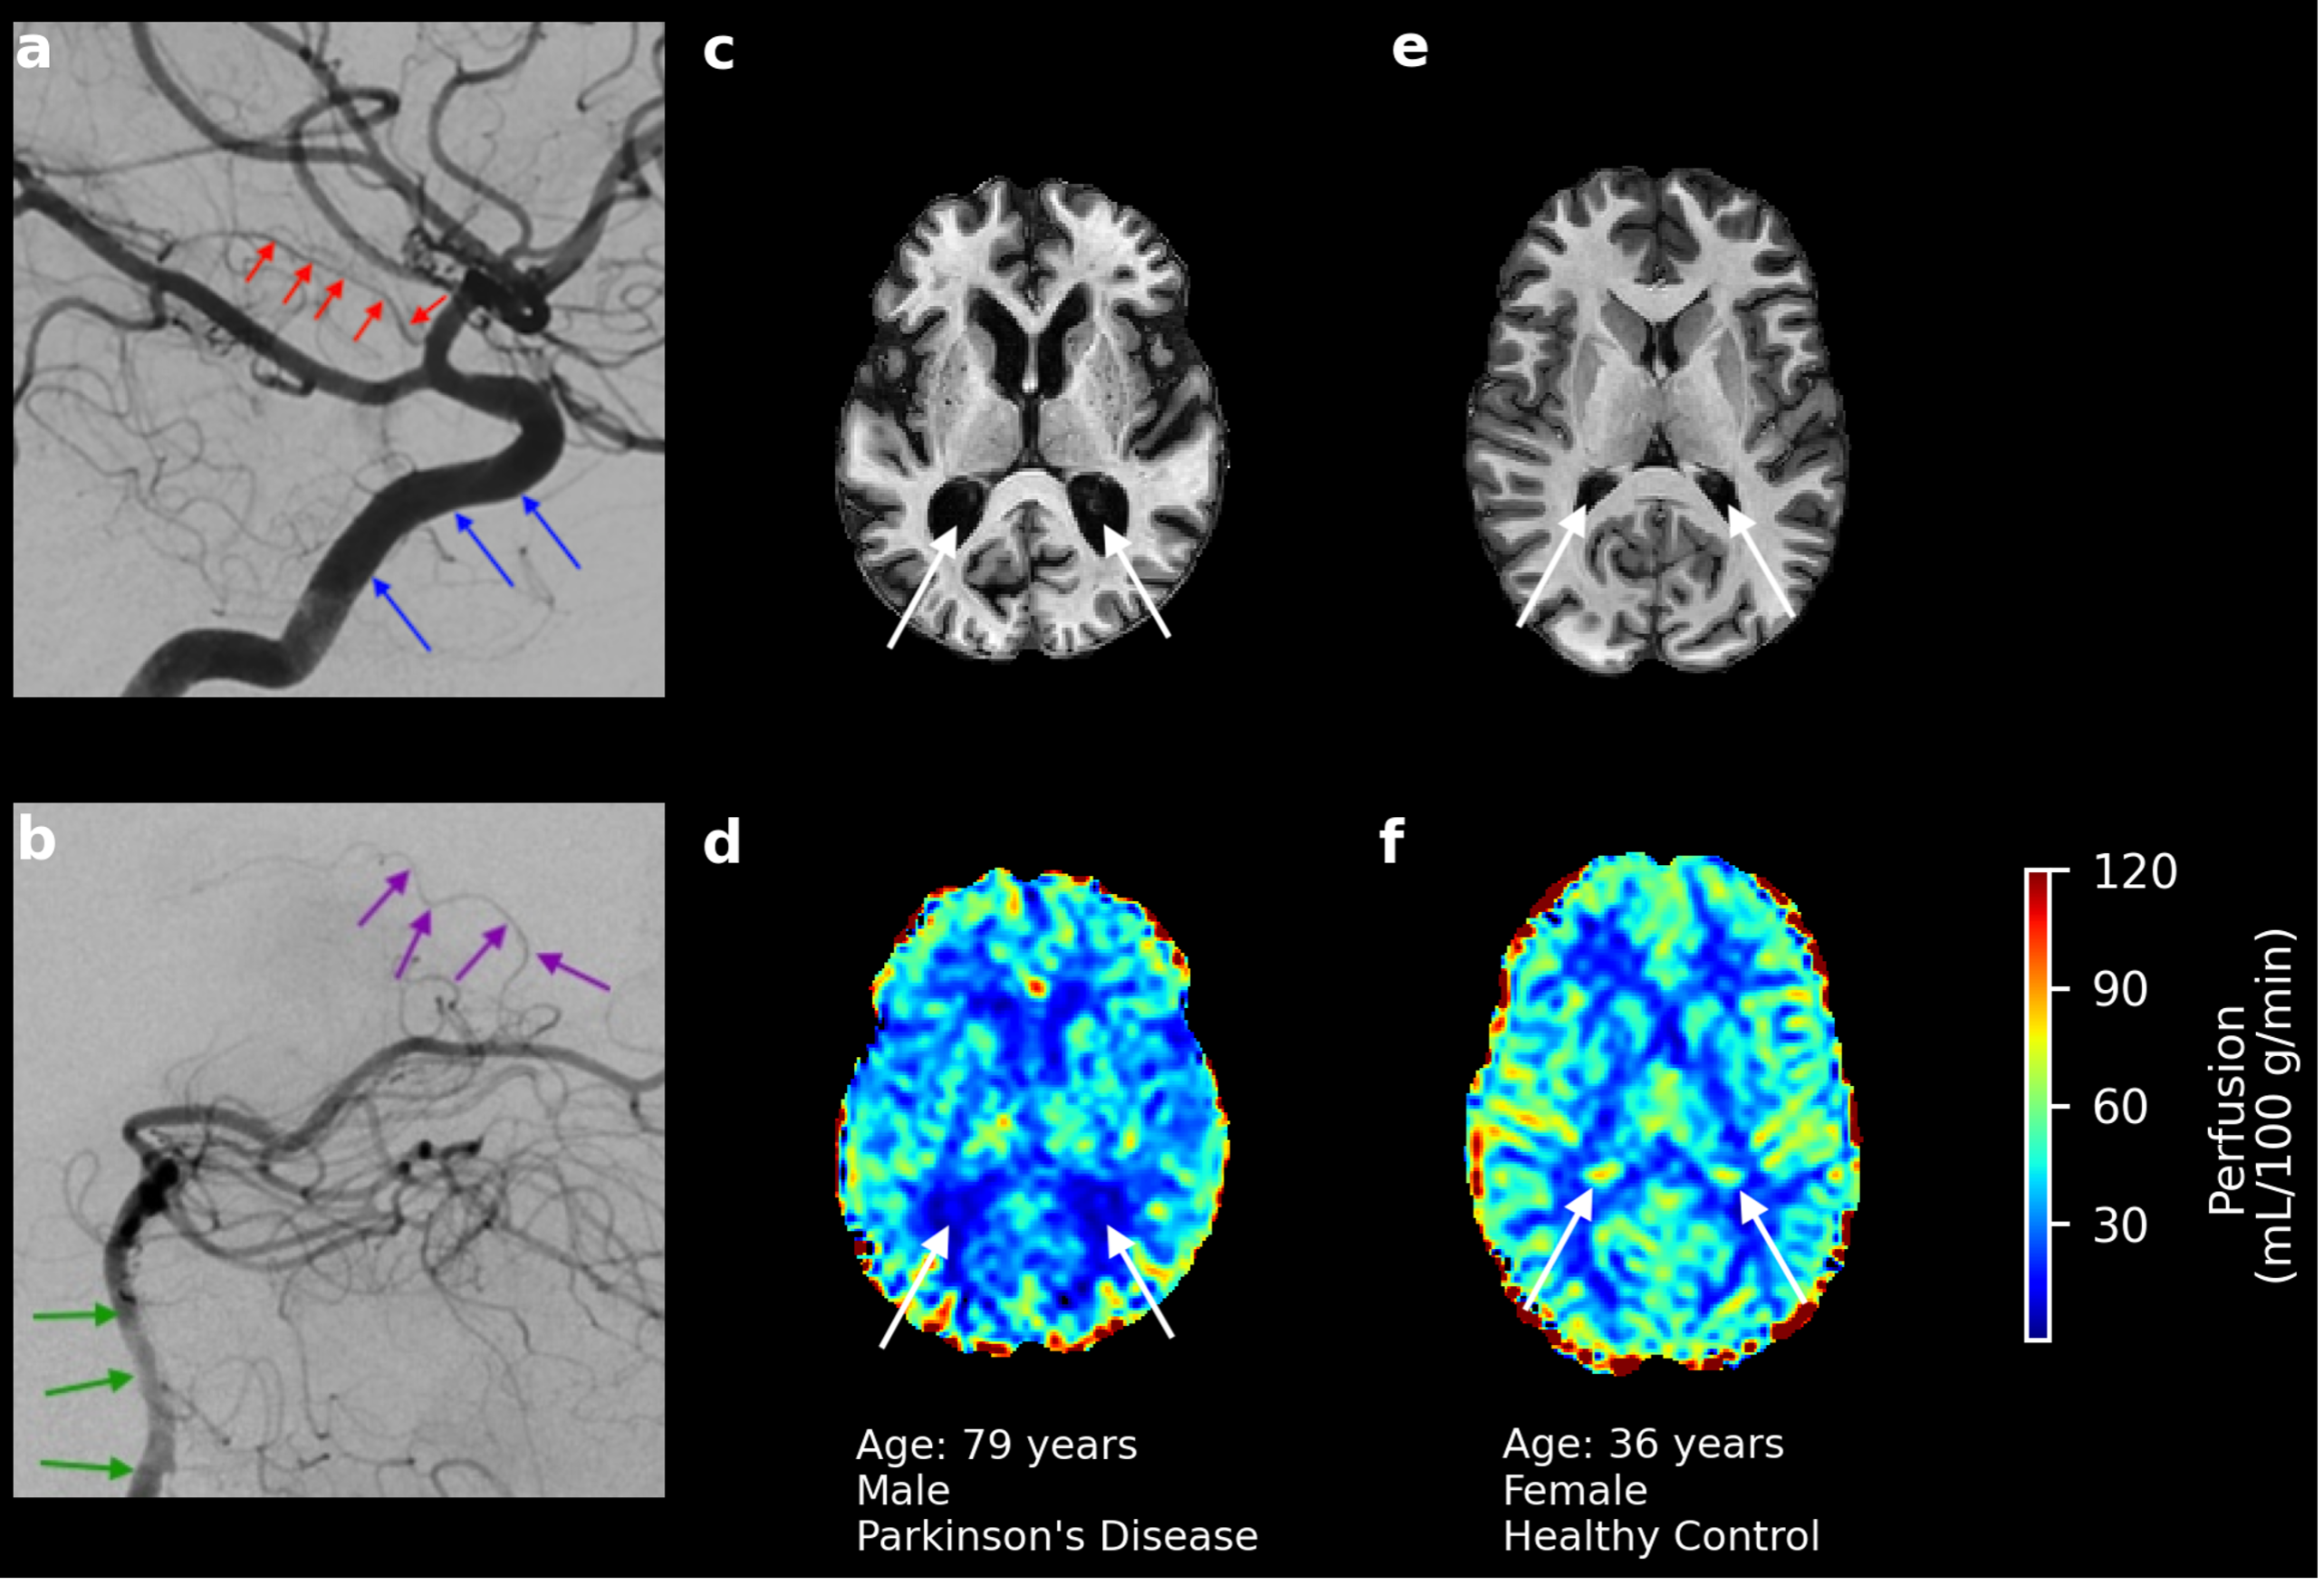
All participants provided informed, written consent and were scanned at 3T (Philips Healthcare) using body-coil radiofrequency transmission and 32-channel phased-array reception. Healthy adults and older adults with PD were enrolled.Acquisition. Images acquired for ChP segmentation were: (i) T1-weighted MPRAGE (spatial resolution=1mm3 isotropic) and (ii) T2-weighted FLAIR (spatial resolution=0.6x0.6x5mm3). Perfusion-weighted images were acquired using pseudo-continuous ASL (pCASL): TR/TE=4550/13ms, label duration=1800ms, label delay=2000ms, spatial resolution=3x3x7mm3. As the ChP is perfused by anterior and posterior choroidal arteries, labeling was performed through the vertebral and internal carotid arteries (Figure 1a,b).
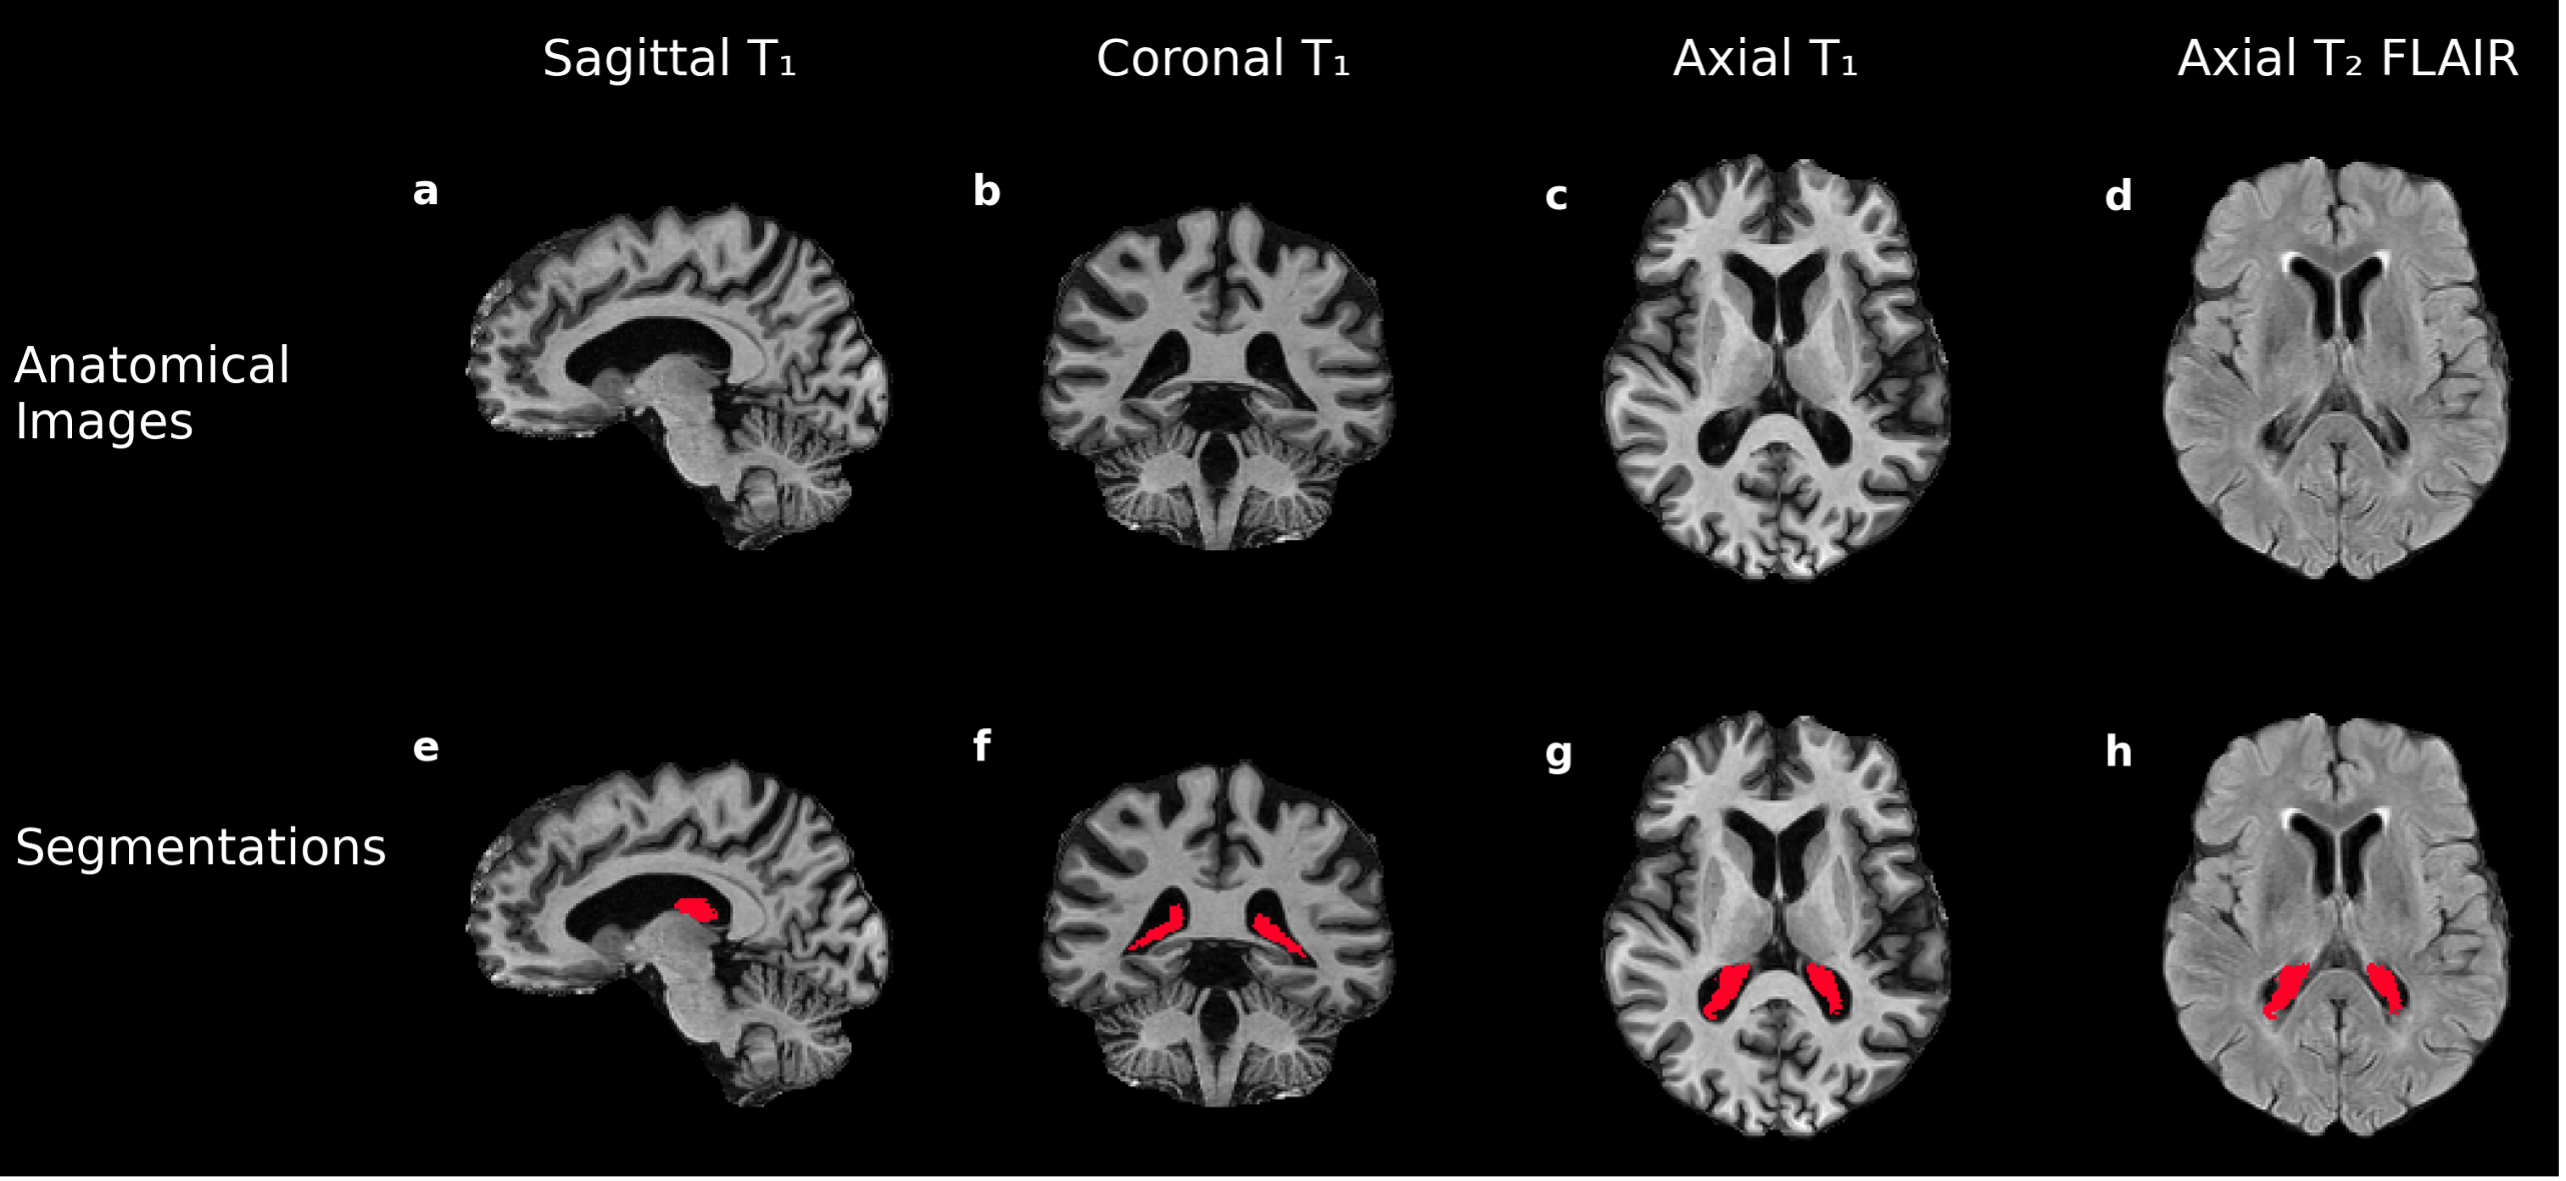
Hypothesis (1). A deep learning model with 3-D U-Net architecture8 was trained using T1-weighted and co-registered T2-weighted FLAIR images (Figure 2a-d). ChP volume was calculated from segmentations in the body and atria of the lateral ventricles (Figure 2e-h). Perfusion maps from processed pCASL acquisitions were co-registered to T1-weighted images, and the ChP segmentation was applied to each perfusion map to calculate mean ChP perfusion (ml/100g/min). Generalized linear models were applied using ChP volume fraction of total intracranial volume (TICV) and mean ChP perfusion as separate dependent variables and gray matter (GM) perfusion, age and sex as independent variables (Wald-test significance criteria: p<0.05).
Hypothesis (2). ChP volumetric flow normalized by TICV (mL blood/mL tissue/min) was calculated via the formula described by Zhao et al4. ChP density was determined by dividing the ChP water density in the M0 image from the pCASL acquisition by mean water content of brain tissue (w=0.847g H2O/g tissue)9. Generalized linear models were applied using normalized ChP volumetric flow as the dependent variable and GM perfusion, age, and sex as independent variables (Wald-test significance criteria: p<0.05).
Results
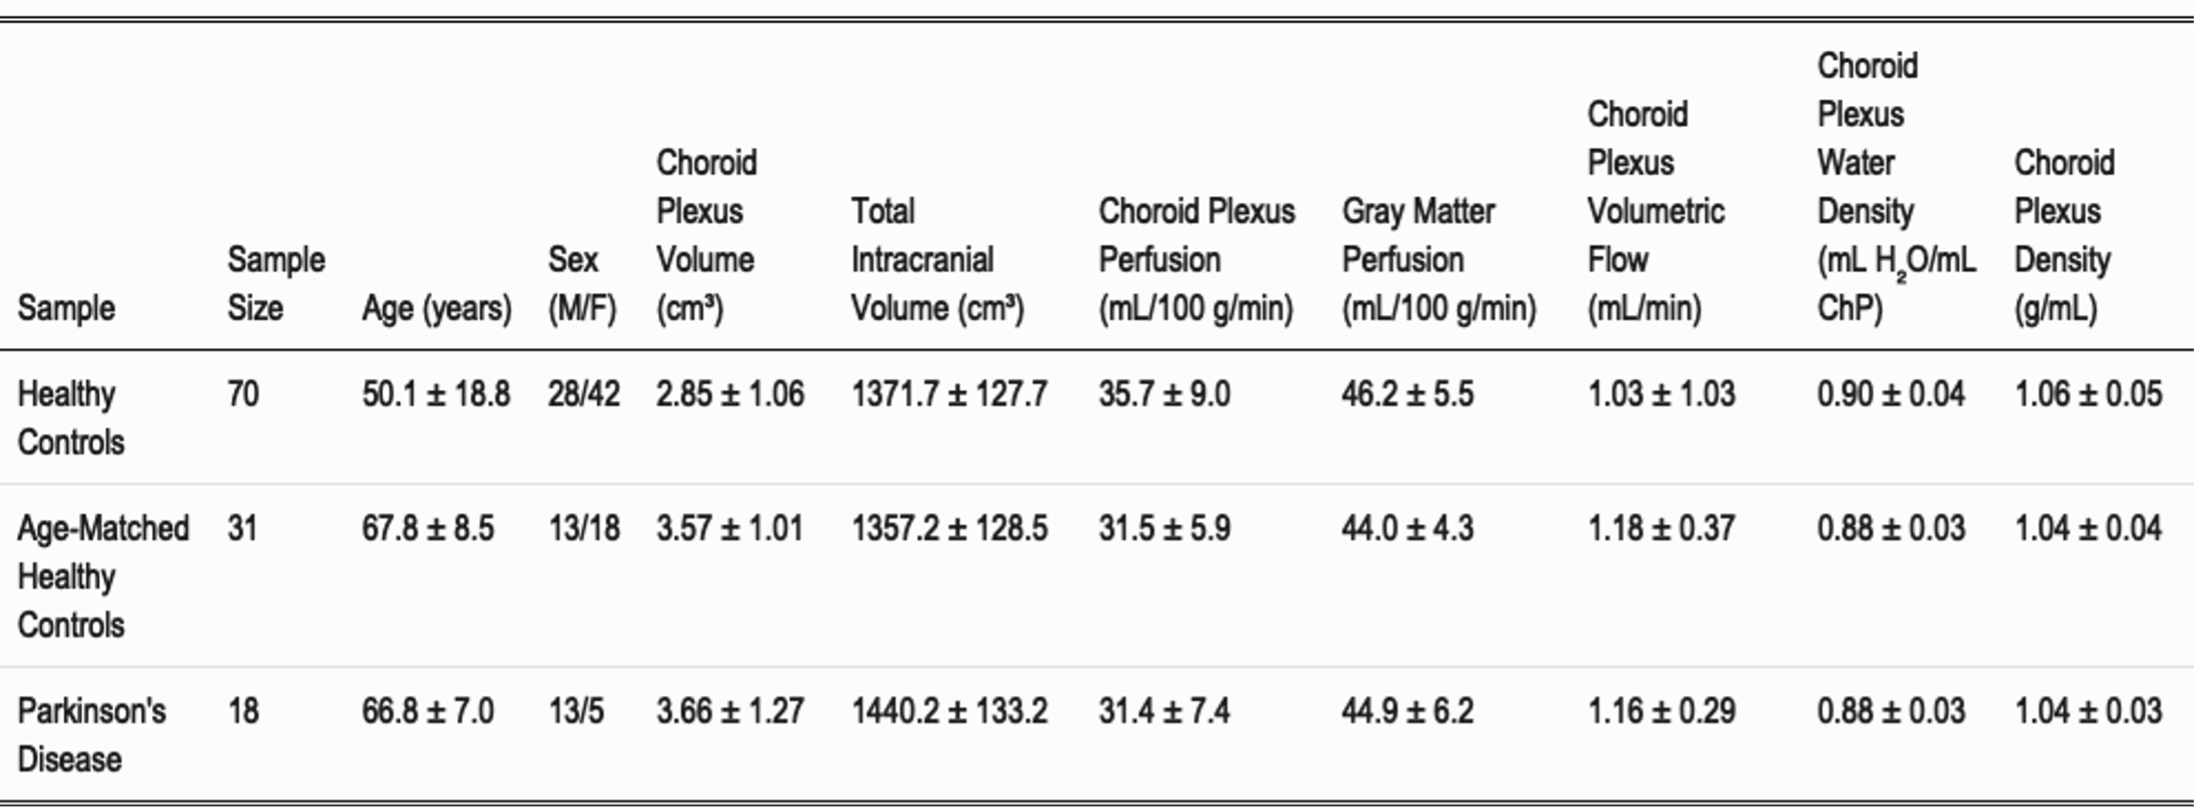
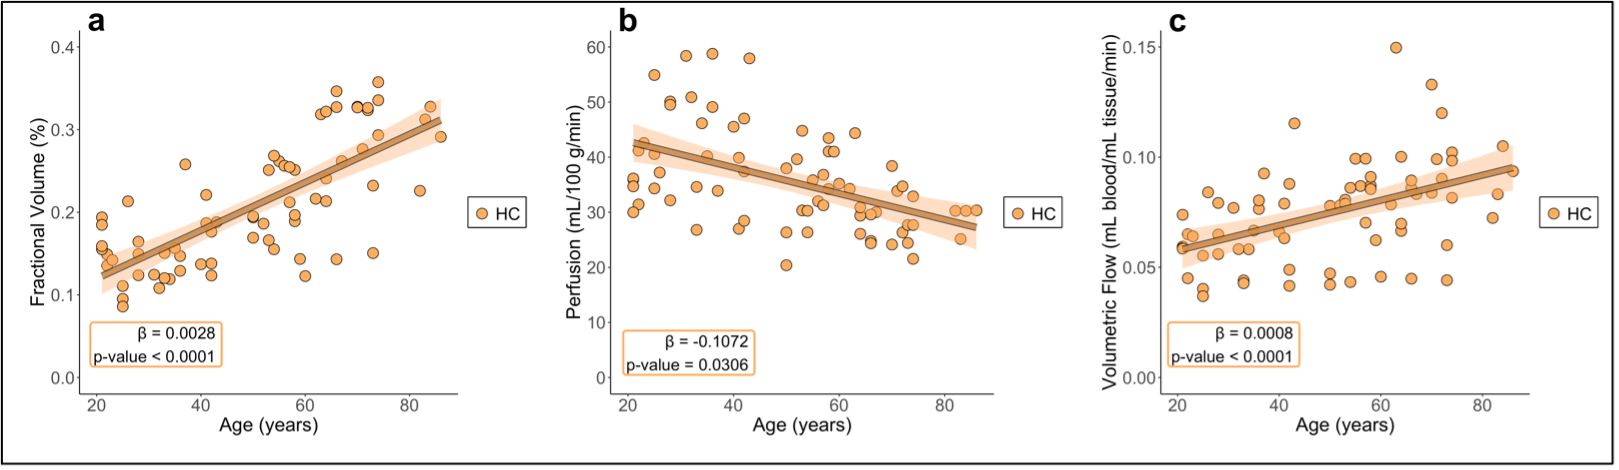
Participants (Table 1) consisted of 70 HCs (age=50.1±18.8 years) and 18 PD patients (age=66.8±7.0 years). Regression analyses for Hypotheses (1-2) are summarized in Figures 3-4.Hypothesis (1). In HCs, age was positively related to ChP volume (p-value<0.0001), inversely related to ChP perfusion (p-value=0.0306), and positively related to ChP volumetric flow (p-value<0.0001). In HCs, GM perfusion was positively related to ChP perfusion (p-value<0.0001) and volumetric flow (p-value=0.0022).
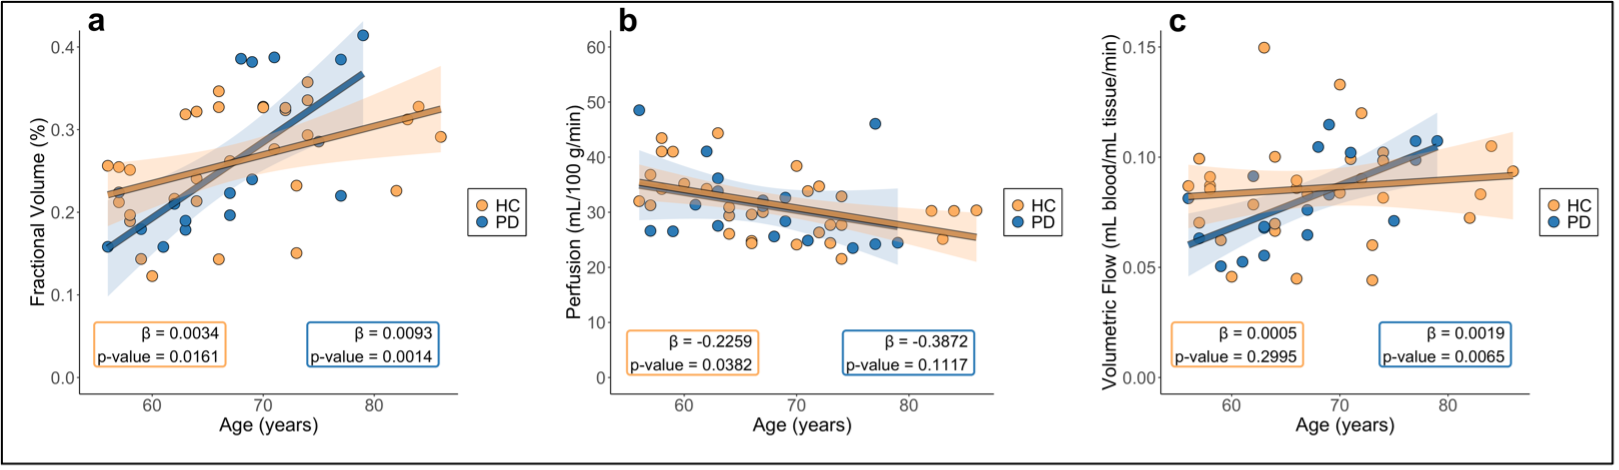
Hypothesis (2). Age was positively related to ChP volume (age-matched HCs: p-value=0.0161; PD: p-value=0.0014). Age was inversely related to ChP perfusion across age-matched HCs (p-value=0.0306) but unrelated in PD (p-value=0.1117). Age and ChP volumetric flow were non-significantly related in age-matched HCs (p-value=0.2995) but directly related in PD participants (p-value=0.0065). GM perfusion was directly related to ChP perfusion (age-matched HCs: p-value=0.0021; PD: p-value=0.0300).
Discussion
To our knowledge, this is the first report of age-related increases in ChP volume. Additionally, mean ChP perfusion was observed to decrease with age in HCs, but this trend was non-significant for PD participants. ChP volumetric flow increased with age independently of GM perfusion in PD participants only. PD is a known proteinopathy associated with α-synuclein accumulation10. These findings could point toward a compensatory function of the ChP in PD to stimulate CSF production and downstream glymphatic waste clearance. Alternatively, the increase in blood supply to ChP could reflect a functional inefficiency that develops as the ChP hypertrophies, in which more blood is needed to maintain adequate CSF production. Findings expand on the new and growing literature of ChP function and structure and provide evidence that interrogation of this structure using non-invasive MRI may provide information on functional sequelae of neurodegenerative disorders.Conclusion
A re-parametrized ASL approach and deep learning segmentation algorithm were applied to evaluate ChP volume, perfusion, and volumetric flow in HCs across the lifespan and neurodegenerative participants with PD. ChP volume increased with age across all cohorts, mean ChP perfusion decreased with age in HCs, and ChP volumetric flow increased with age in PD subjects. These results elucidate how aging and neurodegeneration may differentially affect ChP function and structure, which may have relevance for glymphatic circulatory dysfunction.Acknowledgements
We acknowledge the funding sources for this study (NIH/NIA 501AG062574 and NIH/NCCIH 1R01AT011456) and the Vanderbilt University Institute of Imaging Science for their assistance during this study. We also thank Ryan Robison and Chuck Nockowski for their help.References
1. Kadel KA, Heistad DD, Faraci FM. Effects of endothelin on blood vessels of the brain and choroid plexus. Brain Res. 1990;518:78–82.
2. Schalk KA, Faraci FM, Heistad DD. Effect of endothelin on production of cerebrospinal fluid in rabbits. Stroke. 1992;23:560–3.
3. Johnson SE, McKnight CD, Lants SK, Juttukonda MR, Fusco M, Chitale R, et al. Choroid plexus perfusion and intracranial cerebrospinal fluid changes after angiogenesis. J Cereb Blood Flow Metab. 2020;40:1658-71.
4. Zhao L, Taso M, Dai W, Press DZ, Alsop DC. Non-invasive measurement of choroid plexus apparent blood flow with arterial spin labeling. Fluids Barriers CNS. 2020;17:58.
5. Zhao L, Feng X, Meyer CH, Alsop DC. Choroid Plexus Segmentation Using Optimized 3D U-Net. 2020 IEEE 17th International Symposium on Biomedical Imaging (ISBI). 2020;381-4.
6. Perera C, Harrison IF, Lythgoe MF, Thomas DL, Wells JA. Pharmacological MRI with Simultaneous Measurement of Cerebral Perfusion and Blood-Cerebrospinal Fluid Barrier Function using Interleaved Echo-Time Arterial Spin Labelling. NeuroImage. 2021;238:118270.
7. Johnson SE, McKnight CD, Jordan LC, Claassen DO, Waddle S, Lee C, et al. Choroid plexus perfusion in sickle cell disease and moyamoya vasculopathy: Implications for glymphatic flow. J Cereb Blood Flow Metab. 2021;41:2699-711.
8. Çiçek O, Abdulkadir A, Lienkamp SS, Brox T, Ronneberger O. 3D U-Net: Learning Dense Volumetric Segmentation from Sparse Annotation. International Conference on Medical Image Computing and Computer-Assisted Intervention. 2016;424–32.
9. Lu H, Golay X, van Zijl PCM. Intervoxel Heterogeneity of Event-Related Functional Magnetic Resonance Imaging Responses as a Function of T1 Weighting. Neuroimage. 2002;17(2):943-55.
10. Abeliovich A, Gitler AD. Defects in trafficking bridge Parkinson’s disease pathology and genetics. Nature. 2016;539:207-16.
Figures