0066
Temporal evolution of diffusion metrics in neonatal brains within the first few weeks postpartum1Radiology, Yale School of Medicine, New Haven, CT, United States, 2Psychiatry and Psychotherapy, Social Neuroscience Lab, Department of Psychiatry and Psychotherapy, Lübeck University, Lübeck, Germany, Lübeck, Germany, 3CLAIM - Charité Lab for Artificial Intelligence in Medicine, Charité Universitätsmedizin Berlin, Berlin, Germany, Berlin, Germany, 4Radiology and Biomedical Imaging, Yale School of Medicine, New Haven, CT, United States, 5Neurology, Yale School of Medicine, New Haven, CT, United States, 6Pediatrics, Yale School of Medicine, New Haven, CT, United States, 7Radiology, Children's Hospital of Pennsylvania, Philadelphia, CT, United States, 8Radiology, University of Pennsylvania, Philadelphia, PA, United States, 9Division of Newborn Medicine, Boston Children's Hospital, Boston, MA, United States, 10Radiology, Boston Children's Hospital, Boston, MA, United States
Synopsis
In this retrospective cohort study, we characterized the age-related topography of quantitative diffusion metric evolution in 569 neonates scanned at our institution. We also studied the temporal rate of these metrics across different regions of the brain. and developed online interactive atlases depicting age-specific normative values of ADC and FA/MD in neonatal brains.
Introduction
Introduction: Magnetic resonance diffusion weighted imaging (DWI) and diffusion tensor imaging (DTI) have been increasingly utilized in the diagnosis and prognostication of neonatal brain injury. DWI sequences can give insight into the cellularity and myelination of brain tissue through the analysis of water molecule diffusibility and the quantification of water diffusion through the generation of apparent diffusion coefficient (ADC) maps. Thus, ADC maps are essential in the detection of ischemic injury in neonates as the limited myelination of neonatal brains can complicate the interpretation of DWI scans alone.1 The microstructural arrangement of white matter in the brain can be further elucidated through the use of DTI sequences.2 Fractional anisotropy (FA) and mean diffusivity (MD) metrics obtained from DTI can also be used to identify developmental anomalies and injury to white matter. Despite the many benefits of these imaging sequences, rapid changes of ADC, FA, and MD values in neonatal brains complicate the interpretation of DWI and DTI scans. Thus, more robust characterization of normative changes of these metrics in neonatal brains is necessary.Methods
In this retrospective cohort study, we analyzed the medical and imaging records of all neonates (0-3 months) born since 2013 at our institution. Subjects whose MRI scans were screened as normal upon prior clinical report and visual inspection were included in our study. DWI scans (with associated ADC maps) and DTI scans (with associated FA/MD maps) were then coregistered to standard MNI-152 brain space. Using the “randomise” tool in the FSL library we applied voxel-wise general linear models (GLM) to analyze the age-related changes of ADC values throughout the brain.3 The tract based spatial statistics (TBSS) toolbox in FSL was used to conduct similar analyses for DTI metrics specifically along white matter tracts in the brain.4 The temporal rate of age-related changes in ADC, FA, and MD values across 0.6 cm cubic voxels was calculated by applying linear regression models. The mean and standard deviation of diffusion metric values in each of these 0.6cm cubic voxels were calculated to develop age adjusted normative atlases of diffusion MRI metric values across the neonatal brain.Results
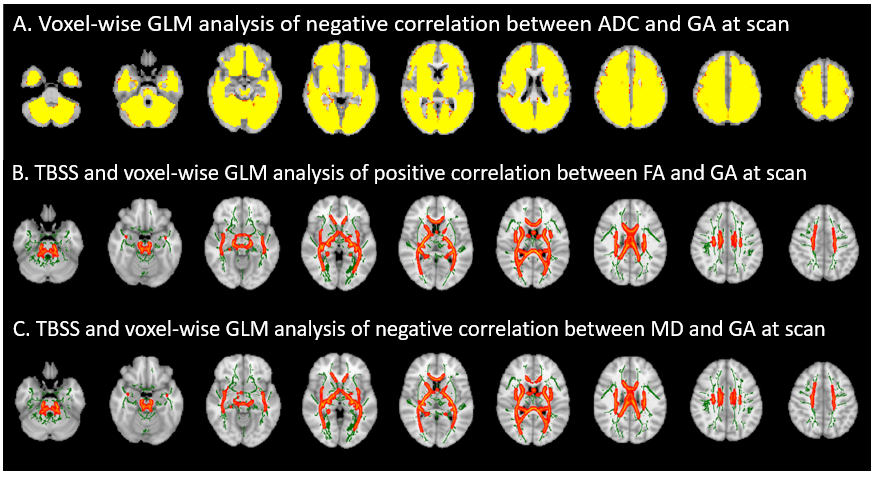
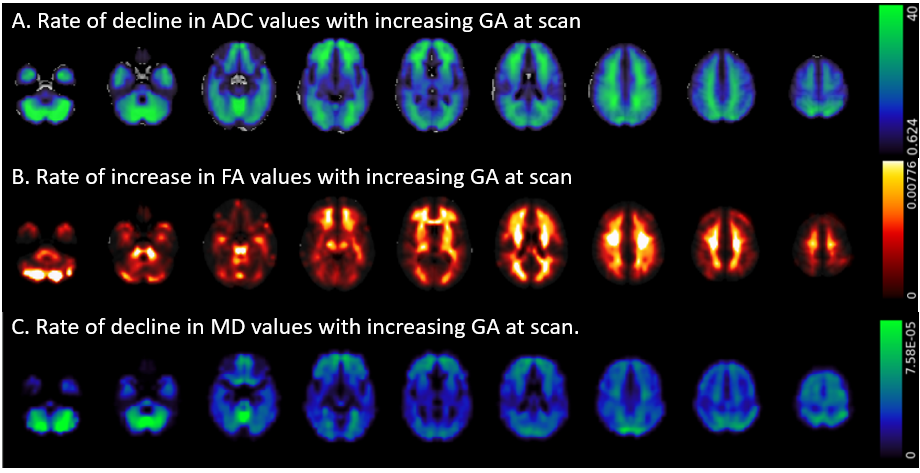
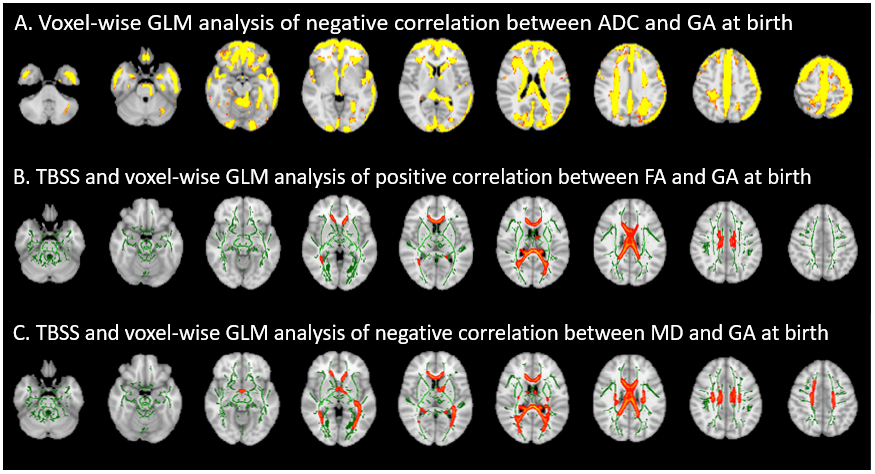
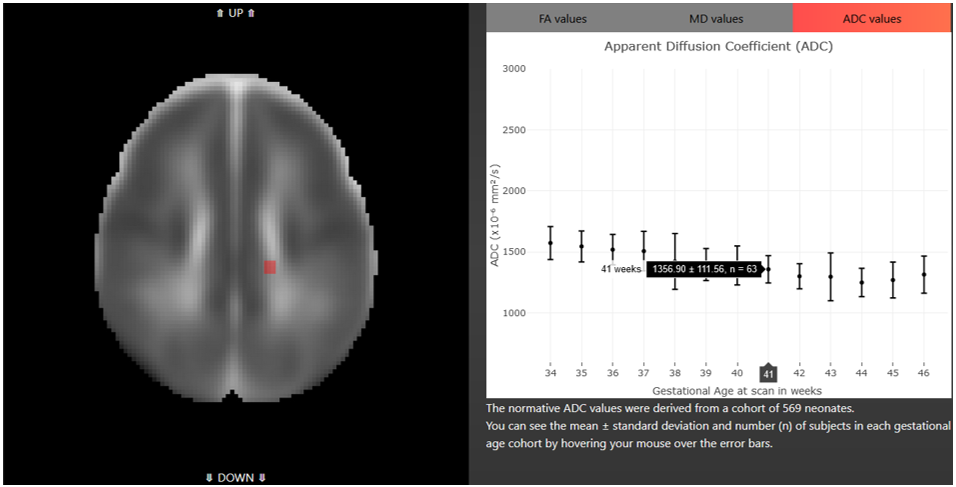
569 neonates with DWI scans, of whom 162 also had DTI scans were included in our study. The mean±SD gestational age at scan for the DWI cohort was 39.67±2.79 weeks and for the DTI cohort was 38.53±1.94 weeks. Increasing gestational age at scan was associated with significant reduction of ADC values throughout the brain and significant increase of FA and reduction of MD values in the bilateral superior longitudinal fasciculus, corpus callosum, corticospinal tracts (from corona radiata, through internal capsule, and into the brainstem), and external capsule. (Figure 1). The highest temporal rate of decline in ADC values was seen in the subcortical white matter, centrum semiovale, and cerebellar white matter and vermis. The highest temporal rate of increase in FA values was seen in the subcortical white matter, corticospinal tract, and cerebellar white matter and the highest temporal rate of decrease in MD values was seen in the juxtacortical white matter of the frontal/parietal lobes and the cerebellar white matter and vermis. (Figure 2). After correcting for gestational age at scan, increasing gestational age at birth was associated with significant reduction of ADC values in the cortical edges and corpus callosum and significantly higher FA and lower MD values in the corpus callosum (Figure 3). Online interactive atlases (Figure 4) displaying age-specific normative values of ADC (34.5-46.5 weeks), and DTI metrics (35-41 weeks) were developed (https://www.brain-diffusion-atlas.com/).Discussion
As expected, we found widespread decline in ADC values with increasing gestational age at time of scan across neonatal brains. The highest rates of decline in ADC values correlated topographically to the regions of fastest increase in FA and decline in MD values, indicating that the decline in ADC values is likely related to the maturation and myelination of white matter tracts. The lower temporal rate of ADC decline observed in the cortex and basal ganglia on the other hand is possibly due to increase is cellularity of these regions with increasing age. Our observation of increasing gestational age at birth being associated with lower ADC values in the cortical edges and corpus callosum as well as higher FA values and lower MD values in the corpus callosum suggest that these regions are most susceptible to delays in maturation of white matter tracts due to prematurity. Additionally, those areas where gestational age at scan alone regardless of age at birth are where our normative atlases of diffusion metrics are most generalizable for clinical use.Conclusion
Several prior studies have attempted to generate such atlases of normative diffusion MRI metrics in neonatal brains. However, these studies were limited by the low sample sizes, examination of narrow age windows, or lack of organized age group stratification. These limitations are addressed in our atlases by the use of a large number of neonates across a wide range of gestational ages that have been consistently stratified by gestational age at scan week. We publicly share our atlases to potentially aid clinicians in identification of subtle developmental abnormalities and parenchymal injury through the quantitative assessment of DWI and DTI scans.Acknowledgements
No acknowledgement found.References
1. Bydder, G. M.; Rutherford, M. A., Diffusion-weighted imaging of the brain in neonates and infants. Magnetic resonance imaging clinics of North America 2001, 9 (1), 83-98.
2. Sundgren, P.; Dong, Q.; Gomez-Hassan, D.; Mukherji, S.; Maly, P.; Welsh, R., Diffusion tensor imaging of the brain: review of clinical applications. Neuroradiology 2004, 46 (5), 339-350.
3. Payabvash, S.; Palacios, E. M.; Owen, J. P.; Wang, M. B.; Tavassoli, T.; Gerdes, M.; Brandes-Aitken, A.; Marco, E. J.; Mukherjee, P., Diffusion tensor tractography in children with sensory processing disorder: Potentials for devising machine learning classifiers. NeuroImage: Clinical 2019, 23, 101831.
4.Smith, S. M.; Jenkinson, M.; Johansen-Berg, H.; Rueckert, D.; Nichols, T. E.; Mackay, C. E.; Watkins, K. E.; Ciccarelli, O.; Cader, M. Z.; Matthews, P. M.; Behrens, T. E., Tract-based spatial statistics: voxelwise analysis of multi-subject diffusion data. NeuroImage 2006, 31 (4), 1487-505.
Figures