0059
The influence of cystathionine on neurochemical quantification in brain tumor in vivo magnetic resonance spectroscopy1Center for Neuroimaging Research - CENIR, Paris Brain Institute - ICM, Paris, France, 2UMR S 1127, Inserm U 1127, CNRS UMR 7225, Sorbonne University, Paris, France, 3Center for Magnetic Resonance Research, Department of Radiology, University of Minnesota, Minneapolis, MN, United States, 4Department of Radiology, Neuroradiology Unit, ASST Spedali Civili University Hospital, Brescia, Italy, 5Pathology Unit, Department of Molecular and Translational Medicine, Brescia University, Brescia, Italy, 6Department of Neuroradiology, Pitié Salpêtrière hospital, Paris, France, 7Department of Neurology 2, Pitié Salpêtrière hospital, Paris, France
Synopsis
We reported the ability of PRESS to detect cystathionine in vivo in patients with glioma and the effect of the omission of cystathionine on the quantification of the full neurochemical profile. We showed that the omission of cystathionine from analysis leads to severe biases on the quantification of other metabolites involved in cancer metabolism, e.g., aspartate, betaine, citrate, GABA and serine. Because cystathionine was shown to accumulate preferentially in gliomas with 1p/19q codeletion, omission of this metabolite may lead to the wrong evaluation of other metabolic changes in these tumors.
Introduction
MRS shows great promise for the noninvasive investigation of abnormal metabolic changes in brain tumors and for the identification of tumor genetic subtypes in vivo. Since the discovery of isocitrate dehydrogenase (IDH) mutations in gliomas1,2, several molecules other than N-acetyl aspartate (NAA), choline containing compounds (tCho) and lactate have been shown to be detectable in vivo by MRS and identified to play crucial roles in the reprogramming of cancer cell metabolism. These include, D-2-hydroxyglutarate (2HG)3,4, citrate5,6, and glycine7. Recently, we reported the first detection of cystathionine in gliomas by edited MRS8. Cystathionine was not detectable in healthy tissue and was therefore proposed as novel noninvasive marker of tumor tissue. In addition, cystathionine was found to be present at significantly higher concentrations in IDH-mutated gliomas with 1p/19q codeletion compared to their non-codeleted counterparts9. In this study, we evaluated the ability of a PRESS sequence (optimized for 2HG detection) for cystathionine detection and reported the effect of the omission of cystathionine on the quantification of the full neurochemical profile, thus highlighting the importance of including this metabolite in the spectral fitting of in vivo tumor MRS data.Methods
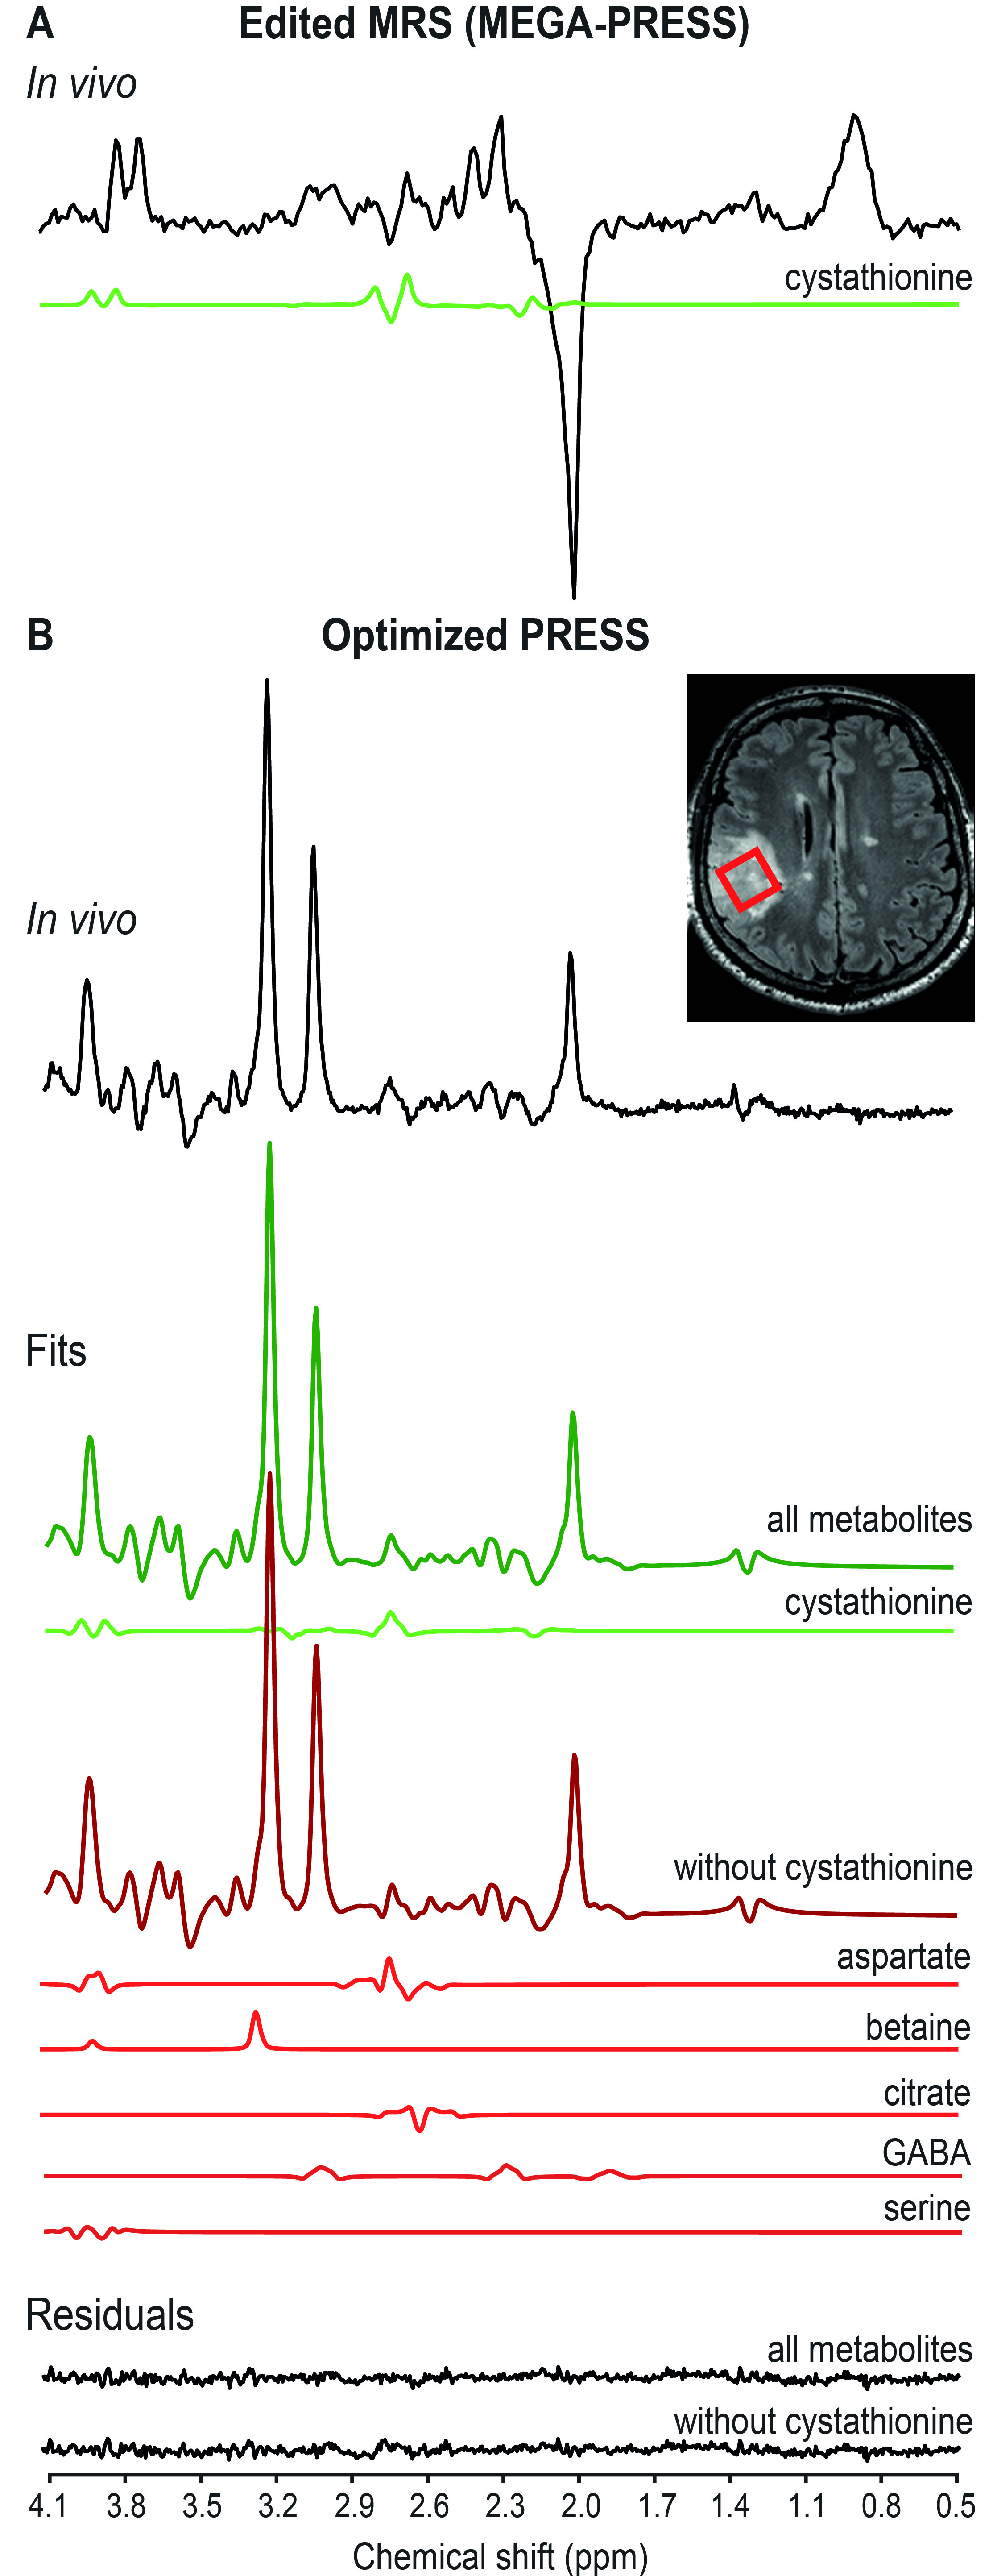
Human subjects: Twenty-three subjects (17 males, median age: 41 years) with gliomas were included in the study (1 IDH wild-type and 22 IDH-mutated, of which 14 1p/19q codeleted, 7 1p/19q intact, 1 with unknown codeletion status).MR acquisitions: The subjects were retrospectively selected based on the presence of the cystathionine signal in the in vivo edited MR spectrum (Figure 1A), assessed by two expert MR spectroscopists, and the availability of both MEGA-PRESS and PRESS acquisitions. Acquisitions were performed at 3 T. 3D FLAIR images were acquired to position the spectroscopic voxel of interest (VOI) in the glioma. MR spectra were acquired using single-voxel spectral editing MEGA-PRESS (TR = 2 s, TE = 68 ms, 128 pairs of averages) and PRESS sequences (TR = 2.5 s, TE = 97 ms, 128 averages). Unsuppressed water scans were acquired from the same VOI for metabolite quantification and eddy current corrections using the same parameters as water suppressed spectra.
Post-processing: Single-shots were frequency and phase aligned in Matlab using the tCho signal at 3.22 ppm. All spectra were analyzed using LCModel and a simulated basis sets. The basis set used for MEGA-PRESS included 2HG, cystathionine, γ-aminobutyric acid (GABA), glutamate, glutamine, glutathione, NAA, N-acetylaspartylglutamate (NAAG). The basis set for PRESS included 2HG, alanine, ascorbate, aspartate, betaine, citrate, cystathionine, creatine, cysteine, ethanolamine, GABA, glucose, glutamate, glutamine, glutathione, glycerophosphorylcholine, glycine, myo-inositol, lactate, NAA, NAAG, phosphorylcholine, phosphorylethanolamine, scyllo-inositol, serine, succinate, taurine and threonine. For the PRESS data, the LCModel analysis was repeated twice, with and without cystathionine in the basis set. Metabolites that were quantified from PRESS data with Cramér-Rao Lower Bound (CRLB) < 50% for more than half of the subjects were included in the statistical analysis.
Results
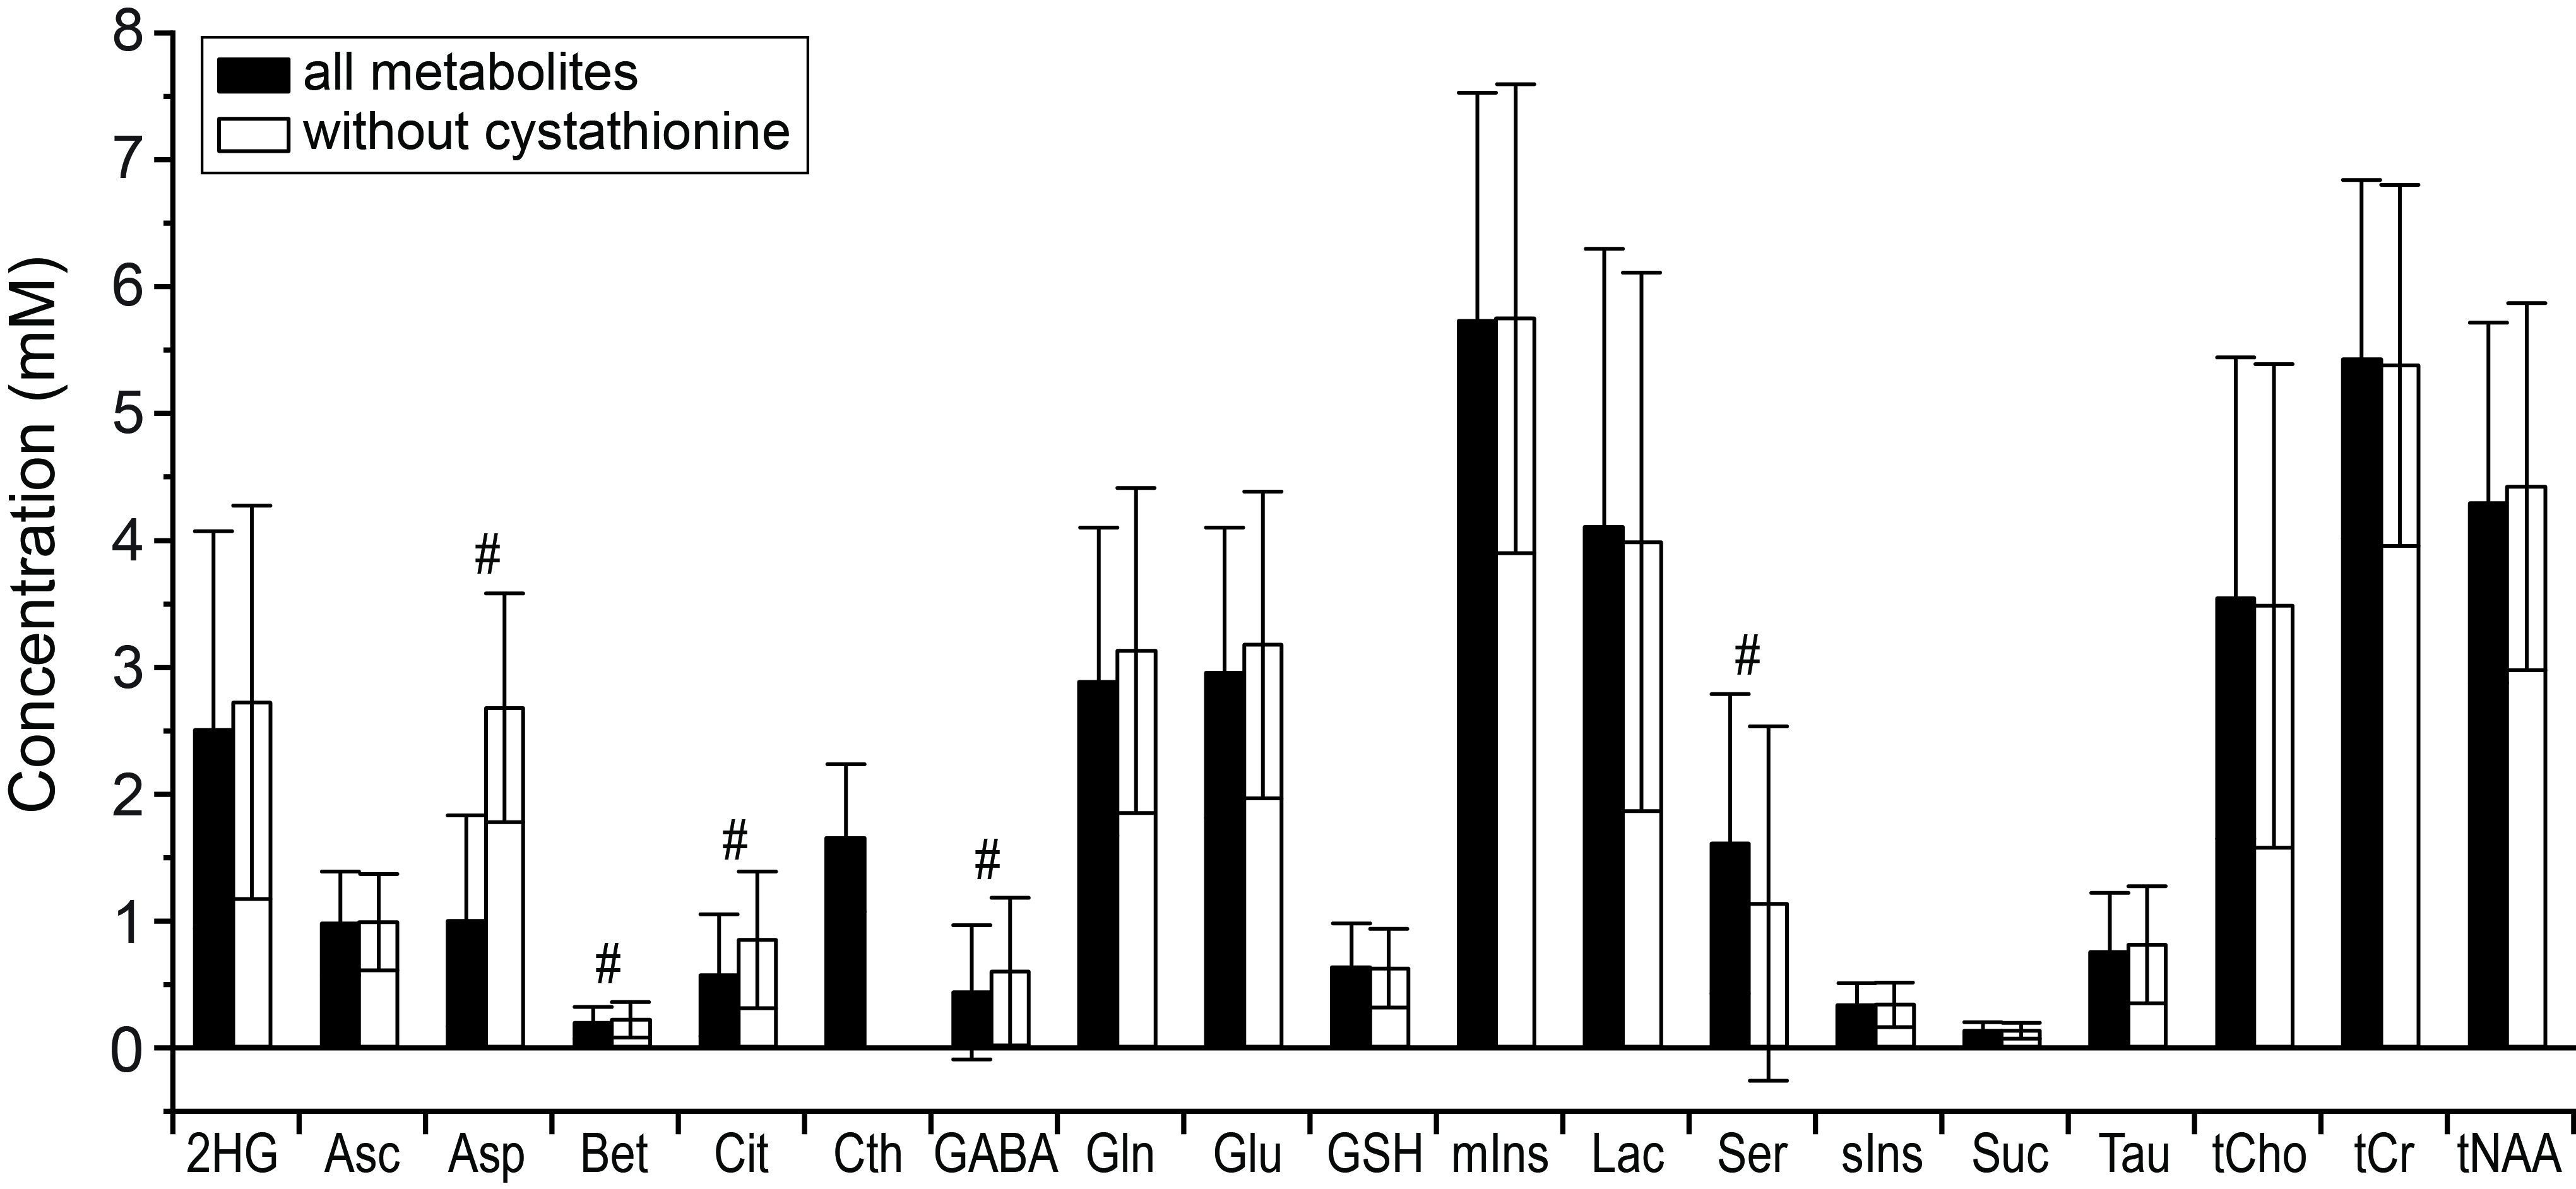
An example of in vivo difference spectrum is shown in Figure 1A, together with the cystathionine component fitted with LCModel. The cystathionine signal at 2.72 ppm can be easily identified due to the absence of overlap with other metabolites and very characteristic spectral pattern. The mean cystathionine concentration (± SD) was 2.97 ± 0.99 mM and the associated mean CRLB (± SD) was 13 ± 6 %. Figure 1B shows an example of an in vivo spectrum acquired using the optimized PRESS, together with cystathionine fitted with LCModel, the fits derived with and without cystathionine in the basis set, and the corresponding residuals. Nineteen metabolites, including cystathionine, were quantified with CRLB < 50% for more than half of the subjects. The mean cystathionine concentration estimated using the optimized PRESS sequence was 1.64 ± 0.58 mM, with mean CRLB = 14 ± 6 %. Cystathionine concentrations obtained from optimized PRESS spectra showed a significant correlation with those obtained from MEGA-PRESS data (r = 0.58, p = 0.004). Figure 2 shows the metabolite concentrations obtained from optimized PRESS data with and without cystathionine in the LCModel analysis. The metabolites that were most affected by the cystathionine omission were aspartate, betaine, citrate, GABA and serine, showing a percent difference in concentration between the two methods higher than 10% and p < 0.0028 (0.05/19). Aspartate, betaine, citrate, GABA and serine contributions when cystathionine was not part of the basis set are shown in Figure 1B.Discussion and conclusions
PRESS reliably detected cystathionine in all patients with CRLB ≤ 30%. The omission of cystathionine from the analysis caused significant differences in the quantification of several metabolites, aspartate being the most affected. Because cystathionine was shown to accumulate preferentially in gliomas with 1p/19q codeletion9, omission of this metabolite may lead to the wrong evaluation of other metabolic changes in these tumors. The metabolites that were most affected by the omission of cystathionine from the spectral analysis were the J-coupled metabolites with overlapping resonances with cystathionine signals. Spectral overlap can be partially removed using edited MRS methods, yet the analysis of non-edited spectra is useful for the quantification of the full metabolic profile and conventional MRS remains the most commonly used technique especially in clinical settings.Acknowledgements
The authors would like to thank Edward J. Auerbach, Ph.D. for implementing MRS sequences on the Siemens platform. FB and SL acknowledge support from Investissements d’avenir [grant number ANR-10-IAIHU-06 and ANR-11-INBS-0006]. FB acknowledges support from Agence Nationale de la Recherche [grant number ANR-20-CE17-0002-01]. DD and MM acknowledge support from following National Institutes of Health grants: BTRC P41 EB015894 and P30 NS076408. MS acknowledge support from INCa-DGOS-Inserm_12560 (SiRIC CURAMUS).References
1. Dang L, White DW, Gross S, et al. Cancer-associated IDH1 mutations produce 2-hydroxyglutarate. Nature. 2009;462(7274):739-744. doi:10.1038/nature08617
2. Parsons DW, Jones S, Zhang X, et al. An integrated genomic analysis of human glioblastoma multiforme. Science. 2008;321(5897):1807-1812. doi:10.1126/science.1164382
3. Andronesi OC, Kim GS, Gerstner E, et al. Detection of 2-hydroxyglutarate in IDH-mutated glioma patients by in vivo spectral-editing and 2D correlation magnetic resonance spectroscopy. Science Transl. Med. 2012;4(116):116ra4-116ra4. doi:10.1126/scitranslmed.3002693
4. Choi C, Ganji SK, DeBerardinis RJ, et al. 2-hydroxyglutarate detection by magnetic resonance spectroscopy in IDH-mutated patients with gliomas. Nat Med. 2012;18(4):624-629. doi:10.1038/nm.2682
5. Icard P, Poulain L, Lincet H. Understanding the central role of citrate in the metabolism of cancer cells. Biochimica et Biophysica Acta (BBA) - Reviews on Cancer. 2012;1825(1):111-116. doi:10.1016/j.bbcan.2011.10.007
6. Choi C, Ganji SK, Madan A, et al. In vivo detection of citrate in brain tumors by 1 H magnetic resonance spectroscopy at 3T: MRS Detection of Citrate in Brain Tumors. Magn Reson Med. 2014;72(2):316-323. doi:10.1002/mrm.24946
7. Tiwari V, Daoud EV, Hatanpaa KJ, et al. Glycine by MR spectroscopy is an imaging biomarker of glioma aggressiveness. Neuro Oncol. Published online February 14, 2020:noaa034. doi:10.1093/neuonc/noaa034
8. Branzoli F, Deelchand DK, Sanson M, Lehéricy S, Marjańska M. In vivo 1 H MRS detection of cystathionine in human brain tumors. Magn Reson Med. 2019;82(4):1259-1265. doi:10.1002/mrm.27810
9. Branzoli F, Pontoizeau C, Tchara L, et al. Cystathionine as a marker for 1p/19q codeleted gliomas by in vivo magnetic resonance spectroscopy. Neuro Oncol. 2019;21(6):765-774. doi:10.1093/neuonc/noz031
Figures