0058
Quantification of cross-relaxation in human skeletal muscle using downfield 1H MRS at 7T1Department of Bioengineering, University of Pennsylvania, Philadelphia, PA, United States, 2Department of Radiology, University of Pennsylvania, Philadelphia, PA, United States, 3St. Jude Children's Research Hospital, Memphis, TN, United States
Synopsis
In the 1H magnetic resonance (MR) spectrum of human muscle, non-exchangeable proton resonances have been observed at 8.0, 8.2 and 8.5 ppm. While relaxation rate enhancement of these resonances was previously observed, their cross-relaxation rates with bulk water have not yet been determined. Knowledge of cross-relaxation rates could improve the design of MR techniques or serve as a potential biomarker. We quantify the cross-relaxation rate of these resonances with bulk water using selective and non-selective inversion-recovery downfield MRS at 7T. We observed the cross-relaxation rates of the 8.2 and 8.5 ppm resonances were significantly faster than the 8.0 ppm resonance.
Introduction
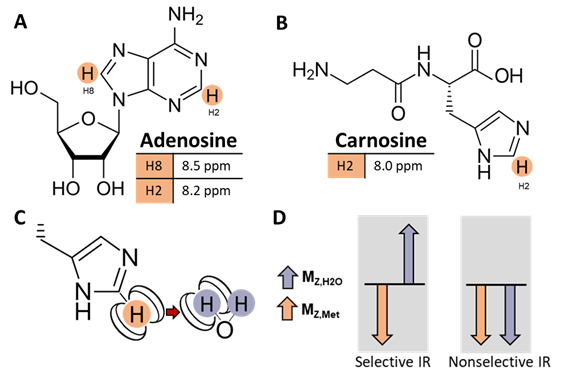
In muscle, there are two resonances in the downfield (>4.7 ppm) region of the 1H MRS spectrum at 8.2 and 8.5 ppm that may be attributed to the H2 and H8 protons of the adenosine moiety of ATP and other metabolites (Fig. 1A), and there is a resonance at 8.0 ppm attributable to the H2 proton of the carnosine imidazole ring (Fig. 1B)1-3. In vivo detection of these non-labile proton resonances is complicated by spectral overlap and cross-relaxation with bulk water, resulting from dipole-dipole interactions with water protons (Fig. 1C). These effects lead to reduced signal detection under water suppressed conditions. While enhanced longitudinal magnetization recovery (T1) has been observed in downfield metabolite signals when water suppression is not used2-6, the cross-relaxation rate between metabolite and water protons has not yet been quantified in human skeletal muscle.Objective: To quantify the cross-relaxation of downfield proton resonances with bulk water in human skeletal muscle using spectrally-selective downfield spectroscopy.
Methods
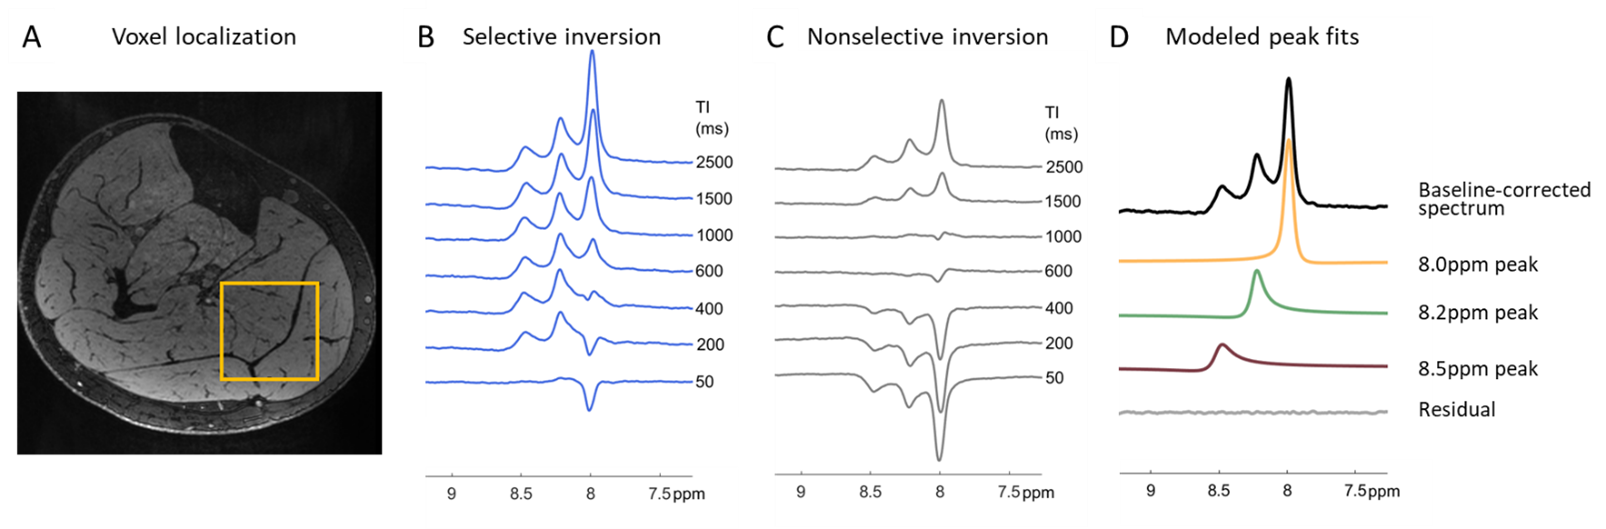
This study was approved by local IRB, and all participants gave written informed consent. We collected inversion recovery single-voxel 1H downfield MRS data from 6 healthy male and female volunteers between the ages of 24 and 39 years at 7T (MAGNETOM Terra, Siemens Healthcare, Erlangen, Germany) with a 28-channel knee RF coil (Quality Electrodynamics, Mayfield Village, OH, USA). A spectrally-selective 90° E-BURP pulse7,8 centered at 9.0 ppm was used to excite the downfield metabolites (TR/TE: 7000/20 ms, 32 averages, BW: 600 Hz). Before excitation, a 180° pulse inverted only metabolites (selective Sinc pulse, centered at 9.0 ppm, BW: 660 Hz) or metabolites and water (non-selective hyperbolic secant pulse, BW: 4000 Hz) with inversion times of ~10-2500 ms2,6 (Fig. 1D). 3 narrow spatially-selective refocusing 180° Shinnar-Le Roux pulses (BW: 800 Hz) were used for localization. A 30x30x30 or 40x40x40 mm3 voxel was positioned in the calf (Fig. 2A).Data were fit in the time domain using Hankel singular value decomposition (HSVD)9,10 to model Lorentzian signal components that were assigned to peaks at 8.0, 8.2, and 8.5 ppm. Effective T1 was measured from selective and non-selective inversion recovery curves using a 3-parameter fit with least-squares minimization of: $$$S=A-Be^{-TI/T1}$$$. We additionally modeled the magnetization trajectory using modified 2-spin Bloch equations accounting for cross-relaxation11:
$$\text{Spin A: }\frac{\text{d}M_{z,A}(t)}{\text{d}t}=\frac{\left[M_{z,A,0}-M_{z,A}(t)\right]}{T1_{A}}-\sigma_{AB}+M_{z,A}(t)+\sigma_{BA}M_{z,B}(t)$$
$$\text{Spin B: }\frac{\text{d}M_{z,B}(t)}{\text{d}t}=\frac{\left[M_{z,B,0}-M_{z,B}(t)\right]}{T1_{B}}-\sigma_{BA}+M_{z,B}(t)+\sigma_{AB}M_{z,A}(t)$$
where spin A and spin B are the metabolite and water protons, respectively. Mz,X(t) is the longitudinal magnetization of a spin, Mz,X,0 the initial magnetization—controlled with the inversion conditions— and σAB and σBA the forward and reverse cross-relaxation rates, related by $$$\sigma_{AB}=\sigma_{BA}\frac{M_{z,B,0}}{M_{z,A,0}}$$$. Using a least-squares approach, we measured a general T1 and the cross-relaxation rate (σAB) for each peak using a 2-paramter fit to the solution of the Bloch equations. The distributions of T1 and σAB values were assessed using the Shapiro-Wilk test. The Wilcoxon signed-rank test was used to compare effective T1 measured with selective and nonselective inversion, and results were Bonferroni corrected. T1 and σAB measured from the modified Bloch equations were compared between the three peaks using analysis of variance (ANOVA) and Bonferroni-correct t-tests performed post-hoc.
Results
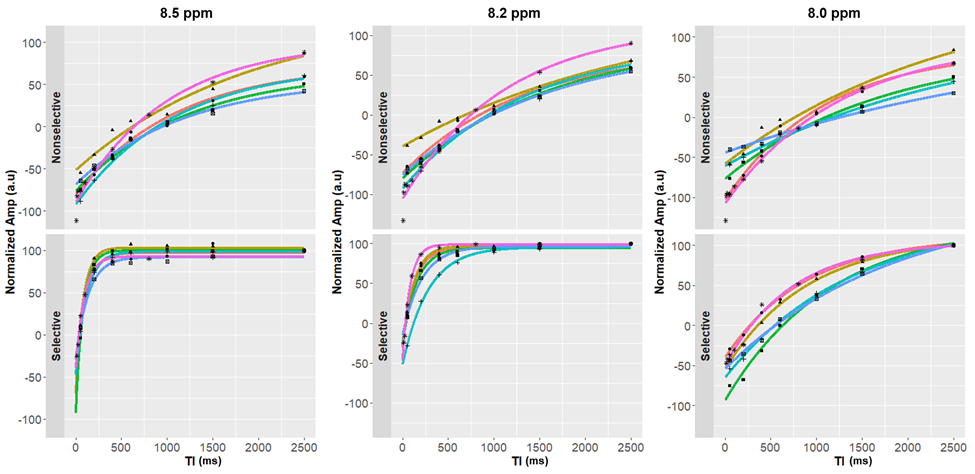
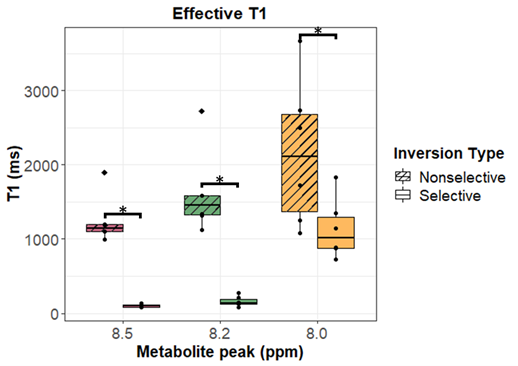
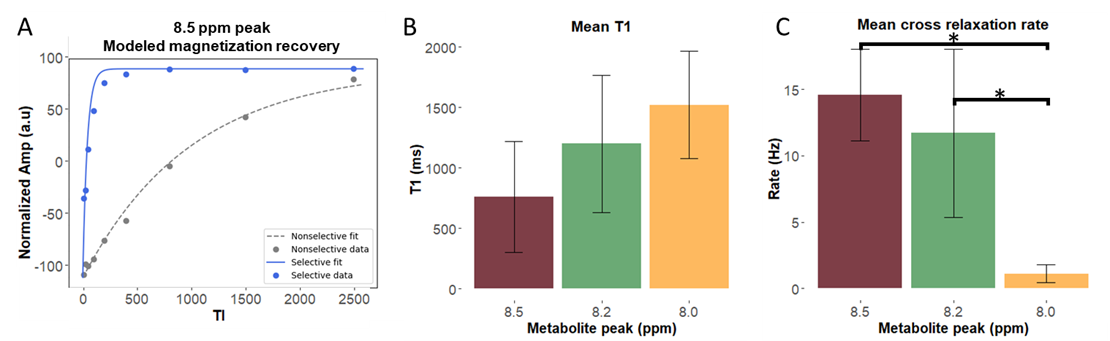
Figure 2 shows representative spectra with peaks at 8.0, 8.2, and 8.5 ppm in the downfield region under selective (B) and nonselective (C) inversion conditions and the modeled peak fits (D). Figure 3 shows the magnetization of the three peaks and the modeled T1 recovery curve with selective and non-selective inversion from all subjects. The type of inversion elicited a significant change in effective T1, with p=0.0156 for each metabolite. The non-selective (nonsel) and selective (sel) values of T1=median(interquartile range) (ms) of each peak were: T1nonsel,8.0ppm=2109.8(1307.8), T1sel,8.0ppm=1015.9(418.1); T1nonsel,8.2ppm=1458.4(258.0), T1sel,8.2ppm=135.2(71.7); T1nonsel,8.5ppm=1144.3(94.8), T1sel,8.5ppm=98.3(28.1) (Fig. 4). Figure 5A shows a representative modeled solution to the modified Bloch equations for longitudinal magnetization recovery under selective and nonselective inversion conditions. The modeled T1=mean±std (ms) of each peak was: T18.0ppm=1521.6±667.5, T18.2ppm=1199.3±445.5, T18.5ppm=759.6±460.6 (Fig. 5B). There was no significant difference between the T1’s of each peak (p=0.0532). The σAB=mean±std (Hz) of each peak was: σAB,8.0ppm=1.11±0.67, σAB,8.2ppm=11.67±6.33; σAB,8.5ppm=14.60±3.45 (Fig. 5C). There was a significant difference between σAB of each peak (p=0.00012), and post-hoc t-tests revealed that σAB of the 8.0 ppm peak was significantly slower than the peaks at 8.2 (p=0.009) and 8.5 ppm (p=0.0001).Discussion and Conclusion
The adenosine moiety of multiple metabolites, including ATP, likely contribute to the signals detected at 8.2 and 8.5 ppm in the downfield range of the proton spectrum. For frequency selective inversion, the metabolite peaks recover rapidly to equilibrium while non-selective inversion significantly prolongs the recovery. Because the H2 proton of the carnosine imidazole ring and the H7 and H12 protons of the ATP adenosine rings do not rapidly exchange with water, the decrease in effective T1 under the selective inversion condition suggests a cross-relaxation effect and not chemical exchange. The faster cross-relaxation rate for metabolite peaks at 8.2 and 8.5 ppm may suggest that a larger proportion of adenosine-containing metabolites are bound to large proteins in vivo, which decreases rotational correlation time and enhances the cross-relaxation effect. The cross-relaxation rate of carnosine is significantly slower and may contribute to the visibility of carnosine in the downfield region even when water suppression is used.Acknowledgements
Research reported in this publication was supported by the National Institute of Biomedical Imaging and Bioengineering of the National Institutes of Health under award Number P41EB029460 and T32EB009384, and by the National Heart, Lung, and Blood Institute of the National Institutes of Health under award Number R01HL137501 and F31HL158217.References
1. Bagga P, Wilson N, DeBrosse C, Hariharan H, Reddy R. In vivo detection of NAD+ in human calf muscle at 7T using 28-channel knee volume coil. In Joint Annual Meeting ISMRM-ESMRMB 2018, Paris, France. 2018.
2. Swago S, Cember A, Moon B, Bagga P, Wilson N, Elliott MA, Hariharan H, Reddy R, Witschey W. Characterization of cross-relaxation in human skeletal muscle using downfield 1H MRS at 7T. In 2021 ISMRM & SMRT Annual Meeting & Exhibition (ISMRM 2021). 2021.
3. MacMillan EL, Boesch C, Kreis R. Magnetization exchange observed in human skeletal muscle by non-water-suppressed proton magnetic resonance spectroscopy. Magn Reson Med 2013;70(4):916-924. doi: 10.1002/mrm.24537
4. MacMillan EL, Chong DG, Dreher W, Henning A, Boesch C, Kreis R. Magnetization exchange with water and T1 relaxation of the downfield resonances in human brain spectra at 3.0 T. Magn Reson Med 2011;65(5):1239-1246. doi: 10.1002/mrm.22813
5. Shemesh N, Dumez JN, Frydman L. Longitudinal relaxation enhancement in 1H NMR spectroscopy of tissue metabolites via spectrally selective excitation. Chemistry 2013;19(39):13002-13008. doi: 10.1002/chem.201300955
6. de Graaf RA, Behar KL. Detection of cerebral NAD(+) by in vivo (1)H NMR spectroscopy. NMR Biomed 2014;27(7):802-809. doi: 10.1002/nbm.3121
7. Geen HaF, Ray. Band-selective radiofrequency pulses. Journal of Magnetic Resonance: Elsevier, 1991; p. 93-141.
8. Bagga P, Hariharan H, Wilson NE, Beer JC, Shinohara RT, Elliott MA, Baur JA, Marincola FM, Witschey WR, Haris M. Single‐Voxel 1H MR spectroscopy of cerebral nicotinamide adenine dinucleotide (NAD+) in humans at 7T using a 32‐channel volume coil. Magnetic Resonance in Medicine 2020;83(3):806-814.
9. Barkhuijsen H, De Beer R, Van Ormondt D. Improved algorithm for noniterative time-domain model fitting to exponentially damped magnetic resonance signals. Journal of Magnetic Resonance (1969) 1987;73(3):553-557.
10. Pijnappel W, Van den Boogaart A, De Beer R, Van Ormondt D. SVD-based quantification of magnetic resonance signals. Journal of Magnetic Resonance 1992;97(1):122-134.
11. Grad J, Bryant RG. Nuclear magnetic cross-relaxation spectroscopy. Journal of Magnetic Resonance (1969) 1990;90(1):1-8.
Figures