0057
Interleaved 1H-MRI, 2H-MRSI and 13C-MRS for time-resolved in vivo elucidation of glucose metabolism in human liver at 7 T1Magnetic Resonance Methodology, Institute of Diagnostic and Interventional Neuroradiology, University of Bern, Bern, Switzerland, 2Translational Imaging Center, sitem-insel, Bern, Switzerland, 3Department of Diabetes, Endocrinology, Nutritional Medicine and Metabolism UDEM, Insel Hospital, University Hospital Bern, Bern, Switzerland
Synopsis
An interleaved 2H-MRSI / 13C-MRS protocol to obtain a complete picture of glucose turnover in the human liver at 7T is presented. A dedicated triple-tuned surface coil was used and the setup was optimized for temporal and spatial resolution, SNR (under the restraints of SAR) and robustness to assess hepatic glucose uptake and glycogen production. Data quality and initial kinetic data after oral deuterated glucose load is reported. Further optimization is intended to establish absolute concentrations and to generate kinetic models of metabolic fluxes.
Introduction
Quantitative non-invasive assessment of glucose turnover rates and determination of downstream products is of importance for any organ, but especially for the liver due to its central role in glucose homeostasis. Deuterium metabolic imaging (DMI) has emerged as novel tool to dynamically map the metabolic fate of orally administered deuterated glucose in animals1 and humans2. In the liver, exogenous or endogenous glucose is either converted to glycogen or fed into glycolysis and the TCA-cycle for oxidation or synthesis of fatty acids. However, deuterated glycogen has been shown not to be detectable by 2H-MRS3. To obtain a complete picture of glucose turnover in the liver, we thus propose to combine 2H-MRS with 13C-MRS, which is known to provide full visibility of the C1-carbon of glycogen and its quantification in natural abundance4,5. For a seamless interleaved acquisition of 1H-MRI, 2H-MR spectroscopic imaging (MRSI) and 13C-MRS a novel dedicated triple-tuned surface coil is used and the acquisition scheme was optimized for temporal and spatial resolution, SNR and robustness to assess hepatic glucose uptake and glycogen production in health and under pathologic conditions, like type-1 diabetes.Methods
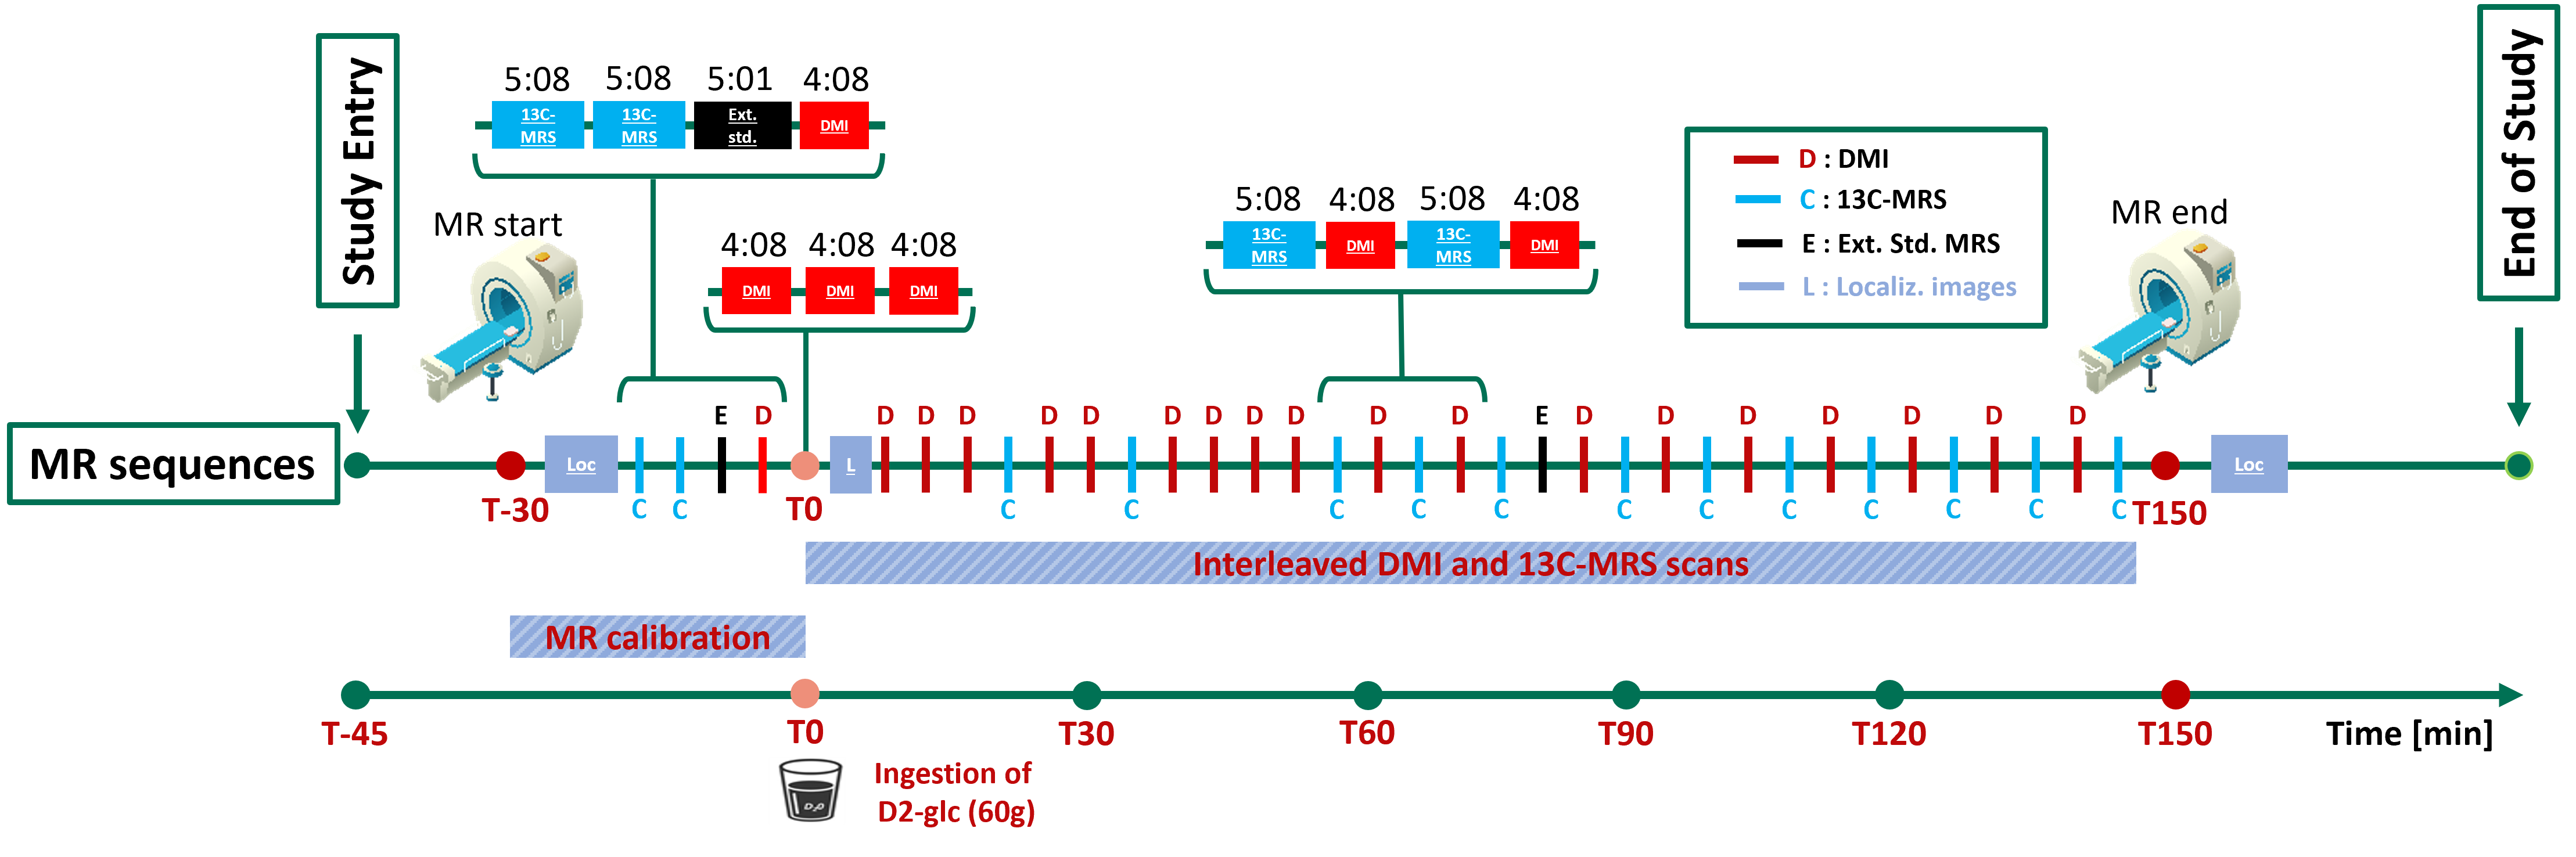
Exams were performed at 7T (Terra, Siemens) using a triple-tuned surface coil (1H: quadrature-driven dual loop, 2H and 13C: linearly-driven single loop, outer dimensions: 30x10x30 cm) from Rapid, Biomedical. Chromium-doped acetone (8 mL, 5% deuterated) inserted in a vial near the coil center served as external reference (ER) to correct for coil loading effects. The optimized timing of events is reported in Fig. 1. Calibrations and base recordings are done before oral [6,6’-2H2]-glucose intake (60 g).- Calibrations: Multi-plane localizers with and without breath-hold for coil-placement verification and spatial reference. Frequency-adjustment and shimming in expiration.
- DMI: conventional 3D-MRSI (0.50 ms rectangular excitation pulse, 0.35 ms phase-encoding gradient, TR 500 ms, 4 averages with acquisition-weighting, 12x12x8 phase encodings, nominal resolution of 18.3x18.3x27.5 mm3, 1000 Hz spectral width, 4:08 min acquisition time). Placement of the MRSI grid uses reference markers on the coil.
- 13C-MRS: pulse-and-acquire sequence (2 ms hyperbolic-secant-pulse excitation, TR 600 (Glycogen) or 500 (ER) ms, 512 (Glycogen) or 600 (ER) acquisitions, Nuclear-Overhauser-irradiation (fixed voltage, 510 ms) only for Glycogen scans, acquisition time 5:08 min for Glycogen, 5:01 min for ER). Frequency centered on glycogen-C1 or acetone-C1.
Results and Discussion
All scan parameters were optimized on phantoms and in vivo with the following main outcome:- No 1H-decoupling for 13C-MRS because of SAR limits and potential for additional noise.
- Hard pulse rather than adiabatic excitation for 13C-MRS to reduce superficial lipid signals and to prevent ill-defined signals from deeper in liver.
- TR optimized for 13C-MRS and 2H-MRSI as compromise between optimal SNR and sensitivity to relaxation time effects within SAR limits.
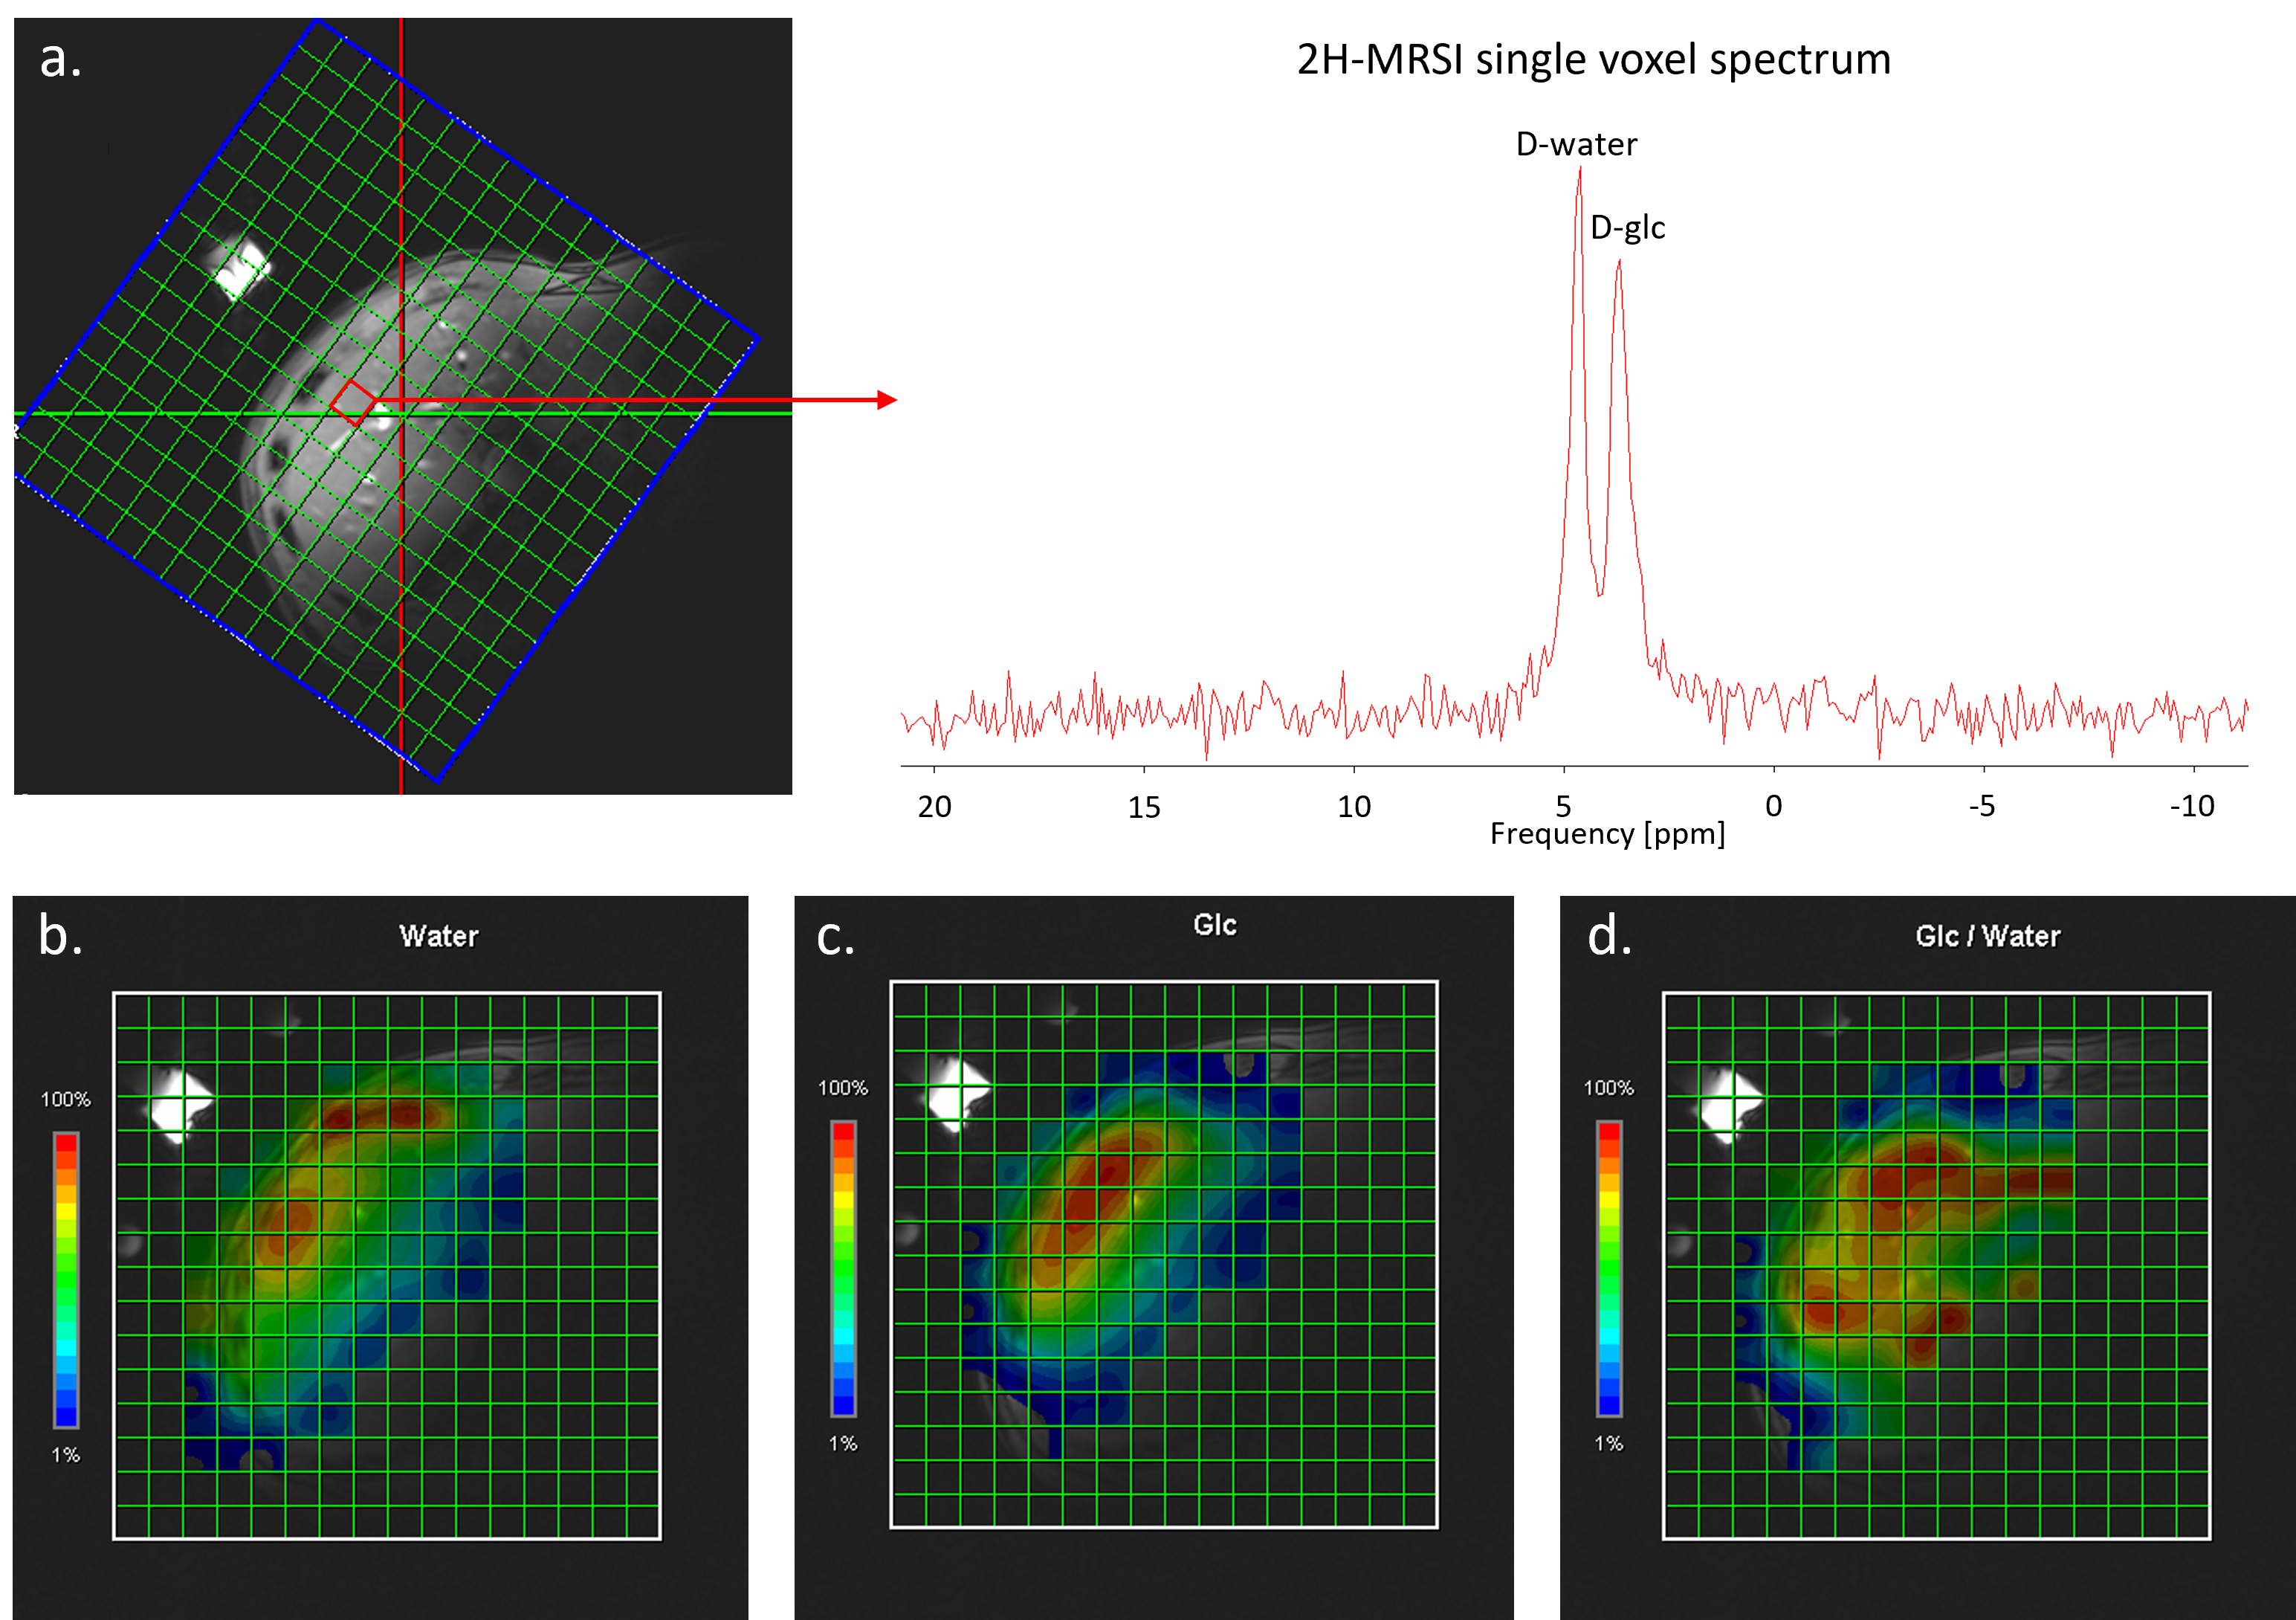
- Spatial resolution of MRSI chosen for sufficient SNR in single pixels (Fig. 2) with 4 min time resolution.
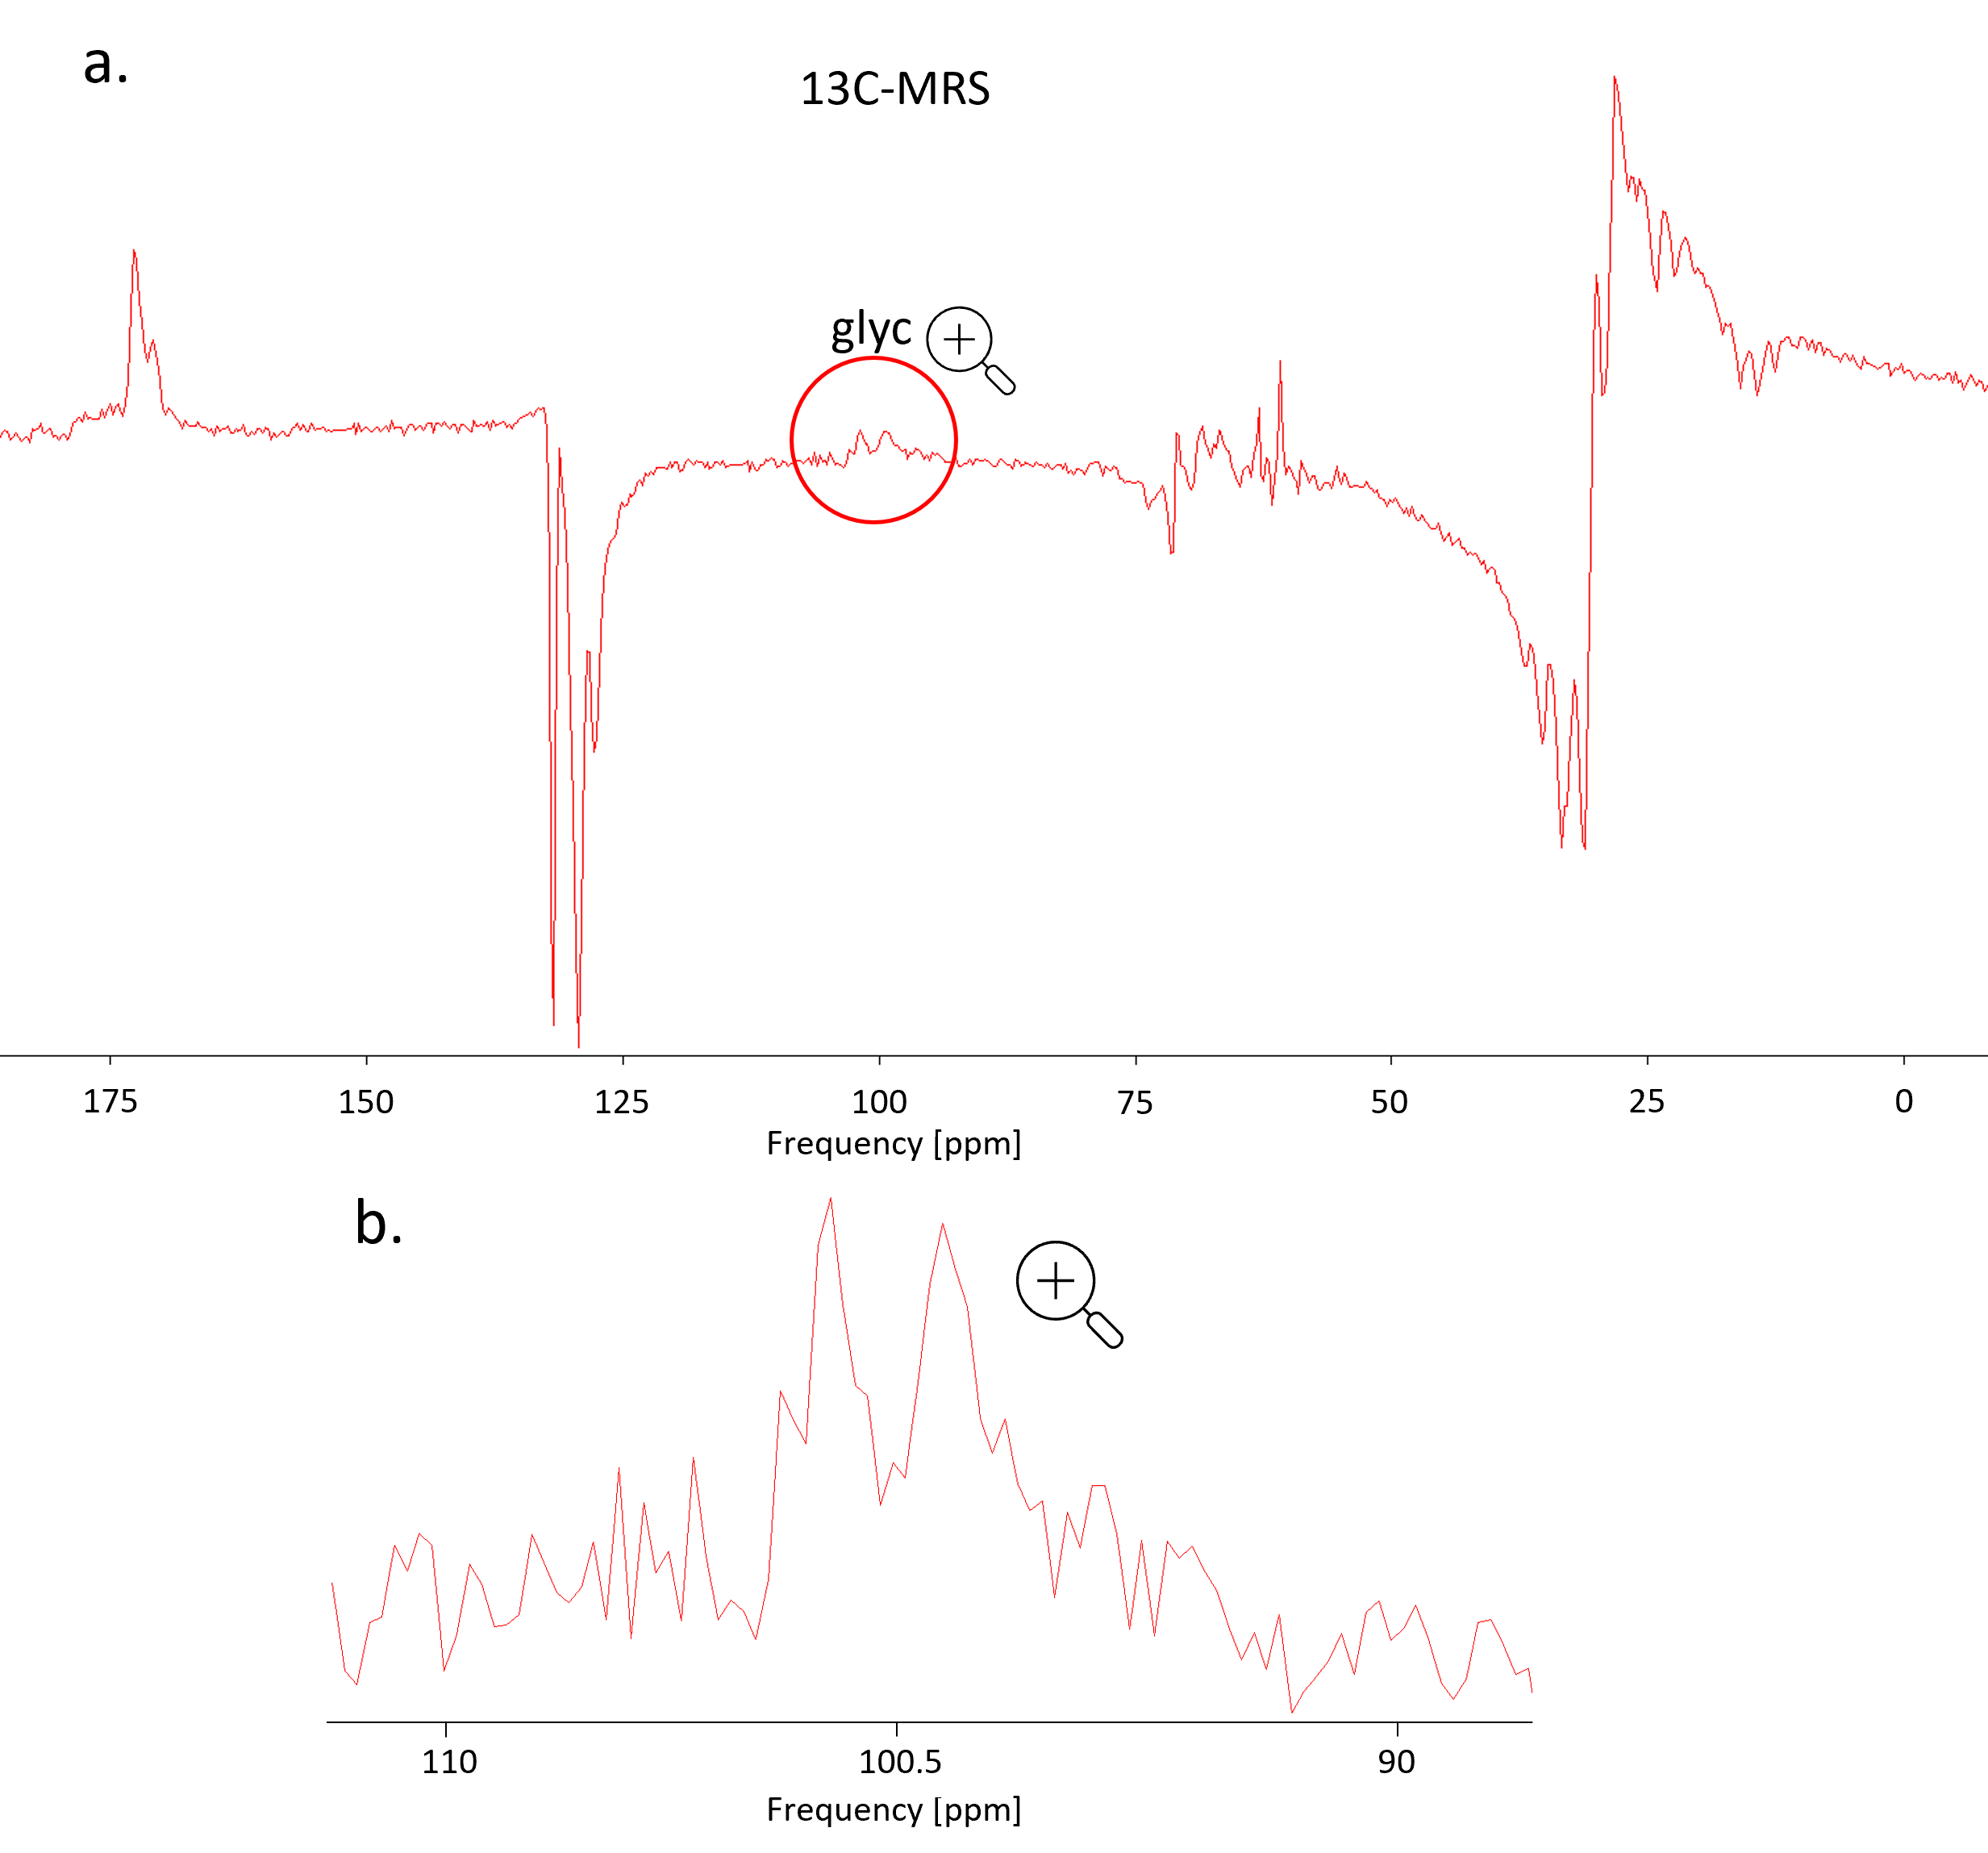
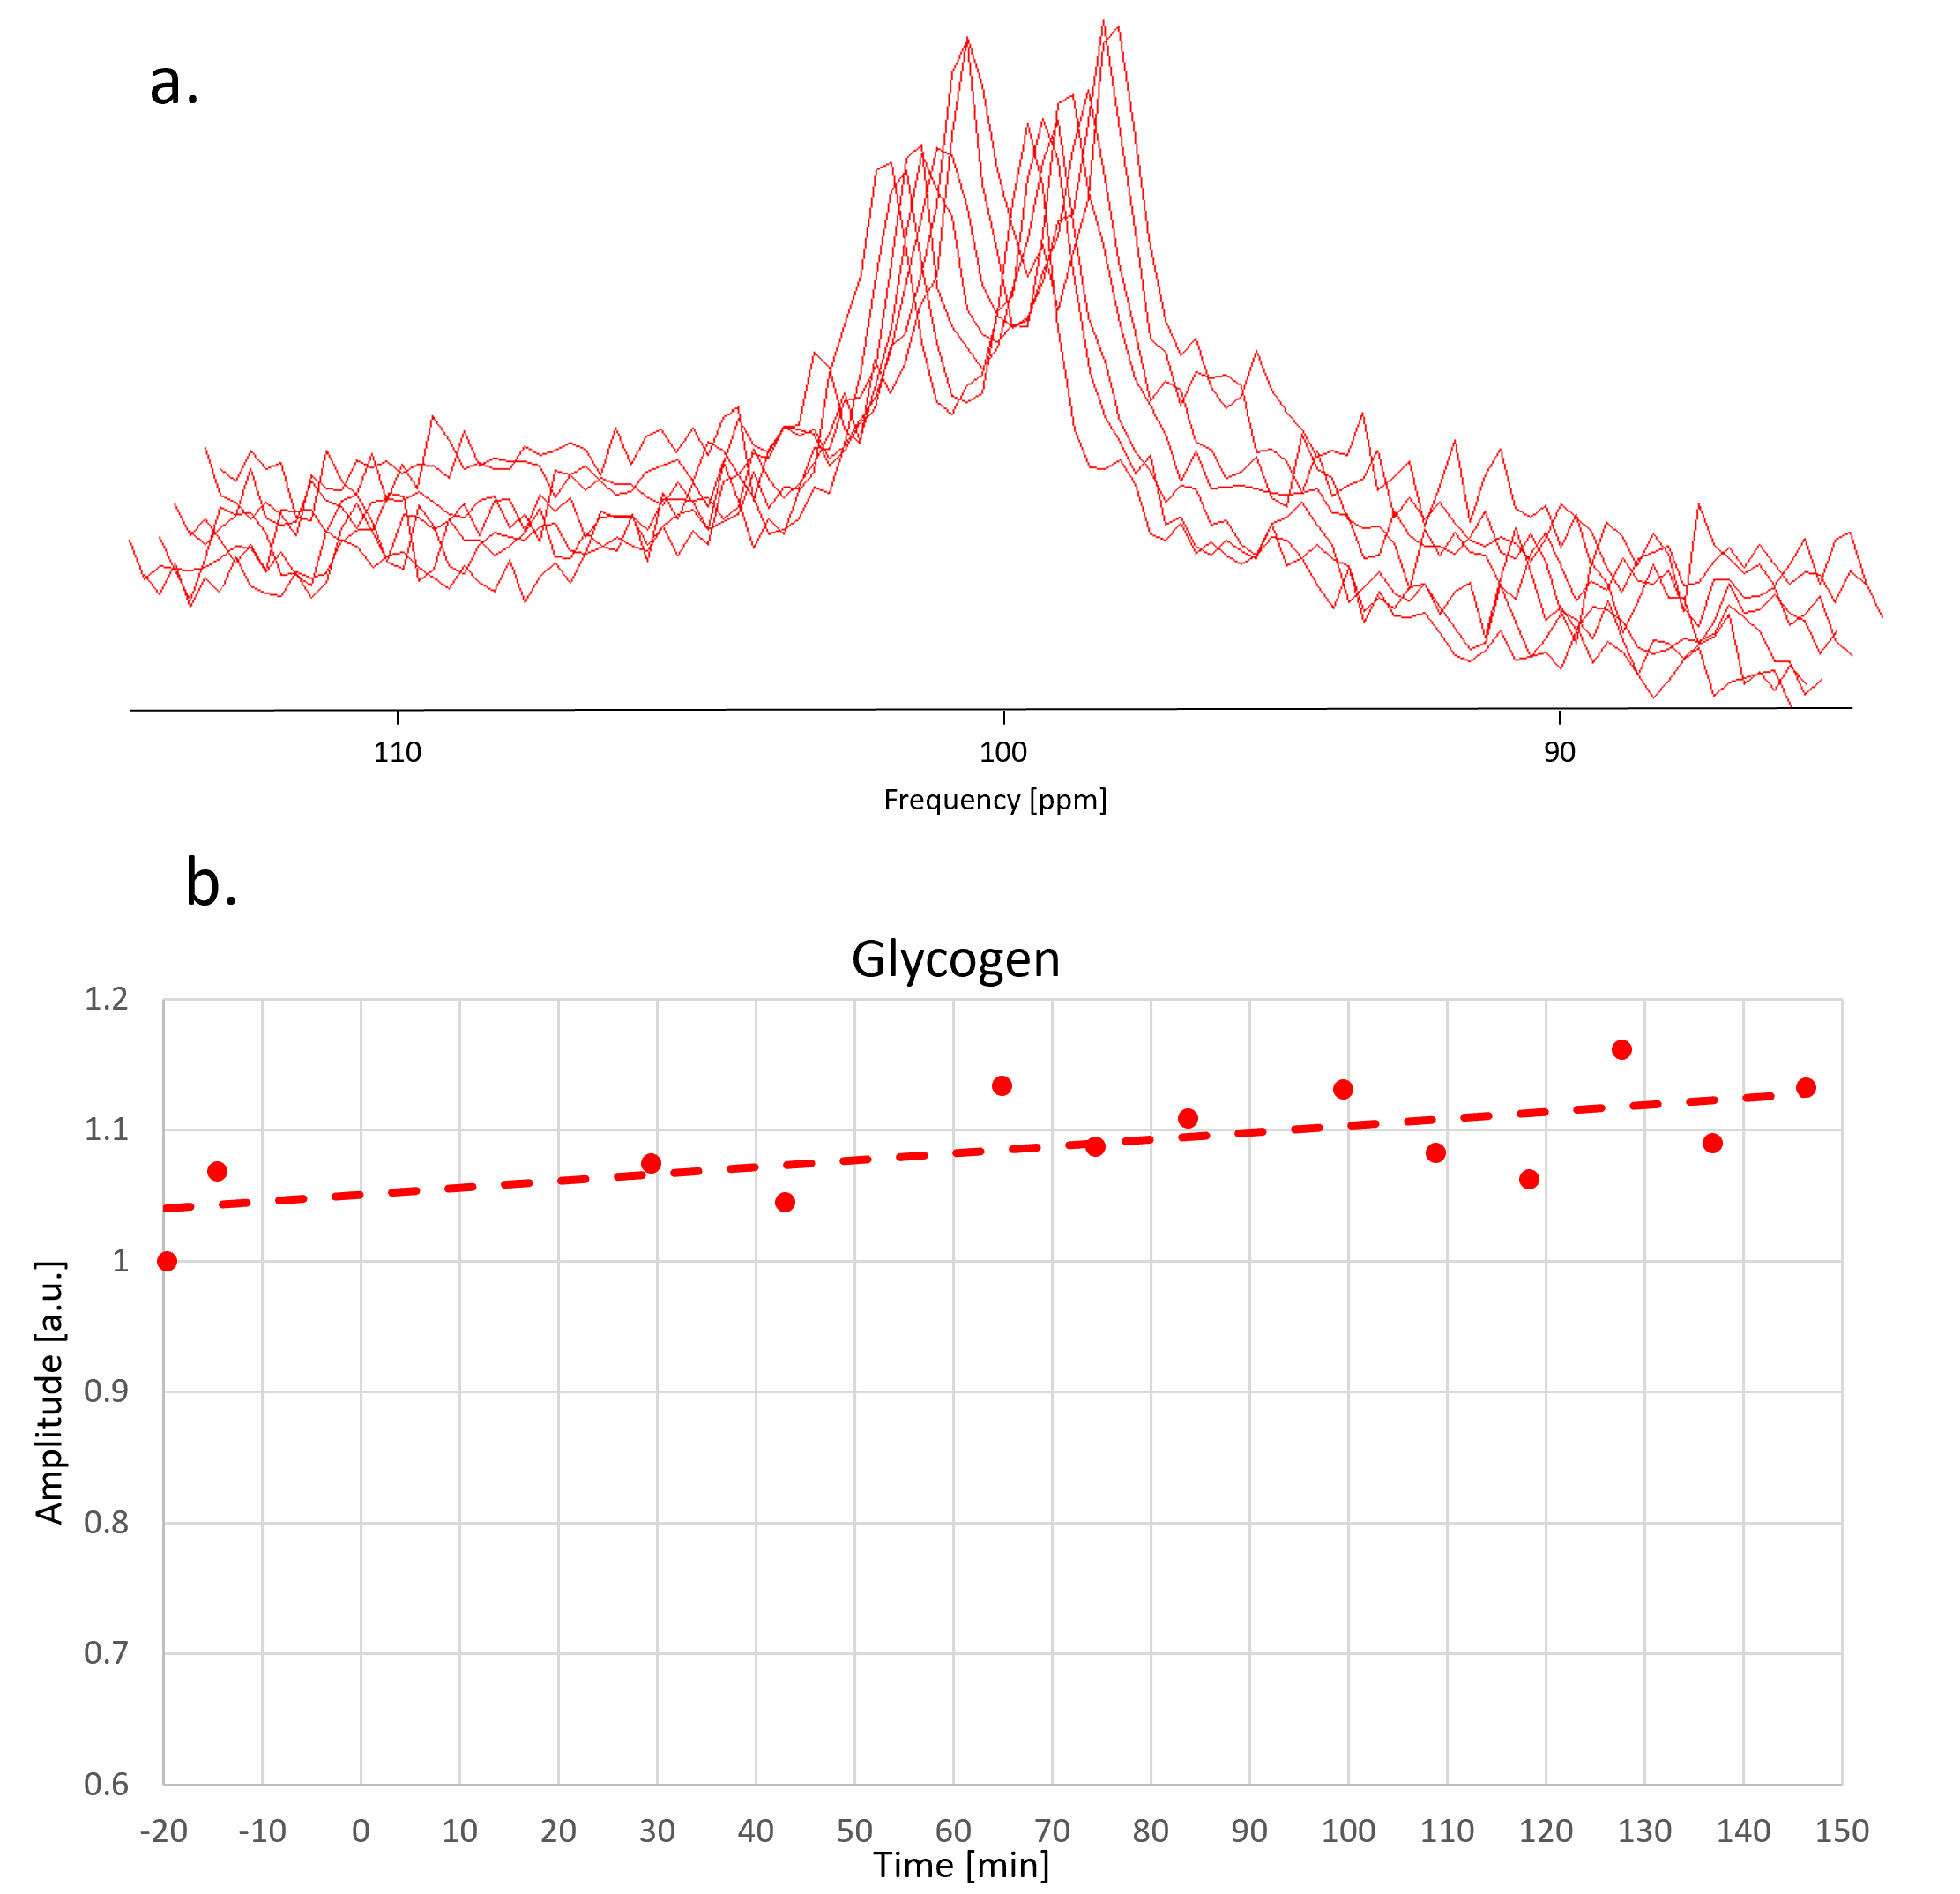
Fig. 3 illustrates data quality for 13C-MRS. The SNR in frequency domain is ~10 for each spectrum and the doublet can be well fitted with prior knowledge where each line is represented by two Lorentzian components (60 Hz and 150 Hz width).
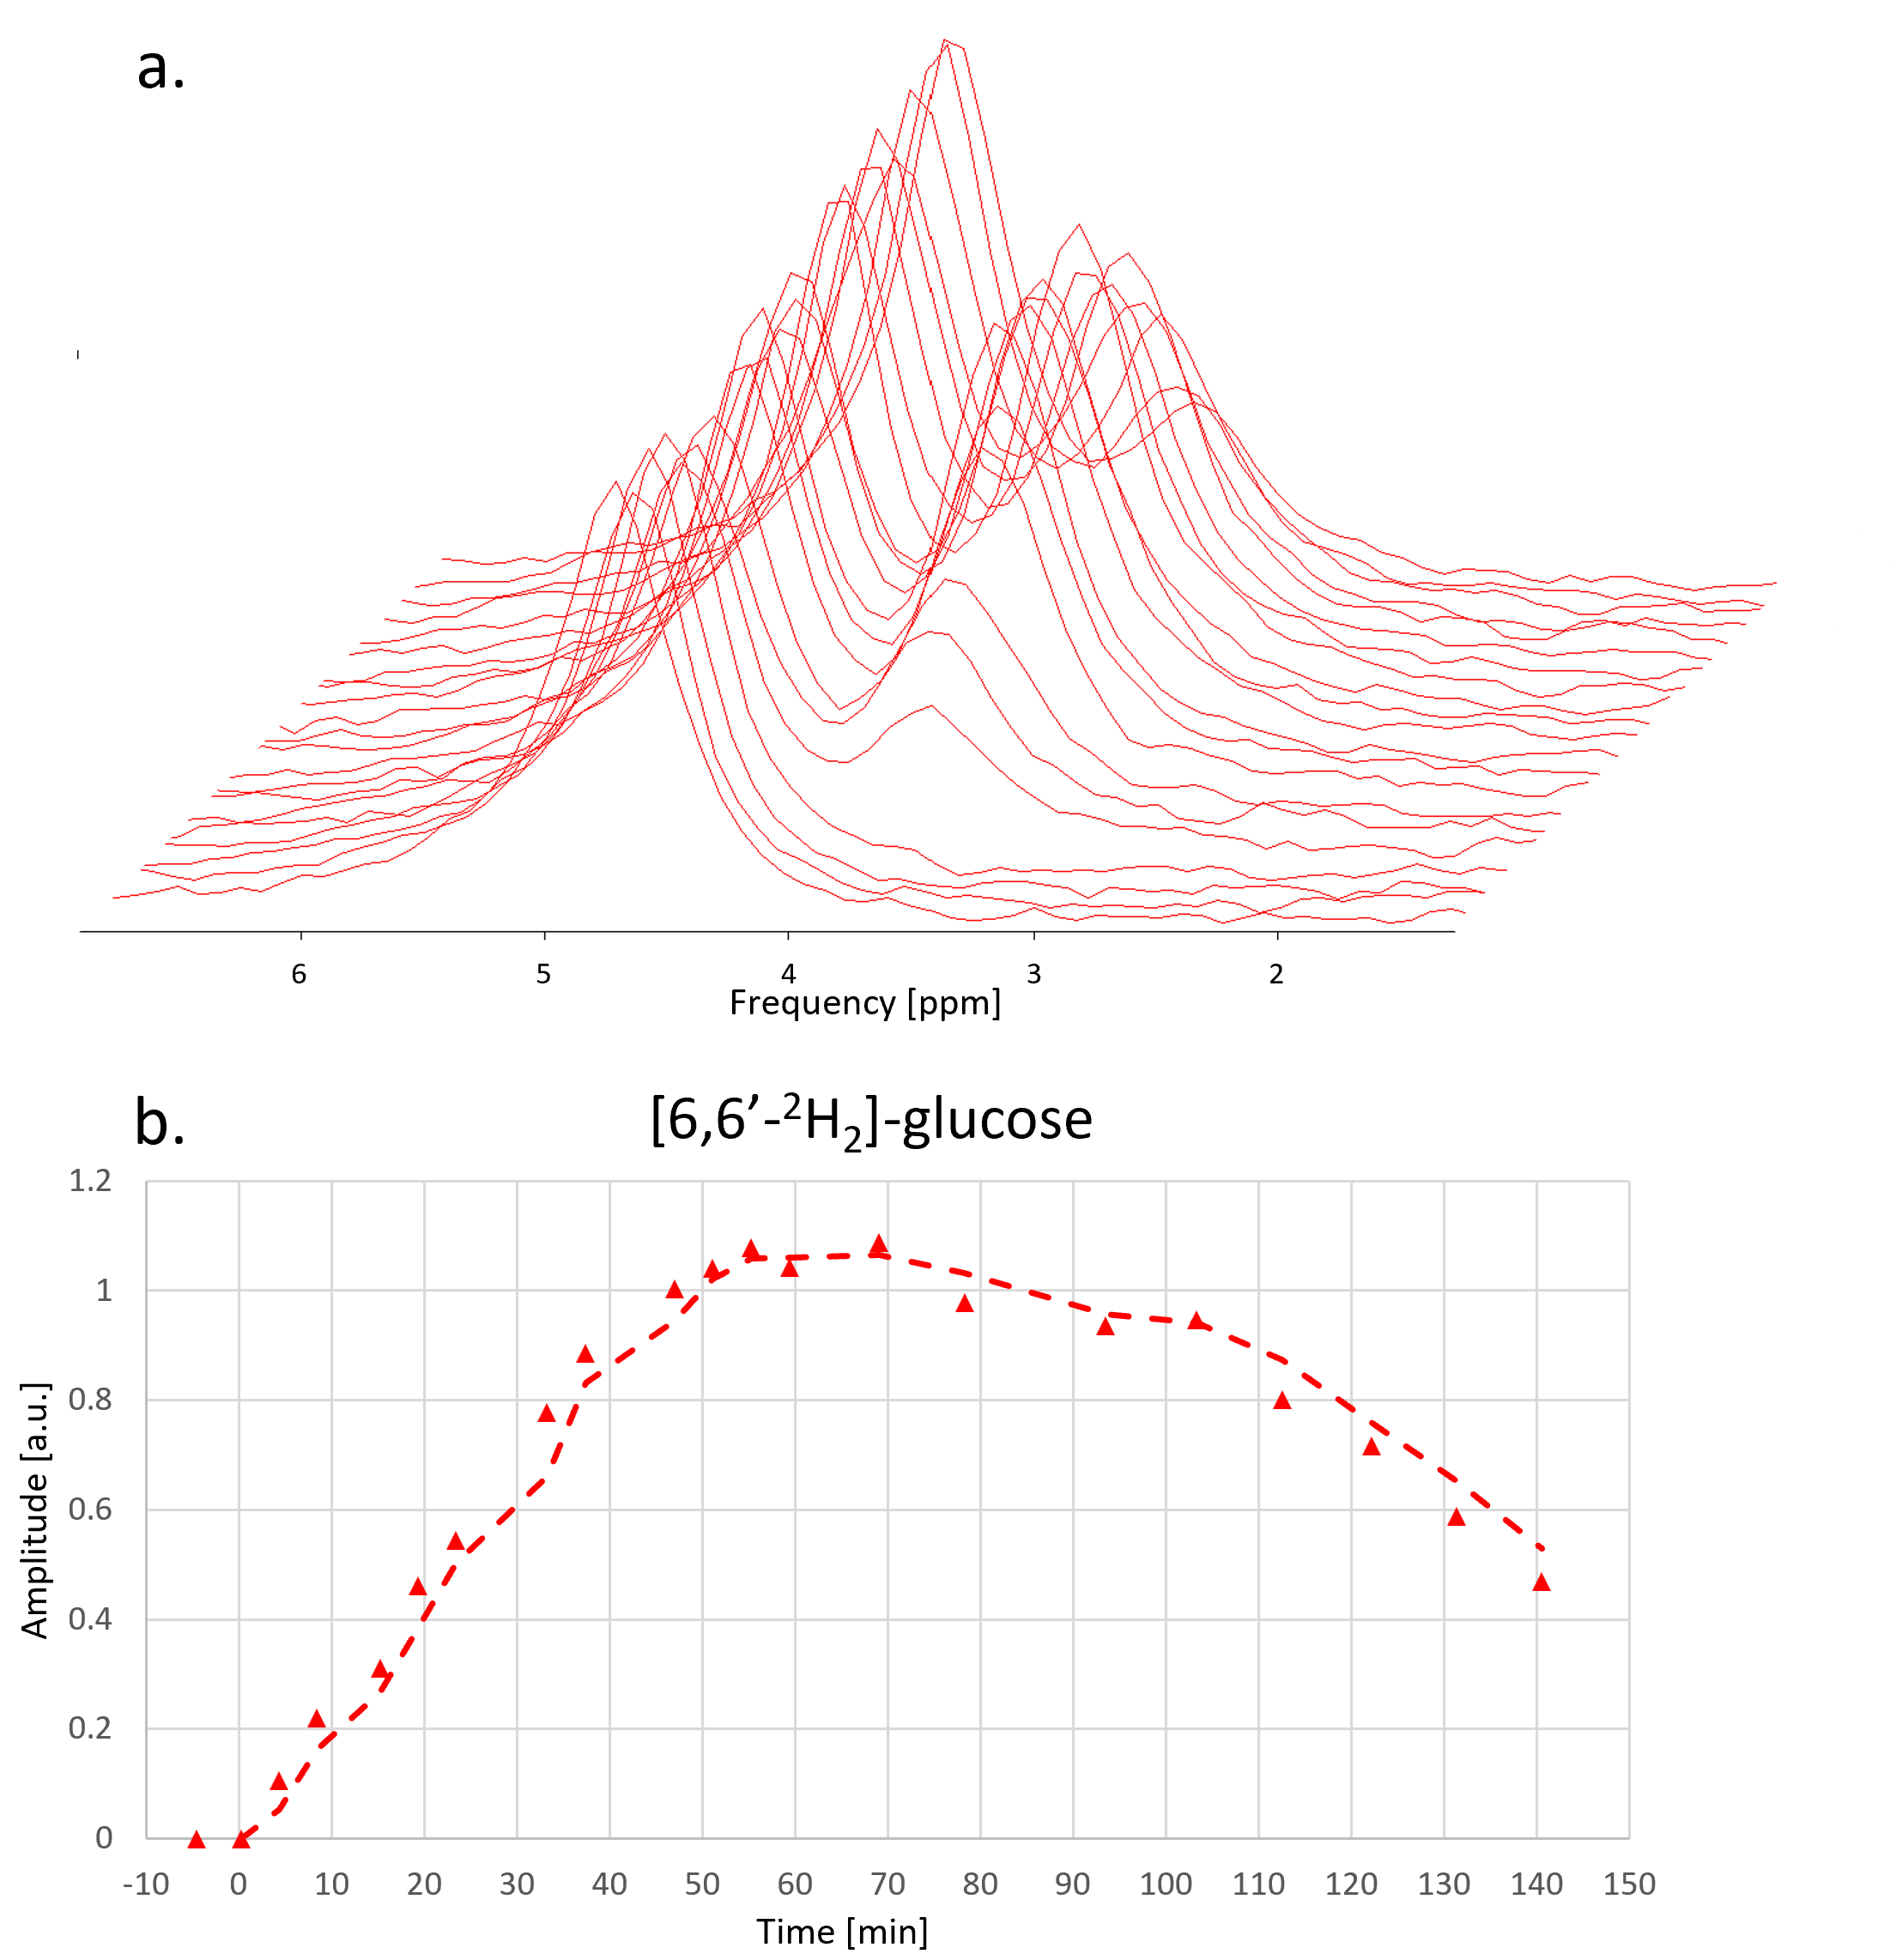
Fig. 4 and Fig. 5 show the time evolution of 2H-MRSI and 13C-MRS. The overall time course for 2H-MRSI was evaluated for a sum of 6 central MRSI voxels with spectra illustrated in Fig. 4. The SNR for this average is about double compared to a single pixel spectrum while the line-width remained stable at ~22 Hz. The 2H data shows the appearance of the 2H-Glc peak very early after [6,6’-2H2]-glucose intake leading to a maximum signal at ~60 min while the HDO signal does not change much. In this case, the glycogen signal increases by ~10-15% over the whole-time course.
Conclusions
Hepatic metabolic changes following oral ingestion of [6,6’-2H2]-glucose are detected by 2H- and 13C-MRS for humans at 7T. An interleaved X-nuclear scheme to assess hepatic glucose uptake and glycogen production was optimized for temporal and spatial resolution and SNR under the restraints of SAR. The triple-tuned coil allows for interleaved scanning with optimal use of the whole scan time without a need to move subject or coils, while no major compromise for SNR was observed. The temporal and spatial resolution, SNR and robustness of the protocol seem adequate for clinical research applications. Further optimization is intended for more robust fitting pipelines, increased SNR for the 13C ER signal, establishment of absolute concentrations of the metabolites and for generation of kinetic models of metabolic fluxes.Acknowledgements
Supported by the Swiss National Science Foundation (PCEGP3_186978) and Diabetes Center Bern. We thank Andreas Melmer, David Herzig, Laura Goetschi, Valérie Brägger and Joana Filipa Rodrigues Cunha Freitas from the Department of Diabetes, Endocrinology, Nutritional Medicine and Metabolism, Inselspital, Bern University Hospital for the support received.References
[1] Lu M, Zhu XH, Zhang Y, Mateescu G, et al. Quantitative assessment of brain glucose metabolic rates using in vivo deuterium magnetic resonance spectroscopy. J Cereb Blood Flow Metab. 2017; 37(11):3518-3530.
[2] De Feyter HM, Behar KL, Corbin ZA, et al. Deuterium metabolic imaging (DMI) for MRI-based 3D mapping of metabolism in vivo. Sci Adv. 2018; 4(8):eaat7314.
[3] De Feyter HM, Thomas MA, Behar KL, de Graaf RA. NMR visibility of deuterium-labeled liver glycogen in vivo. Magn Reson Med. 2021; 86: 62-68.
[4] Rothman DL, Magnusson I, Katz LD, Shulman RG, Shulman GI. Quantitation of hepatic glycogenolysis and gluconeogenesis in fasting humans with 13C NMR. 1991; Science 254: 573–576.
[5] Buehler T, Bally L, Dokumaci AS, Stettler C, Boesch C. Methodological and physiological test–retest reliability of 13C-MRS glycogen measurements in liver and in skeletal muscle of patients with type 1 diabetes and matched healthy controls. NMR Biomed. 2016; 29: 796– 805.
[6] Vanhamme L, van den Boogaart A, Van Huffel S. Improved method for accurate and efficient quantification of MRS data with use of prior knowledge. J Magn Reson. 1997; 129:35–43.
Figures