0054
Comparing high resolution 7T MRSI and PET of glioma – a promising correspondence of glutamine to amino acid PET1Department of Neurosurgery & High Field MR Centre, Medical University of Vienna, Wien, Austria, 2High Field MR Centre, Department of Biomedical Imaging and Image-guided Therapy, Medical University of Vienna, Vienna, Austria, 3FH Campus Wien University of Applied Sciences, Vienna, Austria, 4Division of Neuroradiology and Musculoskeletal Radiology, Department of Biomedical Imaging and Image-guided Therapy, Medical University of Vienna, Vienna, Austria, 5Center for Medical Physics and Biomedical Engineering,, Medical University of Vienna, Vienna, Austria, 6Division of Nuclear Medicine, Department of Biomedical Imaging and Image-guided Therapy, Medical University of Vienna, Vienna, Austria, 7Department of Neurosurgery, Medical University of Vienna, Vienna, Austria, 8Division of Oncology, Department of Internal Medicine I, Medical University of Vienna, Vienna, Austria, 9Division of Neuropathology and Neurochemistry, Department of Neurology, Medical University of Vienna, Vienna, Austria, 10Institute for Clinical Molecular MRI, Karl Landsteiner Society, St. Pölten, Austria, 11Christian Doppler Laboratory for Clinical Molecular MR Imaging, Vienna, Austria
Synopsis
We compared metabolic ratio maps of tCho, Gln, and Gly to tNAA and tCr derived from high-resolution 7T MRSI to clinical amino acid PET in 24 glioma patients. We achieved the highest DICE coefficient of 0.66±0.25 for Gln/tNAA, and further defined hot spot volumes and center of intensity distances between PET and MRSI. Overall, we showed that the information content of 7T MRSI results in a better correspondence to PET as clinical gold standard than previous MRSI studies.
Purpose
Innovations in magnetic resonance spectroscopic imaging (MRSI), as a metabolic imaging modality in neurooncology, have been compared to the clinical standard of positron emission tomography (PET), identifying some degree of correspondence between PET tracers such as 11C-methionine-PET (MET) or 18F-fluoroethyl-L-tyrosine-PET (FET) (both labelled amnio acids) and ratios of total choline (tCho) to total N-acetylaspartate (tNAA) or total creatine (tCr)1,2. We recently demonstrated high-resolution 7T MRSI based on concentric ring trajectories3 applied to high-grade gliomas4, investigating the capability of 7T MRSI to image more metabolites such as glutamine (Gln) – separated from glutamate – and glycine (Gly) – separated from myo-inositol. With this work, we correlate these metabolic maps to clinical PET in order to verify the findings of 7T MRSI.Methods
We included 24 histologically verified glioma patients into this retrospective study who had participated in a 7T MRSI protocol and had had clinical PET-MR scans within 6 months of the 7T scan (15 with FET and 9 with MET) between November 2018 and April 2021. IRB approval and informed consent were obtained. The 7T protocol measured with a Siemens Magnetom/Magnetom plus included MP2RAGE/FLAIR with 0.8 mm isotropic resolution and free induction decay MRSI with a 64×64×39 matrix, 220×220×133 mm³ FOV, 3.4 mm nominal isotropic resolution, TR 450 ms, acquisition delay of 1.3 ms, 39° excitation angle, 1116 readout points and 2778 Hz readout bandwidth3,4. Postprocessing using an in-house pipeline included a L2-regularisation5 to remove lipid artefacts. Spectra were fit using LCModel in the 1.8-4.0 ppm range with a basis set including tCr, GABA, Gln, Glu, Gly, GSH, tCho, Ins, NAA, NAA, Ser, Tau, NAAG, and a macromolecular baseline before creation of individual metabolic maps. These maps were filtered based on tCr SNR>5, tCr FWHM<0.15 ppm, and metabolite CRLB<40 %, only voxels within these criteria were included in the analysis below.We co-registered the PET images (after MR-based attenuation correction) to 7T images using MITK and then resampled to MRSI resolution. We derived a tumor mask from manual segmentation by a neuroradiologist. As second mask for NAWM distant to the tumor was defined using GM/WM-segmentation of MP2RAGE data (voxels with WM content>90%, removal of tumor segmentation and peritumoral region, additional erosion of two layers). For the evaluation using Python, all data was gathered in a voxel-wise array. Voxel PET tumor-to-brain ratios (TBR) were calculated using the mean activity of the NAWM mask. Voxel-wise metabolic ratios were calculated for tCho/tNAA, tCho/tCr, Gln/tNAA, Gln/tCr, and Gly/tNAA, Gly/tCr as we had defined these previously as most promising candidates4. To define hot spots for comparison, we used cutoff values of 1.25 for PET TBRs and the 3rd quartile in the NAWM mask of every metabolite ratio.
Our comparison consisted of the calculation of DICE-coefficients and center of intensity (COI) distance between PET and all metabolite hot spots as well as apparent volumes.
Results
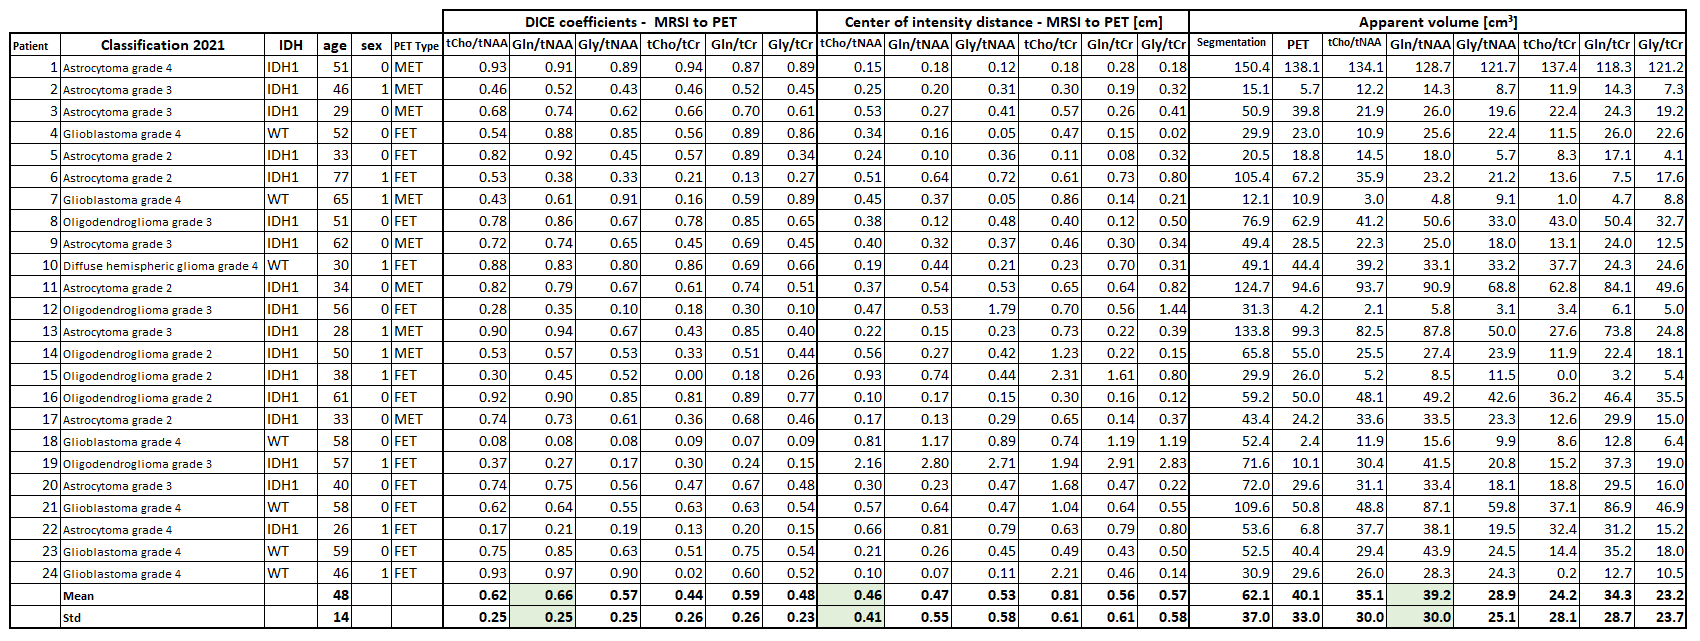
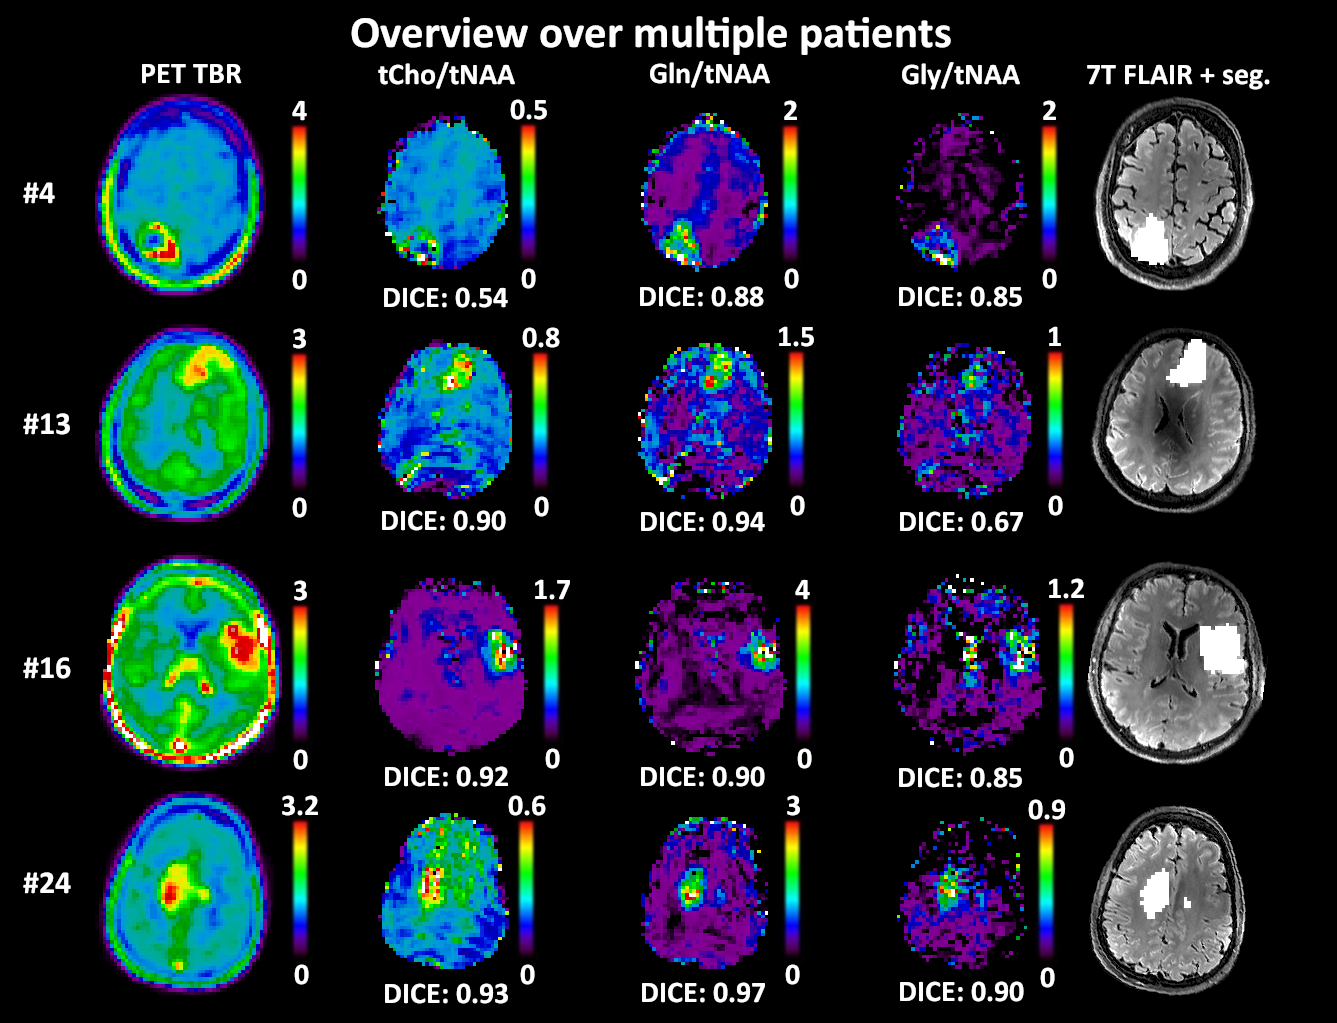
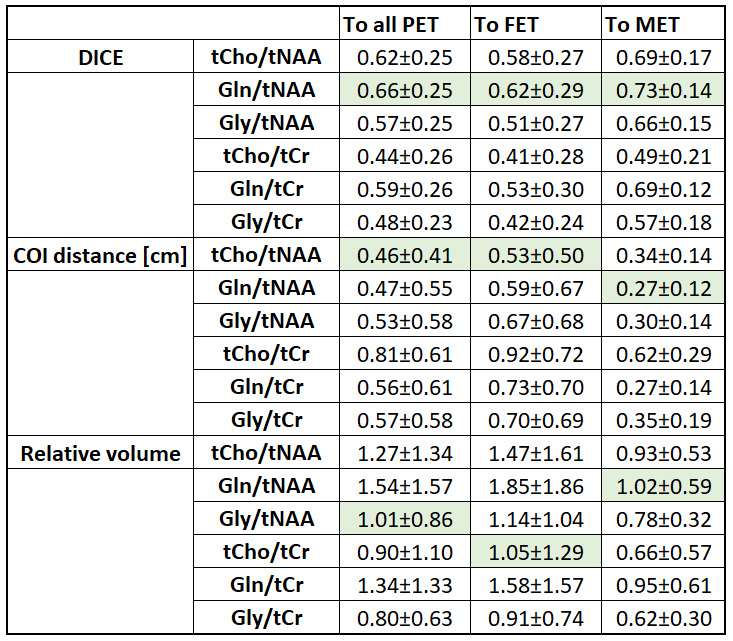
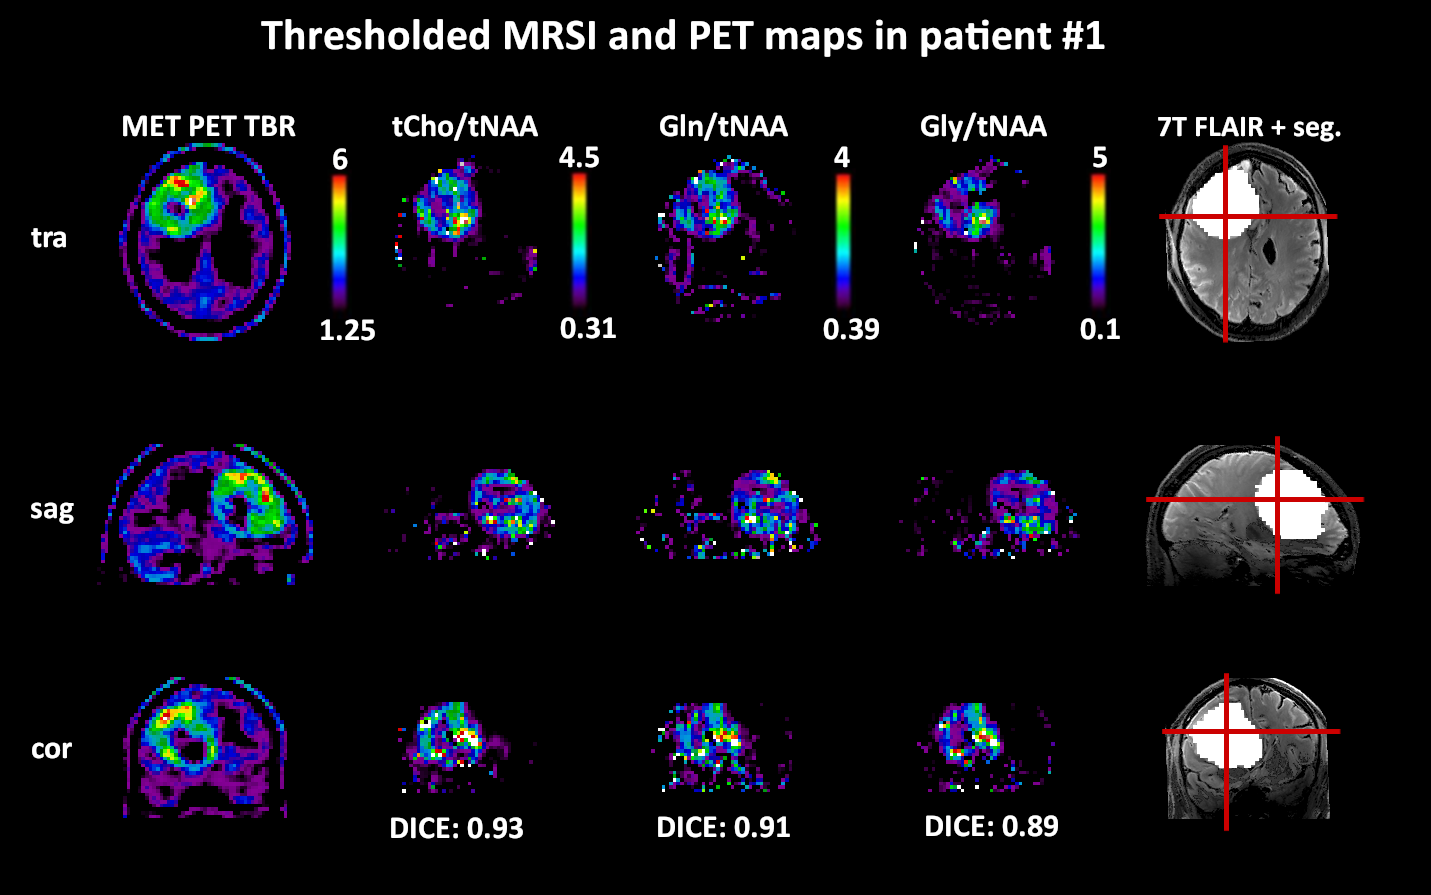
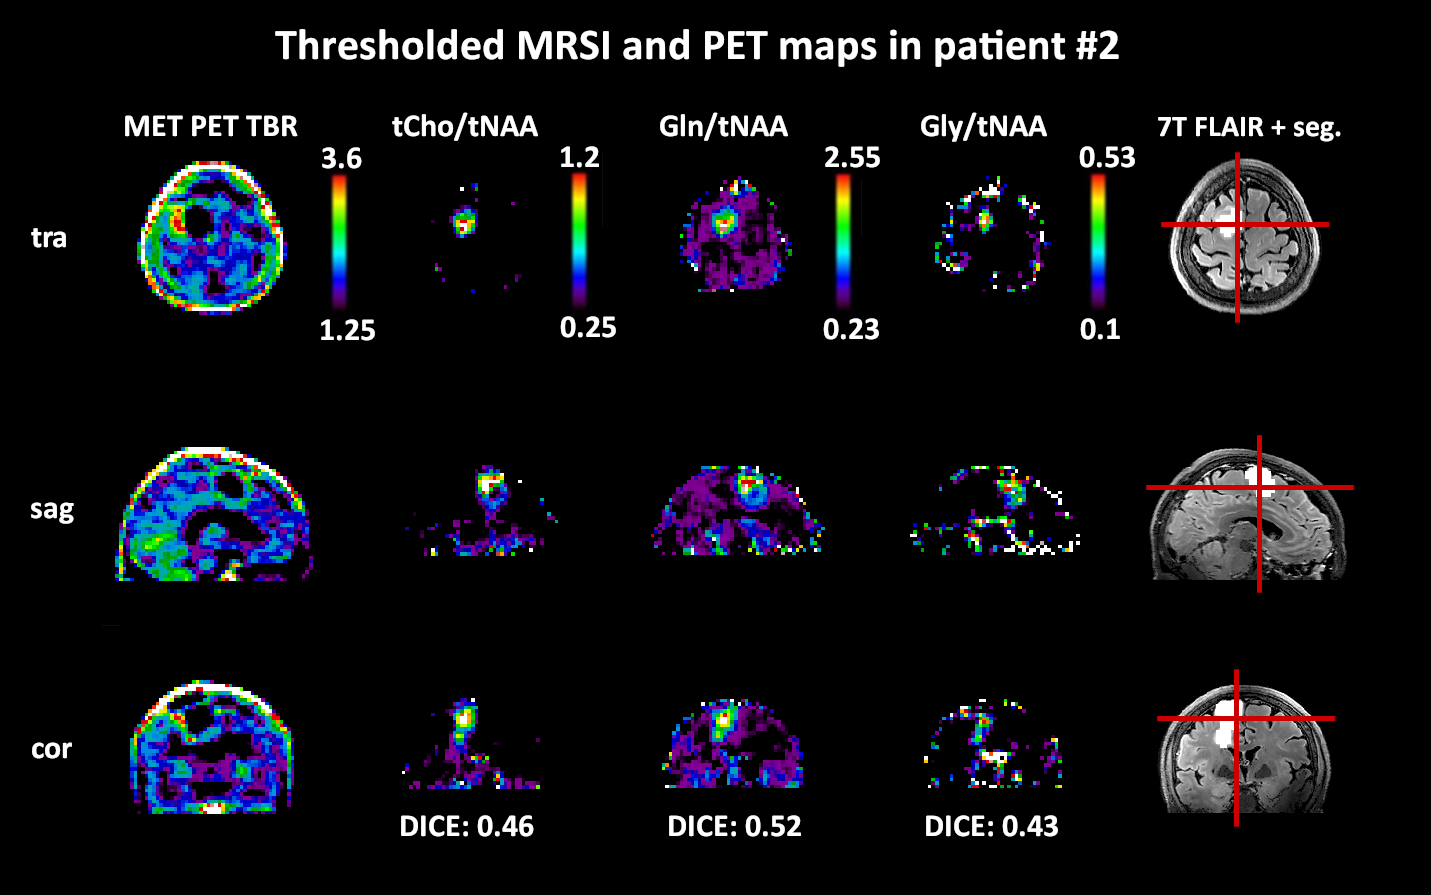
We obtained mean DICE coefficients of 0.62±0.25 for tCho/tNAA, 0.66±0.25 for Gln/tNAA, 0.57±0.25 for Gly/tNAA, 0.44±0.26 for tCho/tCr, 0.59±0.26 for Gln/tCr, and 0.48±0.23 for Gly/tCr. Mean COI distances were 0.46±0.41 for tCho/tNAA, 0.47±0.55 for Gln/tNAA, 0.53±0.58 for Gly/tNAA, 0.81±0.61 for tCho/tCr, 0.56±0.61 for Gln/tCr, and 0.57±0.58 for Gly/tCr. The mean hot spot volume was 1.27±1.34 for tCho/tNAA, 1.54±1.57 for Gln/tNAA, 1.01±0.86 for Gly/tNAA, 0.90±1.10 for tCho/tCr, 1.34±1.33 for Gln/tCr, and 0.80±0.63 for Gly/tCr. Figure 2 shows different examples of the correspondence between PET and MRSI maps. Patient-wise results are presented in Figure 1, while an overview for both PET types is given in Figure 3.The general correspondence to tumor segmentation and PET was highest for Gln/tNAA with the best DICE score and largest hot spot volume. Generally, the lowest DICE scores were cases with very small or outside of segmented PET hot spots, with an equal number of cases with DICE scores of 0.9+. tCho/tNAA featured the least COI distance to PET, while most distances were under 1 cm. Ratios to tCr resulted in lower DICE, less volume and longer distances than those to tNAA. Separation of FET and MET PET showed higher DICE scores for MET, which appears to be related to smaller relative MRSI hot spot volumes (see Figure 3). Figures 4 and 5 show detailed images for cases with high and low correspondence between MRSI and PET.
Discussion
With the 7T MRSI benefits of higher resolution and Gln and Gly as additional markers, we achieved higher correlation between PET and MRSI than previous studies2,6 such as higher DICE and lower COI distance, albeit different methodologies make exact comparison difficult. Especially the amino acid Gln appears to correlate better to amnio acid PET than other MRSI markers. Currently, we are limited by the size of the study cohort and the reliance on metabolite ratios. Concentration estimation, a wider cohort, and an investigation of other metabolites and different thresholds within and outside of tumor segmentation could improve the comparison of our 7T MSRI method and clinical PET. Beyond this, comparing Gln-MRSI to Gln-PET7 could confirm our findings.Acknowledgements
This study was supported by the Austrian Science Fund (FWF): KLI-646, P 30701 and P 34198.References
1Widhalm et al., J Neurol Neurosurg Psychiatry 2010, doi: 10.1136/jnnp.2010.205229
2Mauler et al., J Nucl Med 2018, doi: 10.2967/jnumed.117.196709
3Hingerl et al., Invest Rad. 2020, doi: 10.1097/RLI.0000000000000626
4Hangel et al., NeuroImage: Clinical 2020, doi: 10.1016/j.nicl.2020.102433
5Bilgic et al., MRM 2013, doi: 10.1002/mrm.24399
6Bisdas et al., Invest Radiol. 2013, doi: 10.1097/RLI.0b013e31827188d6
7Venneti et al., Sci Transl Med. 2015, doi: 10.1126/scitranslmed.aaa1009
Figures