0048
SKM-TEA: A Dataset for Accelerated MRI Reconstruction with Dense Image Labels for Quantitative Clinical Evaluation1Electrical Engineering, Stanford University, Stanford, CA, United States, 2Radiology, Stanford University, Stanford, CA, United States, 3Computer Science, Stanford University, Stanford, CA, United States, 4Bioengineering, Stanford University, Stanford, CA, United States, 5Biomedical Data Science, Stanford University, Stanford, CA, United States
Synopsis
While deep-learning-based MRI reconstruction and image analysis methods have shown promise, few have been translated to clinical practice. This may be a result of (1) paucity of end-to-end datasets that enable comprehensive evaluation from reconstruction to analysis and (2) discordance between conventional validation metrics and clinically useful endpoints. Here, we present the Stanford Knee MRI with Multi-Task Evaluation (SKM-TEA), a dataset of 155 clinical quantitative 3D knee MRI scans with k-space data, DICOM images, and dense tissue segmentation and pathology annotations to facilitate clinically relevant, comprehensive benchmarking of the MRI workflow. Dataset, code, and trained baselines are available at https://github.com/StanfordMIMI/skm-tea.
Introduction
Despite the extensive deep learning (DL) research in accelerated MRI reconstruction and automated image analysis (e.g. segmentation, pathology detection), few methods have been deployed prospectively in clinical practice1. Existing datasets are designed to handle single tasks (e.g. only MRI reconstruction), making it impossible to evaluate the end-to-end reconstruction to image analysis workflow2–4. Additionally, current image quality and region-of-interest (ROI) metrics used to benchmark these techniques are discordant with clinically relevant endpoints5,6.To mitigate this challenge, we present the Stanford Knee MRI with Multi-Task Evaluation (SKM-TEA) dataset, a collection of quantitative knee MRI (qMRI) scans that enables end-to-end, clinically relevant evaluation of MRI reconstruction, segmentation, and detection methods (Fig.1). This 1.6TB dataset consists of k-space measurements of anonymized patient MRI scans, DICOM images, manual segmentations of four tissues, and bounding box annotations for sixteen different pathologies. Using the reconstruction and analysis tasks, we introduce a framework for using T2 parameter maps as a new metric for measuring the quality of clinically relevant qMRI biomarker estimates. Dataset, code, and state-of-the-art trained baselines are available at https://github.com/StanfordMIMI/skm-tea.
The SKM-TEA Dataset
Collection Overview: 155 clinical patients received a 3T knee MRI (GE MR750) scan with a sagittal 3D quantitative double echo steady state (qDESS) sequence with informed consent and IRB approval7–11.Collected Data: Multi-coil k-space data was acquired with 2x1 parallel imaging with elliptical sampling. Unsampled k-space data was synthesized using Autocalibrating Reconstruction for Cartesian imaging (GE Orchestra) and was considered to be the fully-sampled k-space. Scanner-generated magnitude DICOM images were also collected. The qDESS scans were used to analytically compute cartilage and meniscus T2 parameter maps, which are sensitive to physiological changes due to factors including aging, trauma and early osteoarthritis12.
Annotations: Manual segmentations were performed for femoral, tibial, and patellar cartilage, and the meniscus. Board-certified radiologist reports the described sixteen pathological categories across joint effusion, meniscal and ligament tears, and cartilage lesions were translated into localized 3D bounding boxes.
Challenge Tracks: The SKM-TEA dataset enables two tracks with multi-task evaluation: (1) the Raw Data Track for all tasks and (2) the DICOM Track for image analysis tasks (Fig.1).
Methods
We assessed the utility of SKM-TEA by (1) incorporating diagnostically relevant qMRI analysis as a standardized evaluation metric and (2) benchmarking state-of-the-art DL-based reconstruction and segmentation models.T2-based qMRI Evaluation: We propose a qMRI-based evaluation benchmark that compares regional T2 accuracy between ground-truth and model-reconstruction-based T2 parameter maps and segmentations13,14 (Fig.2). For reproducibility, all T2 parameter map estimation and tissue sub-region division is performed with the open-source DOSMA framework15,16.
Benchmarks: U-Net and unrolled networks were trained to reconstruct 2D Poisson Disc undersampled axial slices for the two qDESS echoes (E1, E2) at 6x/8x accelerations17–19. Models were trained with different input configurations: two separate models for E1 and E2 (E1/E2); a single model for both echoes, with each echo a unique training example (E1+E2); (3) a single model for both echoes, with E1 and E2 as multiple channels (E1$$$\oplus$$$E2). For segmentation, V-Net and U-Net models were trained on DICOM images to segment all four tissues20. Separate models were trained on E1-only, E2-only, multi-channel E1-E2 (E1$$$\oplus$$$E2), and the root-sum-of-squares (RSS) of the two echoes.
Metrics: In addition to the T2 qMRI metric, reconstruction and segmentation performance was measured with image quality (structural similarity [SSIM], peak signal-to-noise ratio [pSNR]) and ROI (Dice, average symmetric surface distance [ASSD]) metrics, respectively. Concordance between the qMRI metric and reconstruction and segmentation metrics was measured with Pearson’s correlation coefficient ($$$\rho$$$).
Results
Unrolled reconstruction models outperformed U-Net at both accelerations and across both echoes (Table 1). There was a negligible performance difference with different input configurations amongst same architectures. U-Net (E1+E2) had the least bias for patellar and tibial cartilage T2 estimates at 6x and for patellar cartilage at 8x. However, U-Net approaches had higher variance (>1.0ms) in these estimates compared to unrolled models.E1, E1$$$\oplus$$$E2, and RSS segmentation models had the highest performance and consistently outperformed E2 on both ROI and T2 accuracy metrics (Table 2). These methods also had higher variance (>0.6ms), which may indicate higher variability in the estimates despite low bias. V-Net models achieved higher performance compared to U-Net models among standard ML segmentation metrics, but had similar performance among T2 error metrics.
Reconstruction (SSIM, pSNR) and segmentation metrics (DSC, ASSD) had very weak correlation with absolute T2 error across all four tissues ($$$\rho \leq$$$0.52 and 0.4, respectively [Fig.3]).
Discussion
While standard image quality metrics indicated superior performance of unrolled reconstructions, T2 errors of these models were more variable. Among segmentation models, low SNR and contrast of E2 compared to E1 may result in higher variability in segmentations and T2 quantification.The discordance between relative differences for ML and qMRI metrics may suggest that standard ML metrics may not represent true clinical utility. Thus, using diagnostically relevant T2 biomarkers as direct endpoints for quantifying performance may help mitigate this challenge.
Conclusion
In this work, we introduce SKM-TEA, a quantitative knee MRI dataset that enables comprehensive, clinically relevant benchmarking of the end-to-end MRI workflow. We hope the SKM-TEA dataset and open-source code can enable a broad spectrum of research for modular image reconstruction and image analysis in a clinically informed manner.Acknowledgements
Research support provided by NIH R01 AR077604, NIH R01 EB002524, NIH K24 AR062068, NSF-GRFP 1656518, DOD-NDSEG ARO, Precision Health and Integrated Diagnostics Seed Grant from Stanford University, Stanford Artificial Intelligence in Medicine and Imaging GCP grant, Stanford Human-Centered Artificial Intelligence GCP grant, GE Healthcare, and Philips.References
1. Chaudhari AS, Sandino CM, Cole EK, et al. Prospective Deployment of Deep Learning in MRI: A Framework for Important Considerations, Challenges, and Recommendations for Best Practices. J Magn Reson Imaging. 2021;54(2):357-371. doi:10.1002/jmri.273312. Zbontar J, Knoll F, Sriram A, et al. fastMRI: An Open Dataset and Benchmarks for Accelerated MRI. 2018:1-29. http://arxiv.org/abs/1811.08839.
3. Ong F, Amin S, Vasanawala S, Lustig M. Mridata. org: An open archive for sharing MRI raw data. In: Proc. Intl. Soc. Mag. Reson. Med. Vol 26. ; 2018:1.
4. Peterfy CG, Schneider E, Nevitt M. The osteoarthritis initiative: report on the design rationale for the magnetic resonance imaging protocol for the knee. Osteoarthr Cartil. 2008;16(12):1433-1441. doi:10.1016/j.joca.2008.06.016
5. Knoll F, Zbontar J, Sriram A, et al. {fastMRI}: A Publicly Available Raw k-Space and {DICOM} Dataset of Knee Images for Accelerated {MR} Image Reconstruction Using Machine Learning. Radiol Artif Intell. 2020;2(1):e190007. doi:10.1148/ryai.2020190007
6. Desai AD, Caliva F, Iriondo C, et al. The international workshop on osteoarthritis imaging knee MRI segmentation challenge: a multi-institute evaluation and analysis framework on a standardized dataset. Radiol Artif Intell. 2021;3(3):e200078.
7. Chaudhari AS, Stevens KJ, Sveinsson B, et al. Combined 5‐minute double‐echo in steady‐state with separated echoes and 2‐minute proton‐density‐weighted 2D FSE sequence for comprehensive whole‐joint knee MRI assessment. J Magn Reson Imaging. 2019;49(7):e183-e194. doi:10.1002/jmri.26582
8. Chaudhari AS, Grissom MJ, Fang Z, et al. Diagnostic Accuracy of Quantitative Multicontrast 5-Minute Knee {MRI} Using Prospective Artificial Intelligence Image Quality Enhancement. Am J Roentgenol. 2021;216(6):1614-1625. doi:10.2214/ajr.20.24172
9. Chaudhari AS, Sveinsson B, Moran CJ, et al. Imaging and T2 relaxometry of short-T2 connective tissues in the knee using ultrashort echo-time double-echo steady-state (UTEDESS). Magn Reson Med. 2017;78(6):2136-2148. doi:10.1002/mrm.26577
10. Eijgenraam SM, Chaudhari AS, Reijman M, et al. Time-saving opportunities in knee osteoarthritis: T2 mapping and structural imaging of the knee using a single 5-min MRI scan. Eur Radiol. December 2019. doi:10.1007/s00330-019-06542-9
11. Sveinsson B, Chaudhari AS, Gold GE, Hargreaves BA. A simple analytic method for estimating T2 in the knee from DESS. Magn Reson Med. 2017;38:63-70. doi:10.1016/j.mri.2016.12.018
12. Baum T, Joseph GB, Karampinos DC, Jungmann PM, Link TM, Bauer JS. Cartilage and meniscal T2 relaxation time as non-invasive biomarker for knee osteoarthritis and cartilage repair procedures. Osteoarthr Cartil. 2013;21(10):1474-1484. doi:10.1016/j.joca.2013.07.012
13. Monu UD, Jordan CD, Samuelson BL, Hargreaves BA, Gold GE, McWalter EJ. Cluster analysis of quantitative MRI T2 and T1$ρ$ relaxation times of cartilage identifies differences between healthy and ACL-injured individuals at 3T. Osteoarthr Cartil. 2017;25(4):513-520. doi:10.1016/j.joca.2016.09.015
14. Crowder HA, Mazzoli V, Black MS, et al. Characterizing the transient response of knee cartilage to running: Decreases in cartilage T2 of female recreational runners. J Orthop Res. 2021.
15. Desai AD, Barbieri M, Mazzoli V, et al. DOSMA: A deep-learning, open-source framework for musculoskeletal MRI analysis. In: Proc. Intl. Soc. Mag. Reson. Med. Vol 27. ; 2019.
16. Desai A, Chaudhari A, Barbieri M. ad12/DOSMA. December 2019. doi:10.5281/zenodo.2559548
17. Ronneberger O, Fischer P, Brox T. U-Net: Convolutional Networks for Biomedical Image Segmentation. Lect Notes Comput Sci (including Subser Lect Notes Artif Intell Lect Notes Bioinformatics). 2015;9351:1-8. doi:10.1007/978-3-319-24574-4_28
18. Sandino CM, Cheng JY, Chen F, Mardani M, Pauly JM, Vasanawala SS. Compressed Sensing: From Research to Clinical Practice with Deep Neural Networks: Shortening Scan Times for Magnetic Resonance Imaging. IEEE Signal Process Mag. 2020;37(1):117-127. doi:10.1109/MSP.2019.2950433
19. Diamond S, Sitzmann V, Heide Gordon Wetzstein F, Heide F, Wetzstein G. Unrolled optimization with deep priors. arXiv Prepr arXiv170508041. 2017.
20. Milletari F, Navab N, Ahmadi SA. V-Net: Fully convolutional neural networks for volumetric medical image segmentation. In: Proceedings - 2016 4th International Conference on 3D Vision, 3DV 2016. Institute of Electrical and Electronics Engineers Inc.; 2016:565-571. doi:10.1109/3DV.2016.79
Figures
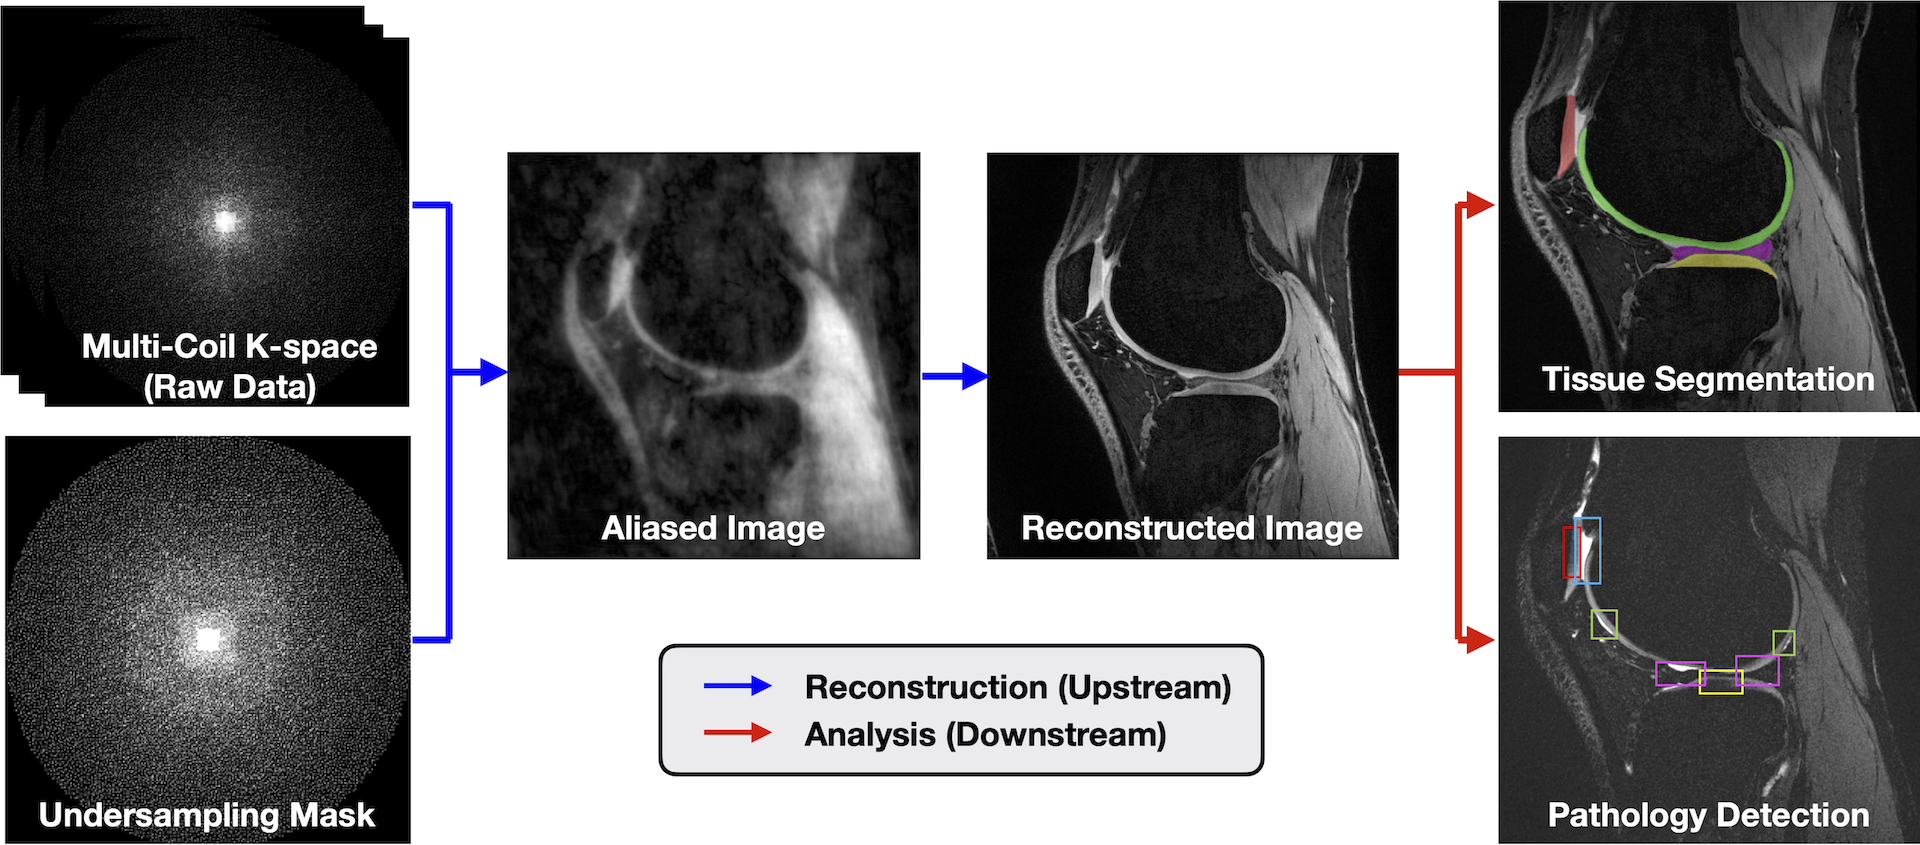
Fig.1: SKM-TEA consists of multi-coil k-space data, DICOM images, and dense annotations to enable reconstruction, segmentation, pathology detection, and classification tasks. This dataset offers both a Raw Data Track and DICOM Track. The Raw Data Track leverages the raw k-space data and dense labels to enable tasks pertaining to MRI reconstruction, image segmentation, pathology detection, and qMRI parameter estimation. The DICOM Track enables image analysis tasks using scanner-generated, magnitude DICOM images and corresponding tissue segmentations and detection labels.
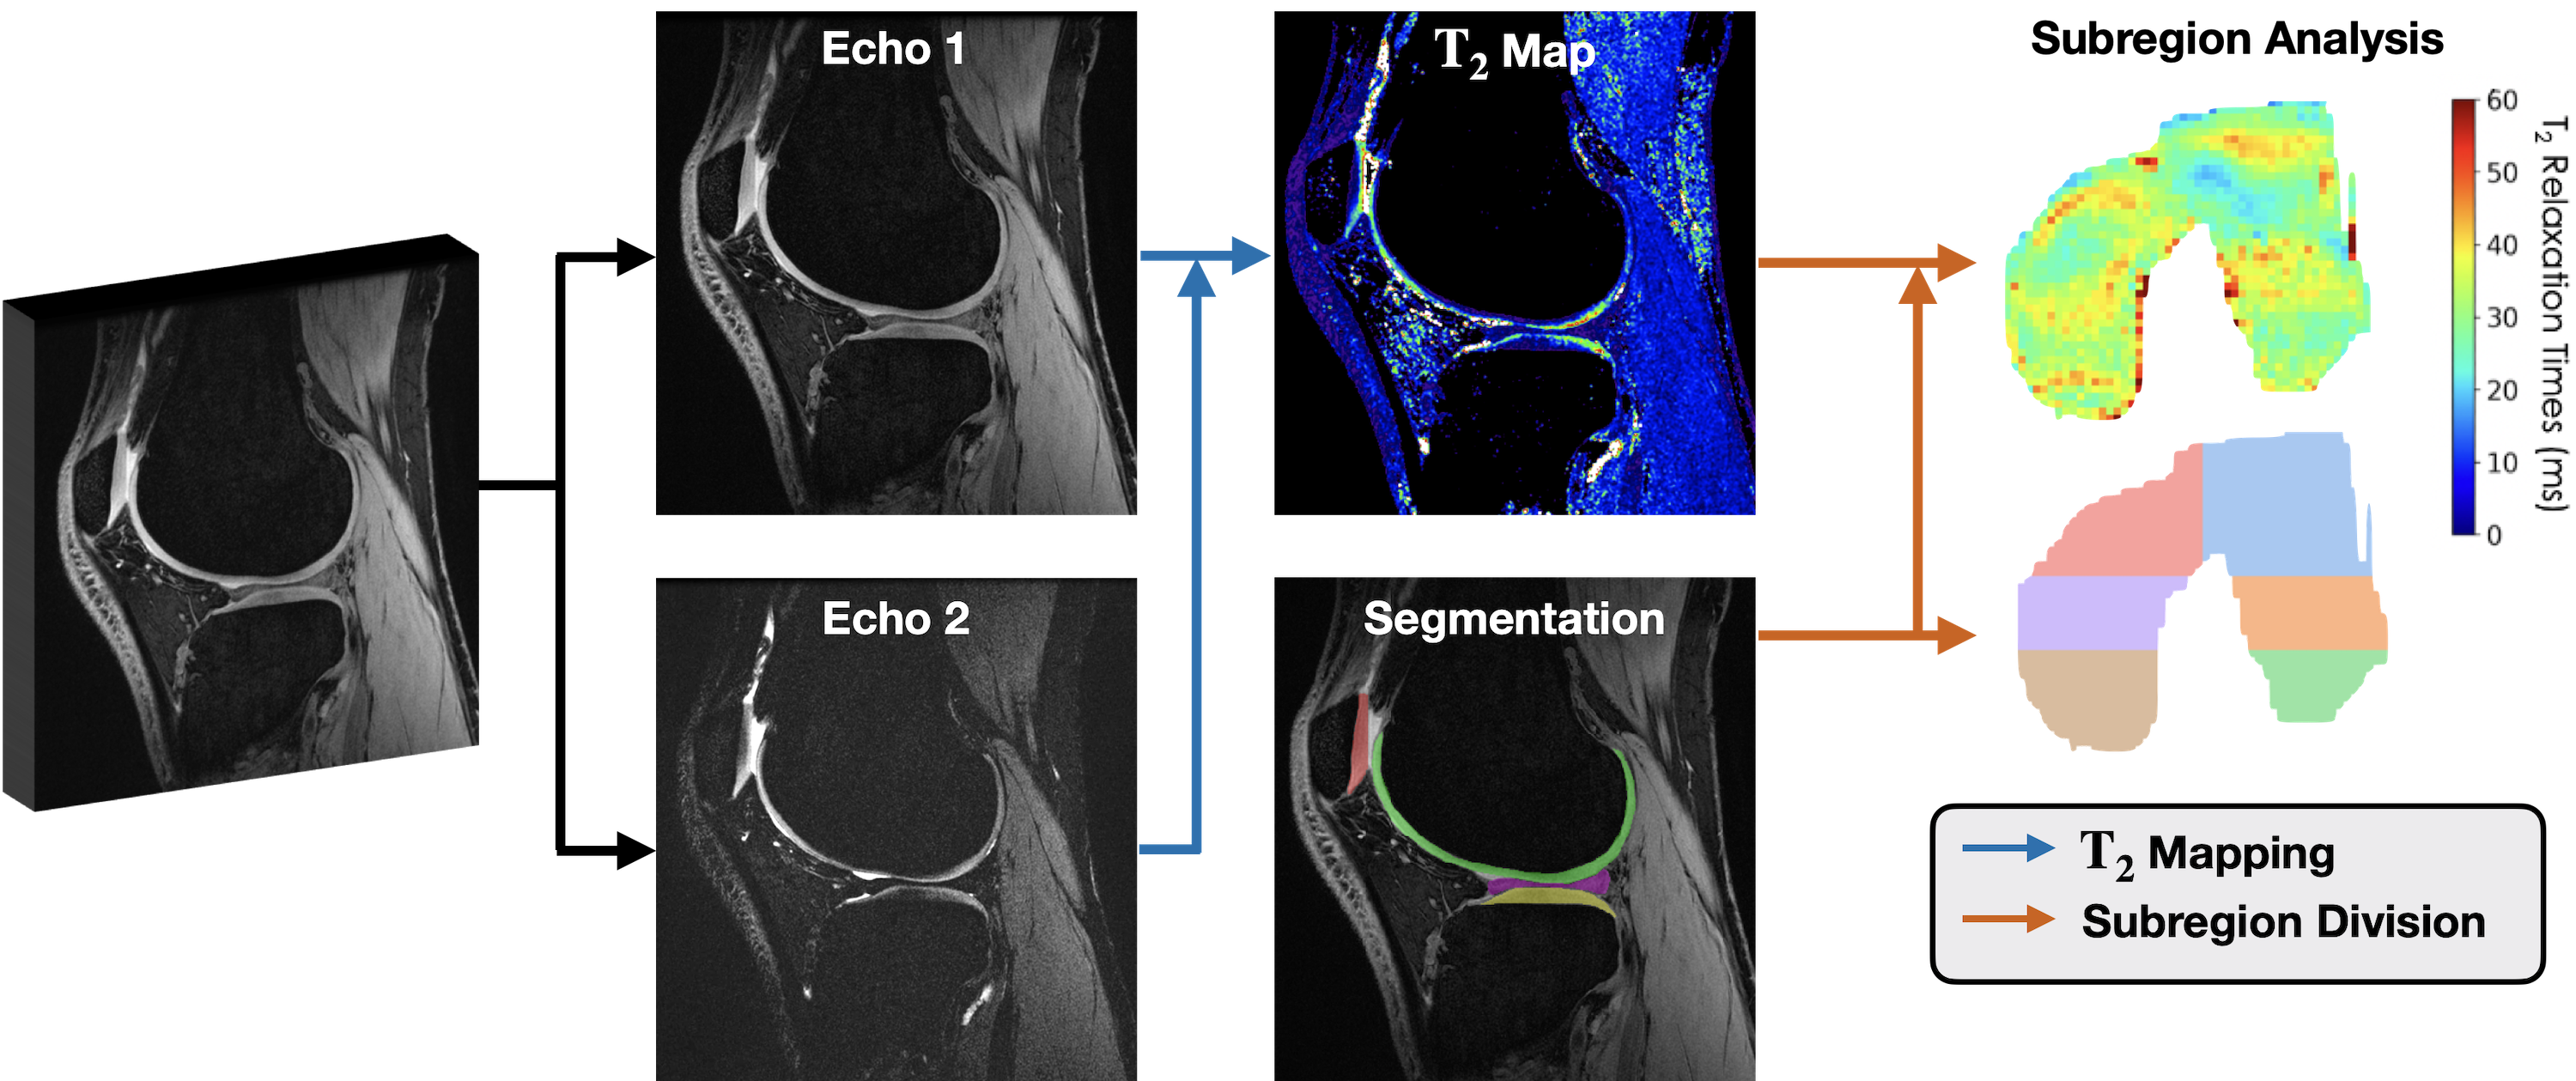
Fig.2: An overview of the regional T2 estimation pipeline. Reconstructed qDESS echoes are used to compute T2 parameter maps. Tissue segmentations of articular cartilage and meniscus are applied to mask relevant ROIs in the T2 map to localize tissue-specific T2 values. Segmentations are automatically divided into physiologically-relevant subregions to get more localized regions of T2 (e.g. 3D femoral cartilage projected onto 2D). Regional T2 estimates computed using ground truth data are compared to estimates produced using new methods for reconstruction or image segmentation.
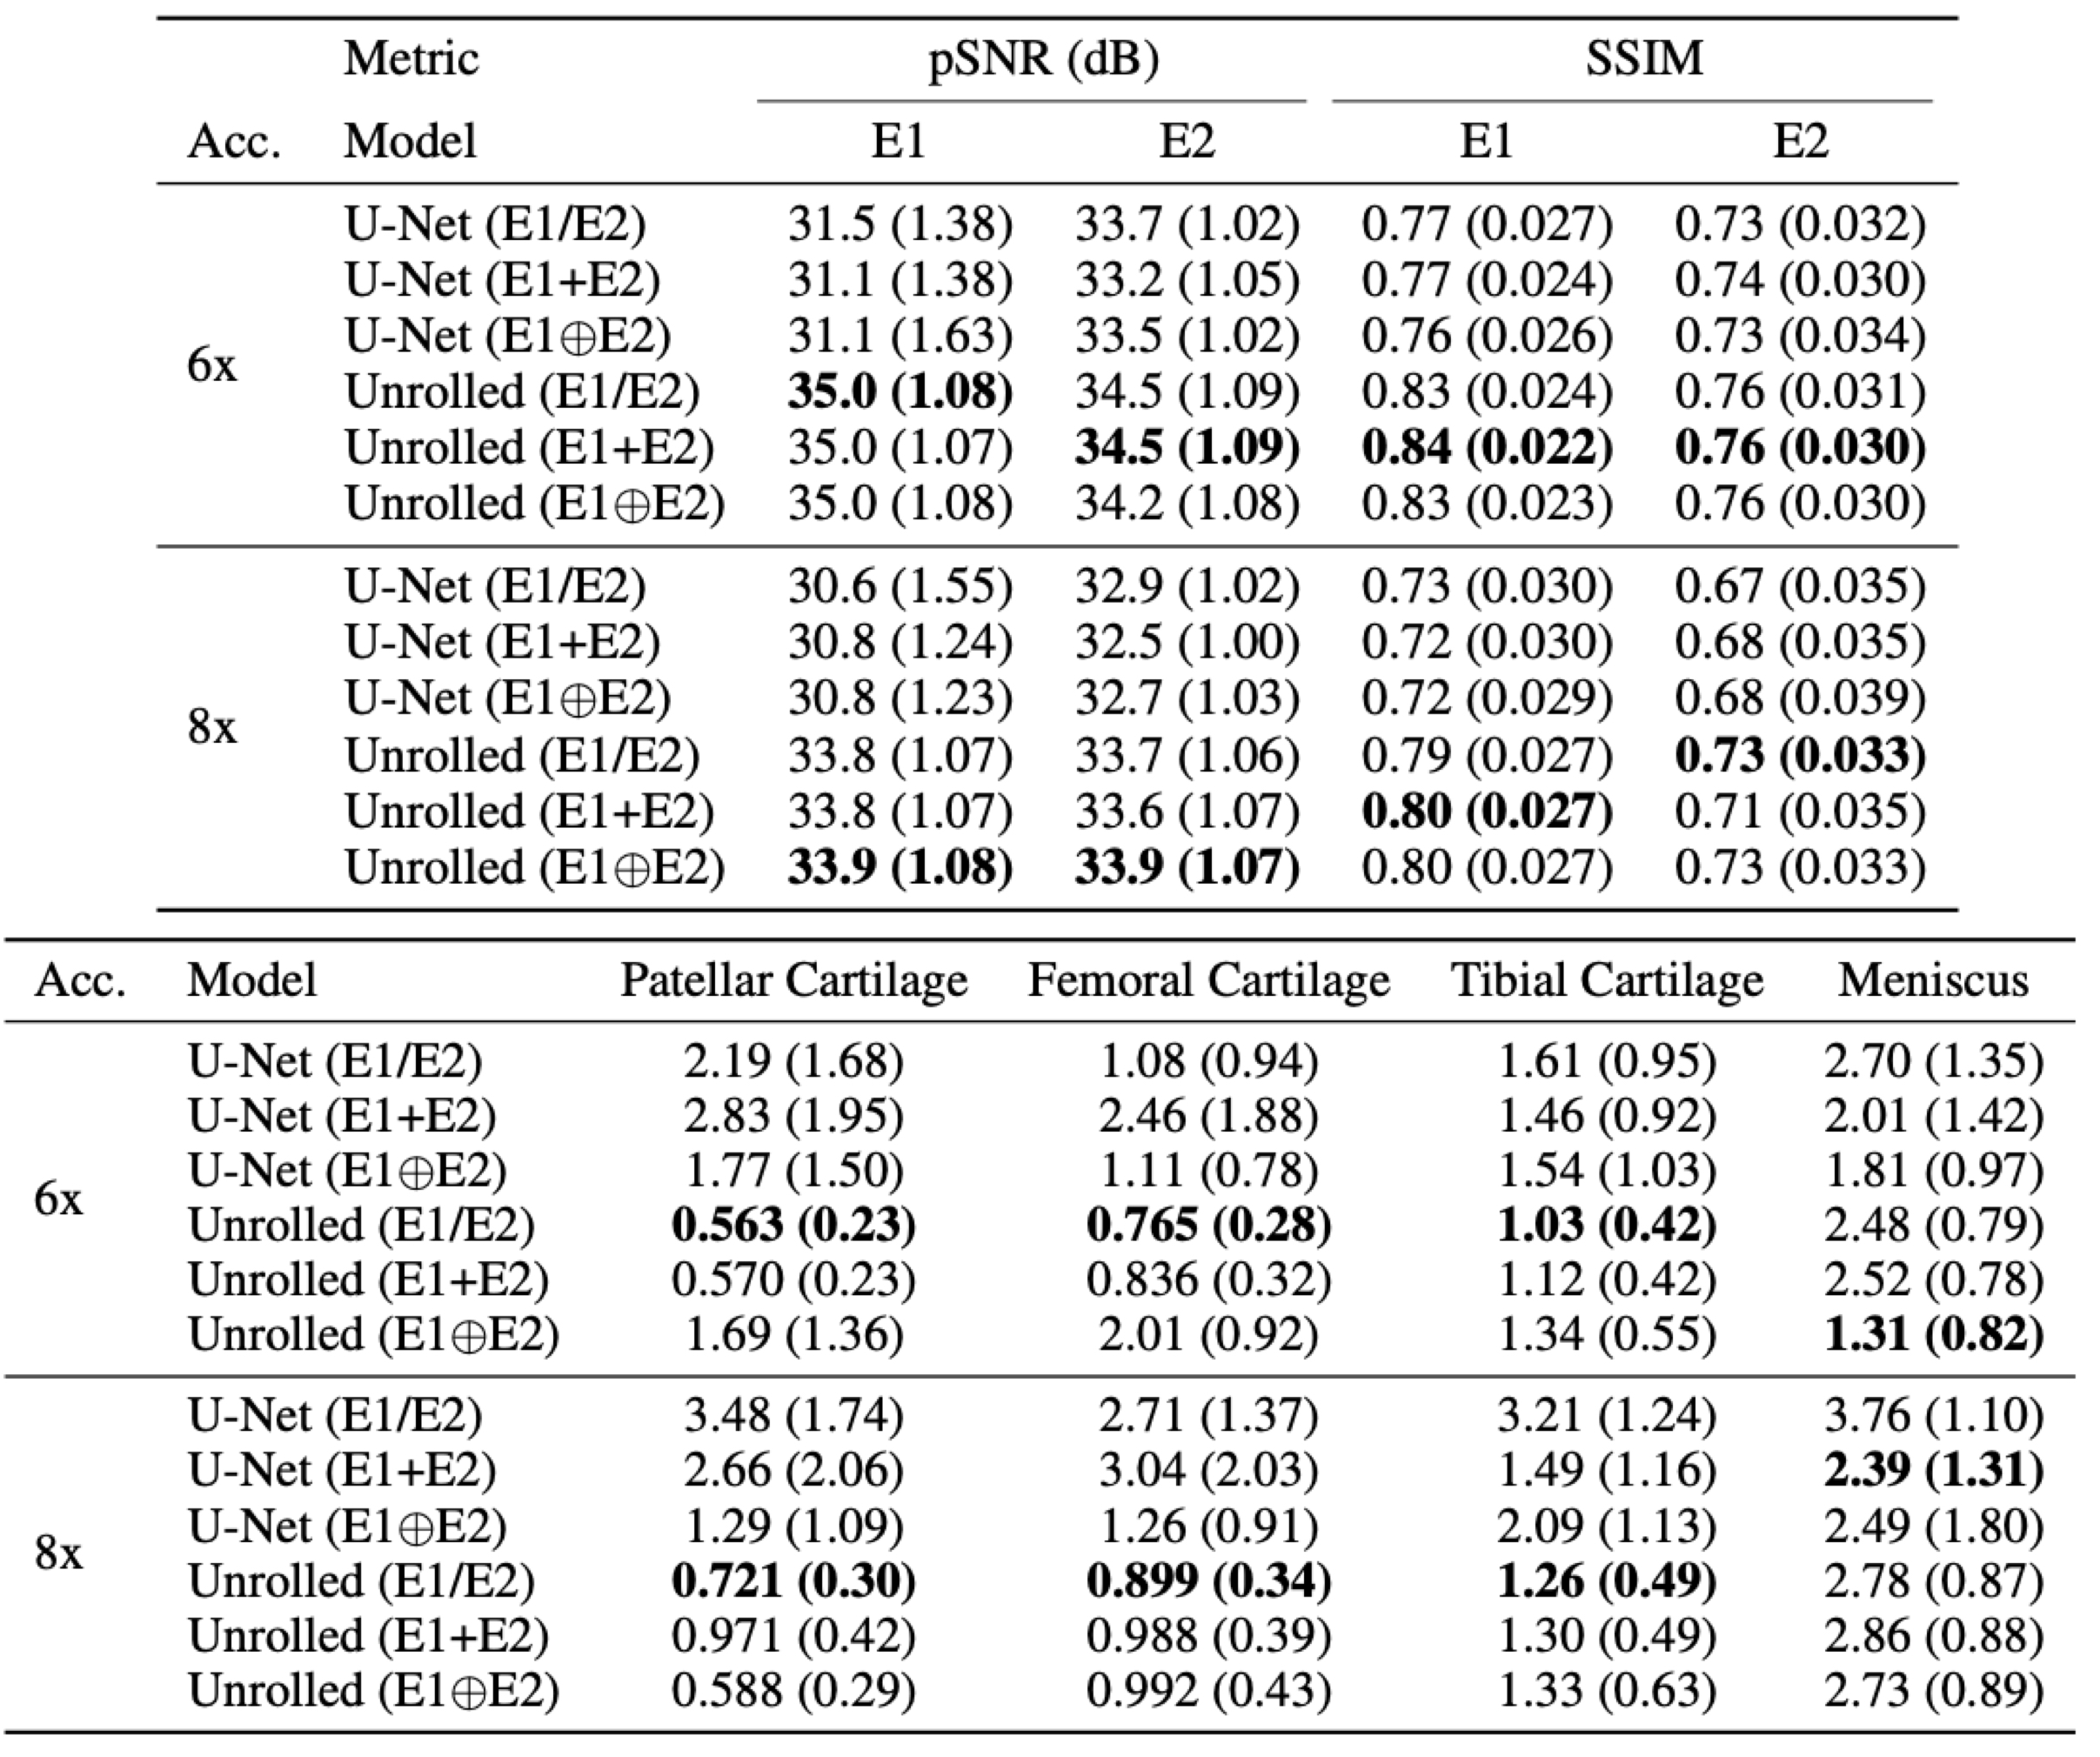
Table 1: Mean (std. dev.) performance of baseline reconstruction models on IQA metrics (pSNR/SSIM, top) and absolute T2 error (in ms, bottom). Typical cartilage T2 values are 30-40ms, while meniscus T2 values are 10-15ms. IQAs indicated superior performance of unrolled networks and were consistent among different input configurations. However, these networks had large absolute errors in T2 estimates, particularly in the meniscus, and volatile T2 errors with different configurations. This may indicate a need for qMRI-robust reconstruction methods for clinical translation.
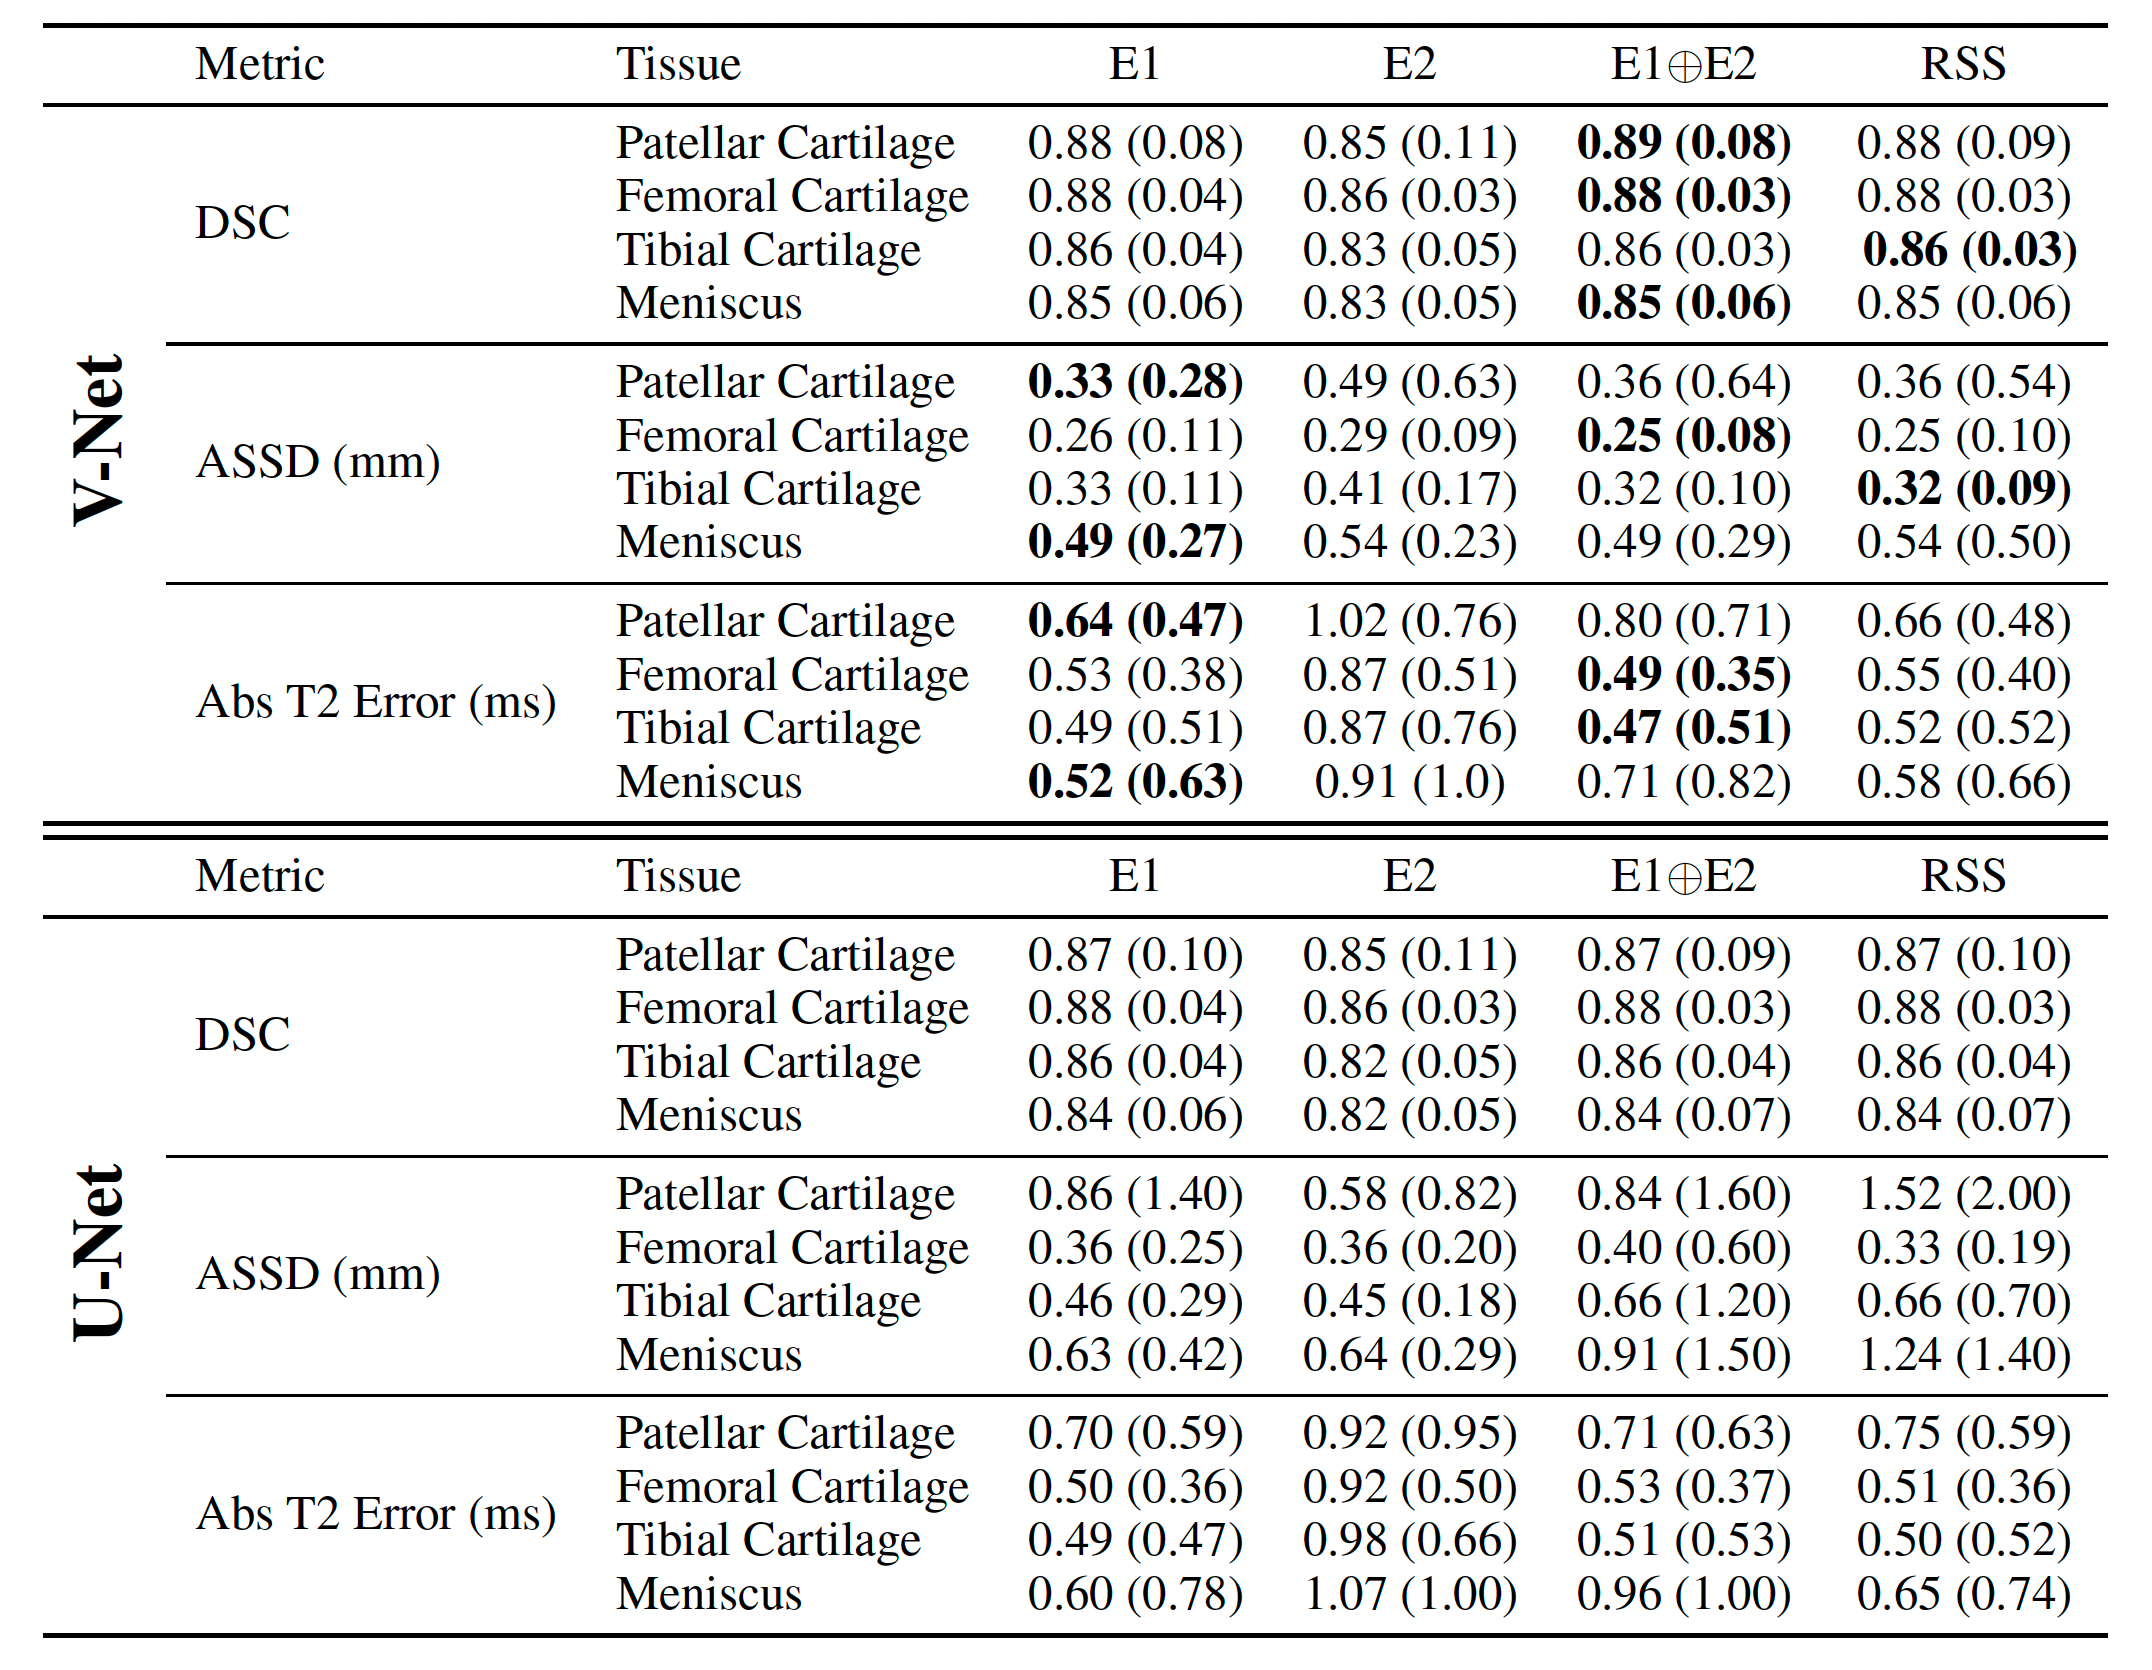
Table 2: Mean (std. dev.) performance of baseline V-Net (top) and U-Net (bottom) segmentation models measured by ROI metrics (Dice, ASSD) and absolute T2 error (in milliseconds). V-Net substantially outperforms U-Net among ROI metrics but achieves the same, and in some cases worse, absolute T2 error. Additionally, all methods had high variance in T2 error, which can result in low precision for regional T2 estimates.
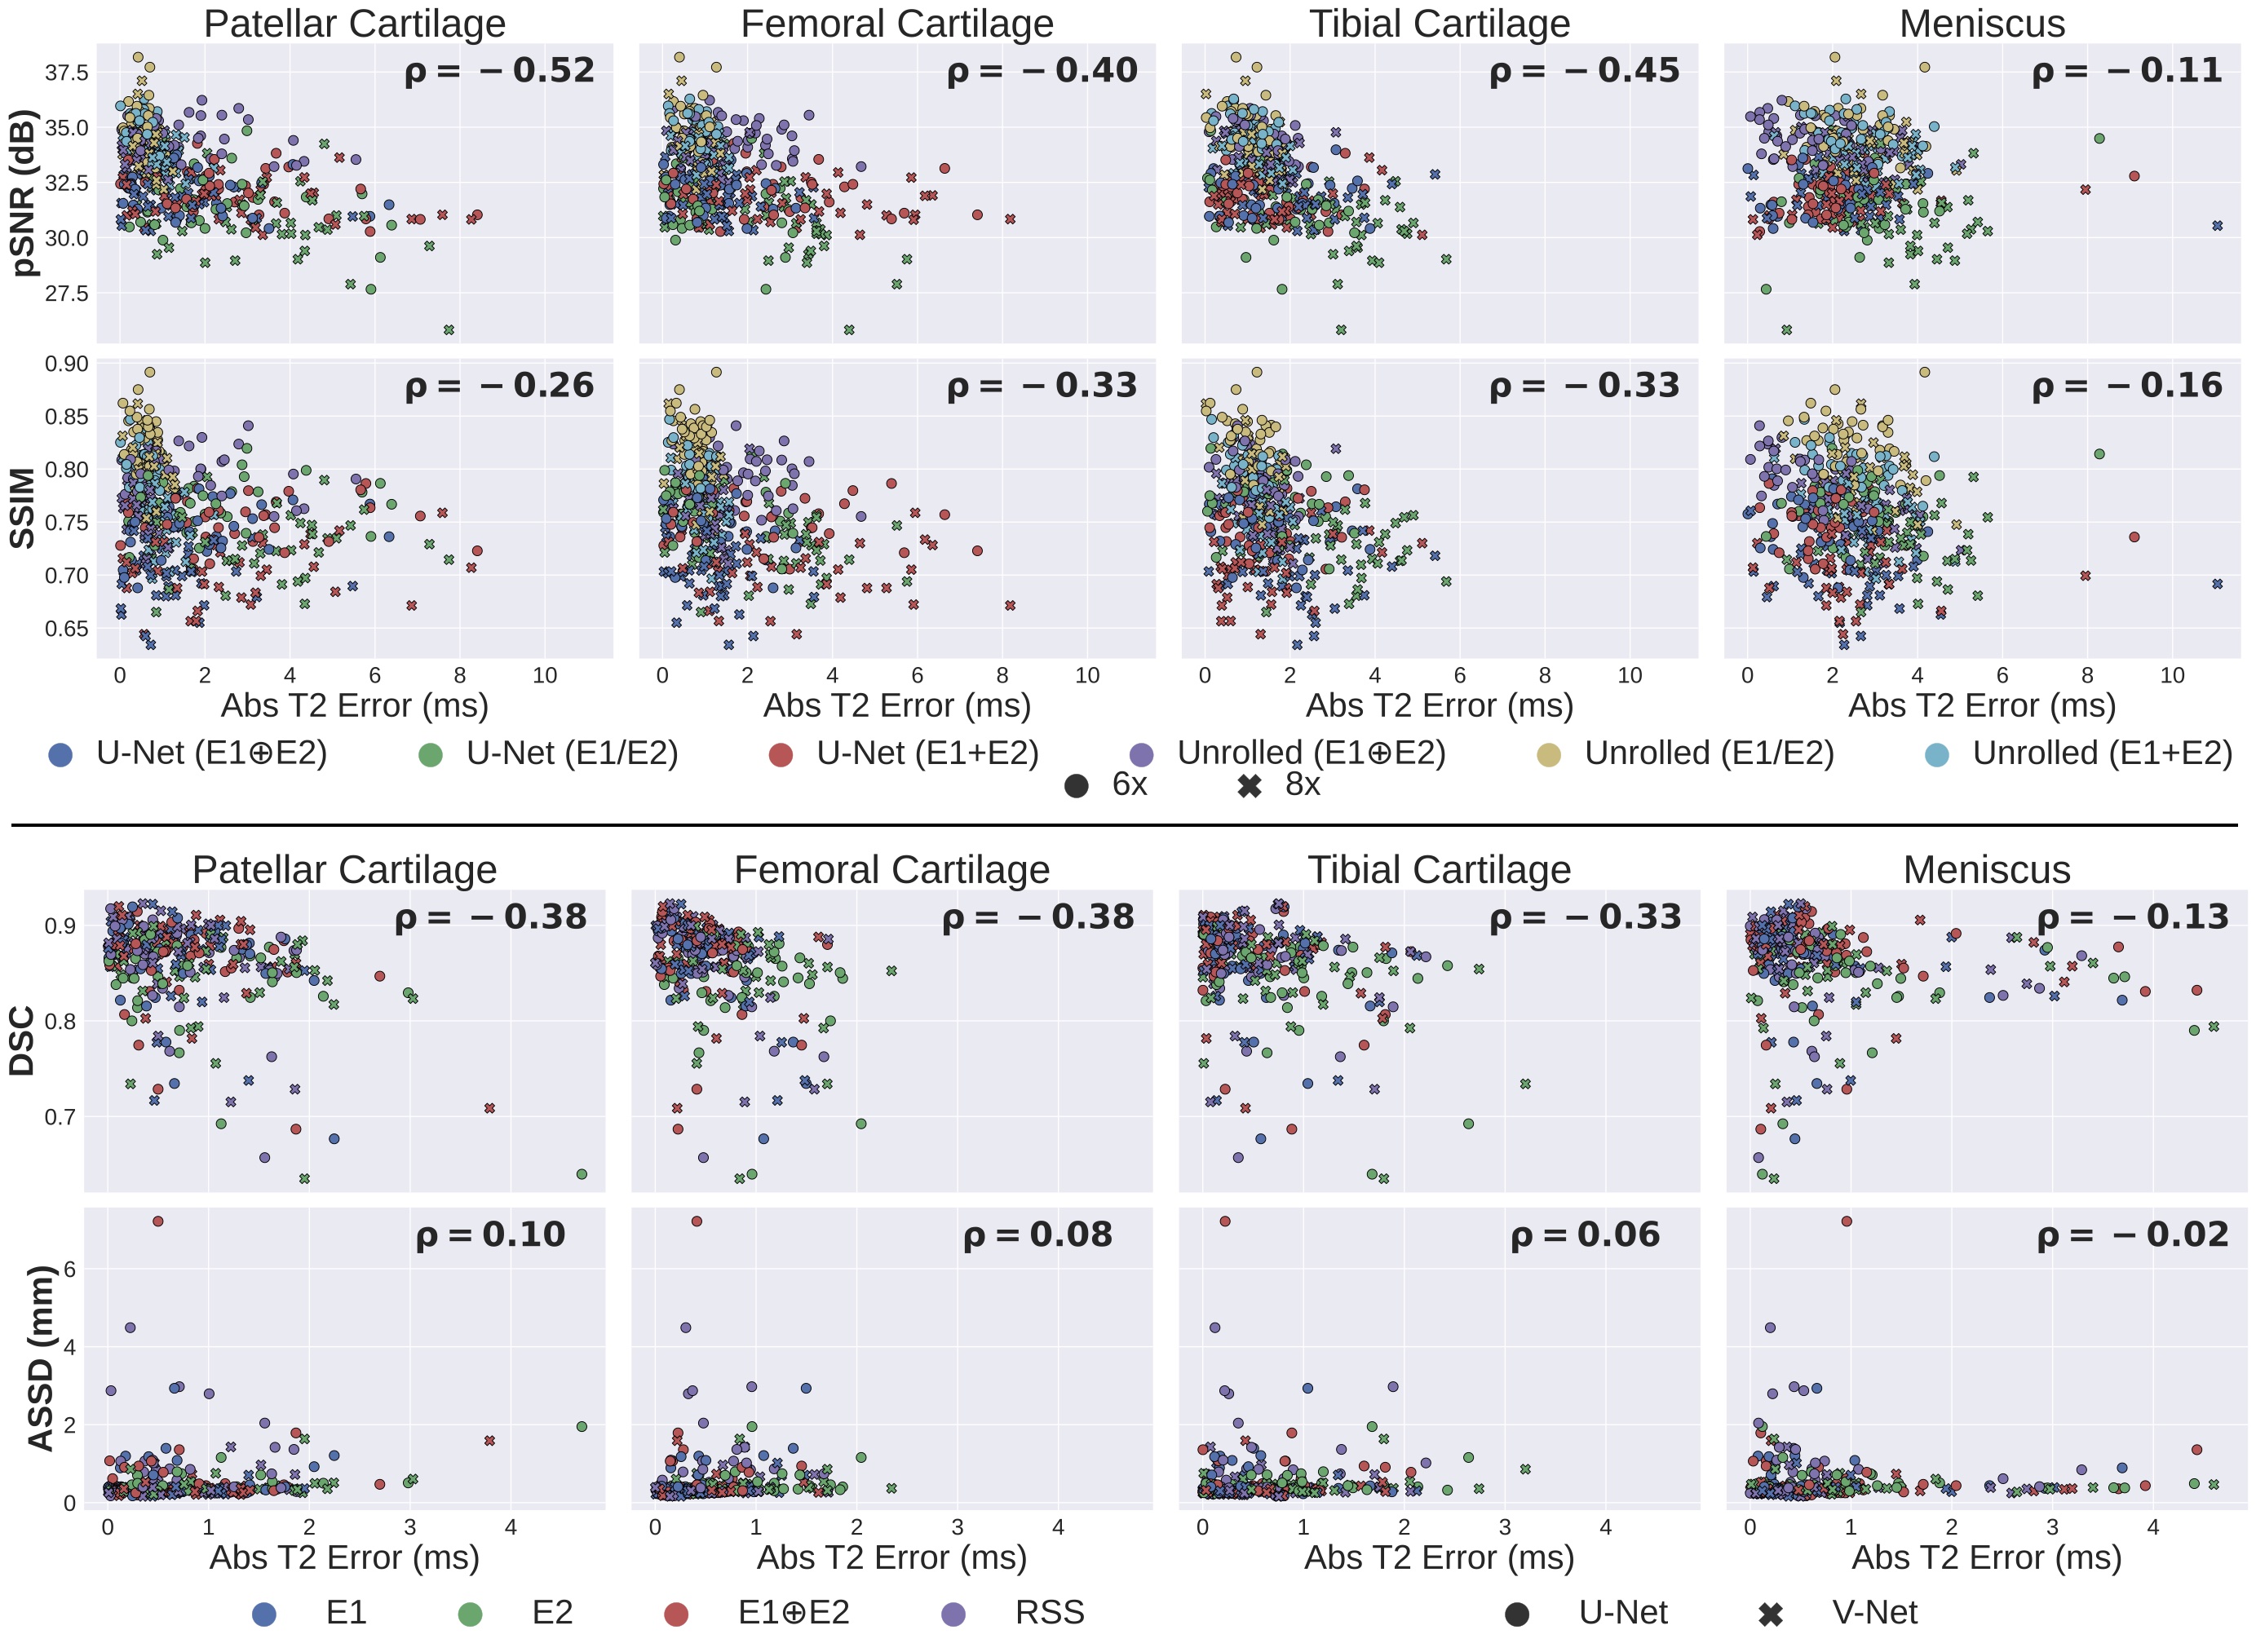
Fig.3: Correlation (ρ) between standard reconstruction (top) and segmentation (bottom) benchmarking metrics and absolute T2 error. All standard metrics have very weak correlation with T2 error. The discordance between relative differences for ML and qMRI metrics may suggest that standard ML metrics may not provide a holistic representation of performance differences between models. Thus, using only ML metrics for benchmark comparison may lead to inconsistencies between reported performance and practical utility. With SKM-TEA, both standard and qMRI metrics can be assessed.