0046
Optimization of perfusion measurements at 7 T using pulsed ASL with simultaneous multi-slice EPI readouts at multiple post-labelling delays1Department of Cognitive Neuroscience, Maastricht University, Maastricht, Netherlands, 2Techna Institute, University Health Network, Toronto, ON, Canada, 3Siemens Healthineers, Erlangen, Germany, 4Techna Institute & Koerner Scientist in MR Imaging, Toronto, ON, Canada
Synopsis
Arterial spin labeling (ASL) at 7T is beneficial due to the higher signal-to-noise ratio (SNR) and the longer T1 of blood and tissues. A whole-brain 7T pulsed ASL approach with simultaneous multi-slice (SMS) echo planar imaging readouts at multiple inversion times is presented. The interplay between the number of inversion times acquired, the total acceleration factor employed, and the temporal SNR was investigated. In summary, a protocol with in-plane acceleration factor 2 and SMS factor 2 offers the best compromise between perfusion tSNR and number of inversion times and can be used in clinical applications investigating perfusion parameters beyond CBF.
Introduction
Arterial spin labeling (ASL) at 7 Tesla is very attractive due to the higher image signal-to-noise ratio (SNR) and the longer T1 relaxation times of blood and tissues as compared to lower field strengths1,2. However, ASL at 7T has yet to reach its full potential, especially for clinical applications, because of the technical challenges its successful implementation presents. Previous work has focused on reducing the effects of B0- & B1-inhomogeneities as well as minimizing the specific absorption rate (SAR) in order to improve the labeling efficiency and the temporal resolution3,4,5. Little attention has been paid to improving the efficiency of the 7T ASL acquisitions by acquiring data at multiple post-labeling delays (inversion times). In this work we extend our fast and SAR-efficient 7T PASL approach5 with simultaneous multi-slice echo planar imaging (SMS-EPI) readouts at multiple inversion times (multi-TI) to achieve better perfusion characterization with the aim to apply the technique in clinical scenarios. We specifically investigate the interplay between the number of inversion times acquired, the total acceleration factor employed, and the temporal signal-to-noise ratio (tSNR) obtained.Methods
Data was acquired after obtaining informed consent from six healthy volunteers (28 ± 4 years old, 3 female) on a 7T whole‐body MRI scanner (Siemens Healthineers), and a 1Tx/32Rx head coil (Nova Medical). The FAIR labeling scheme6 was combined in a prototype sequence, with a 2D blipped‐CAIPI7 SMS EPI readout employed at multiple inversion times in a Look-Locker regime. Slab-selective or non-selective inversion was done using an optimized 10 ms tr-FOCI pulse8, and two 18x18x0.5 cm3 high permittivity dielectric pads9 were placed on either side of the head at the level of the temporal lobes in order to further increase the labelling efficiency in the major arteries of the brain. All ASL measurements had 2.5‐mm isotropic nominal voxel size, 0.5 mm interslice gap, 80 TRs, flip angle = 10 degrees, echo time (TE)/TR = 11/2500 ms, echo‐spacing 0.53 ms, and 24 slices. The following variants were compared: in-plane acceleration factor/SMS-factor/Number of TIs/ = 1/2/5; 2/2/8/; 1/3/8; 1/4/11; 2/3/12; 2/4/16. The acquisition time per slice was 23.5 ms for the variants with in-plane acceleration and 33.04 ms for the ones without. The first inversion time for the lowermost slice in all acquisitions was 175 ms and the remaining time was filled with as many volume readouts as possible. In general, the higher the acceleration factor, the shorter the acquisition time per 3D volume and the larger the number of inversion times that could be acquired. Additional calibration scans were acquired to estimate the blood equilibrium magnetization (M0) for each acquisition variant with imaging parameters identical to the time‐series acquisition but with ASL preparation pulses set to zero amplitude and TR=20 s. Voxel-wise maps of the control tSNR, the mean perfusion-weighted signal and perfusion tSNR were generated. CBF, arterial arrival time maps and perfusion variance maps were computed using BASIL version 410.Results and Discussion
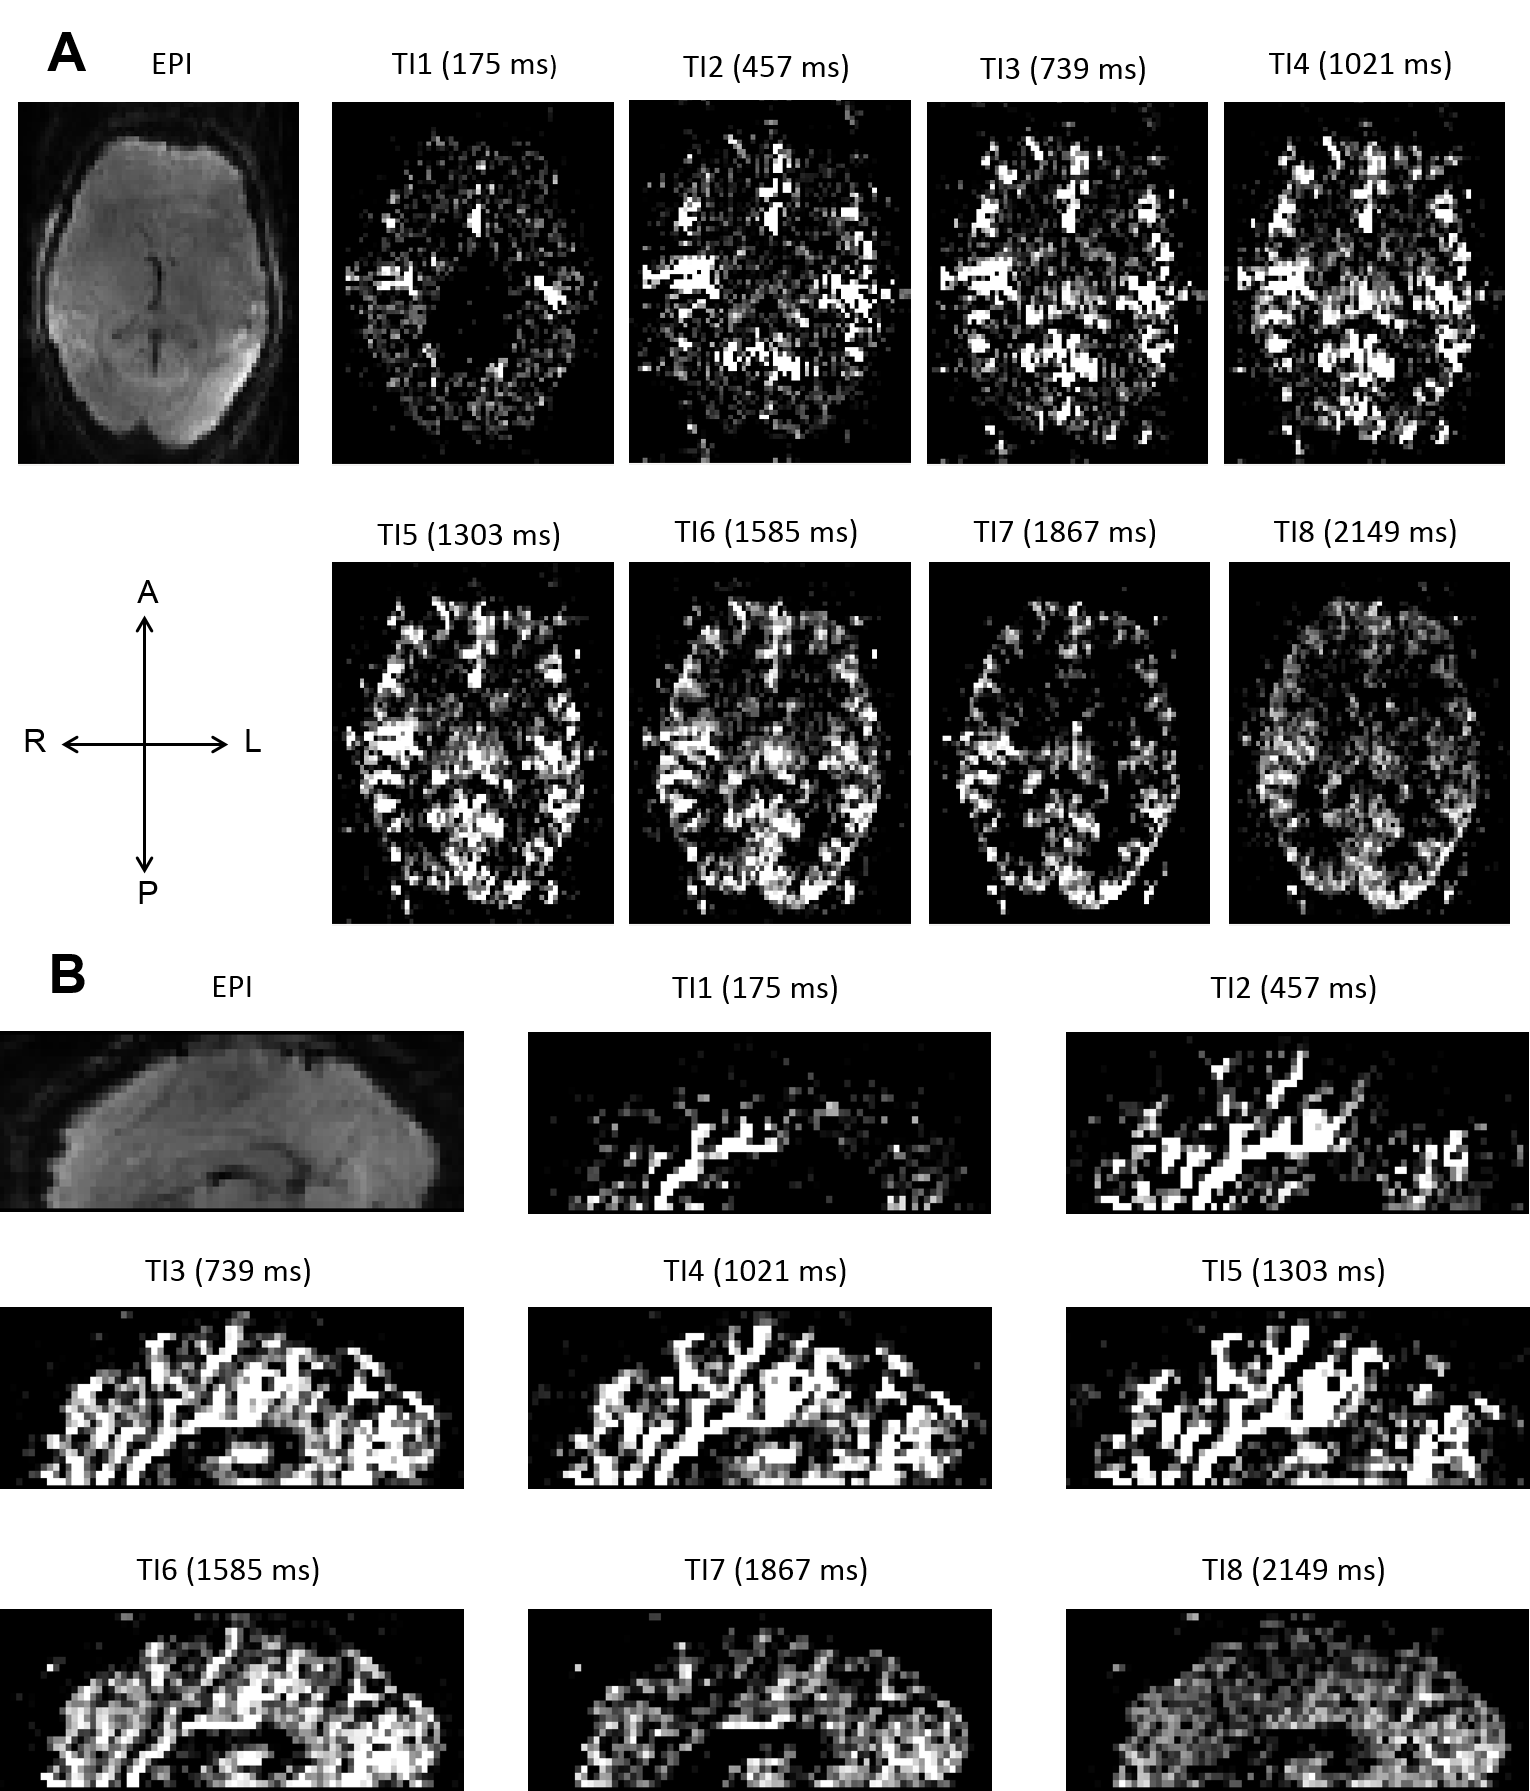
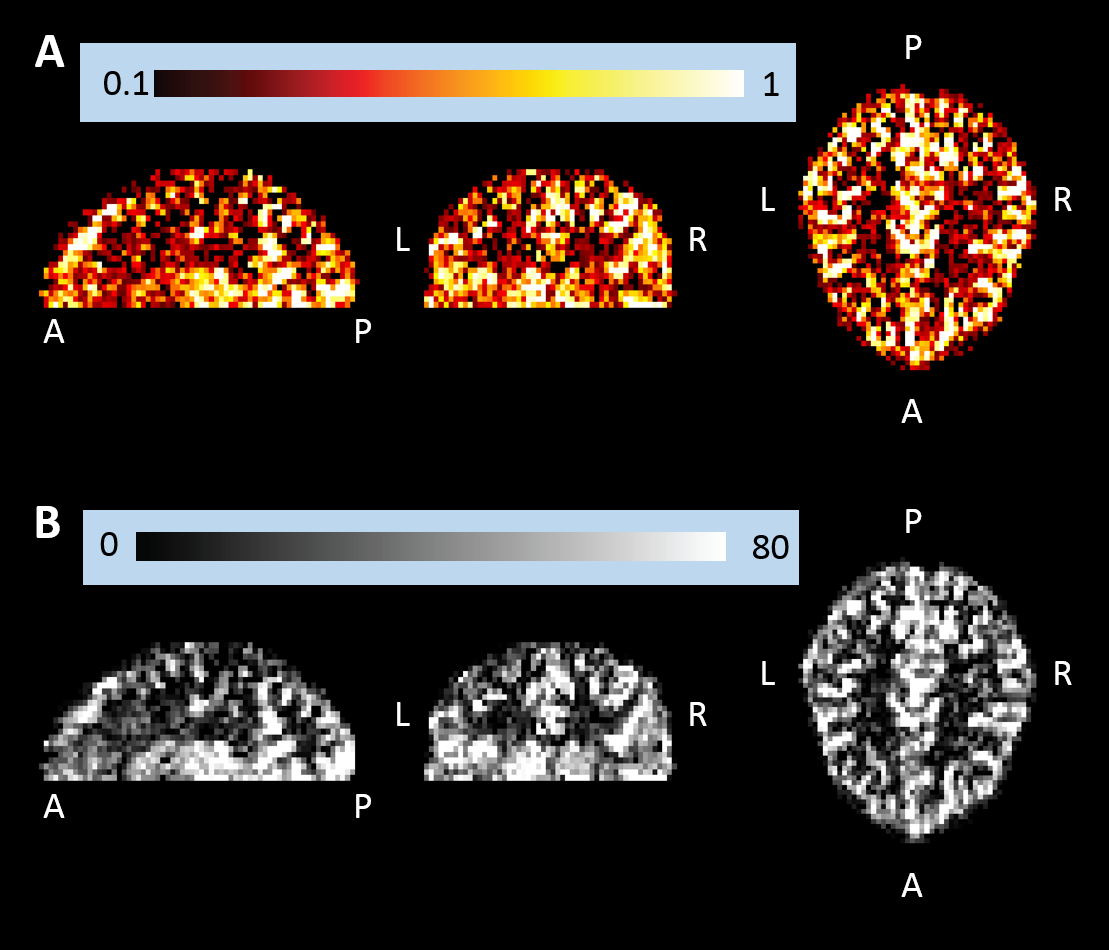
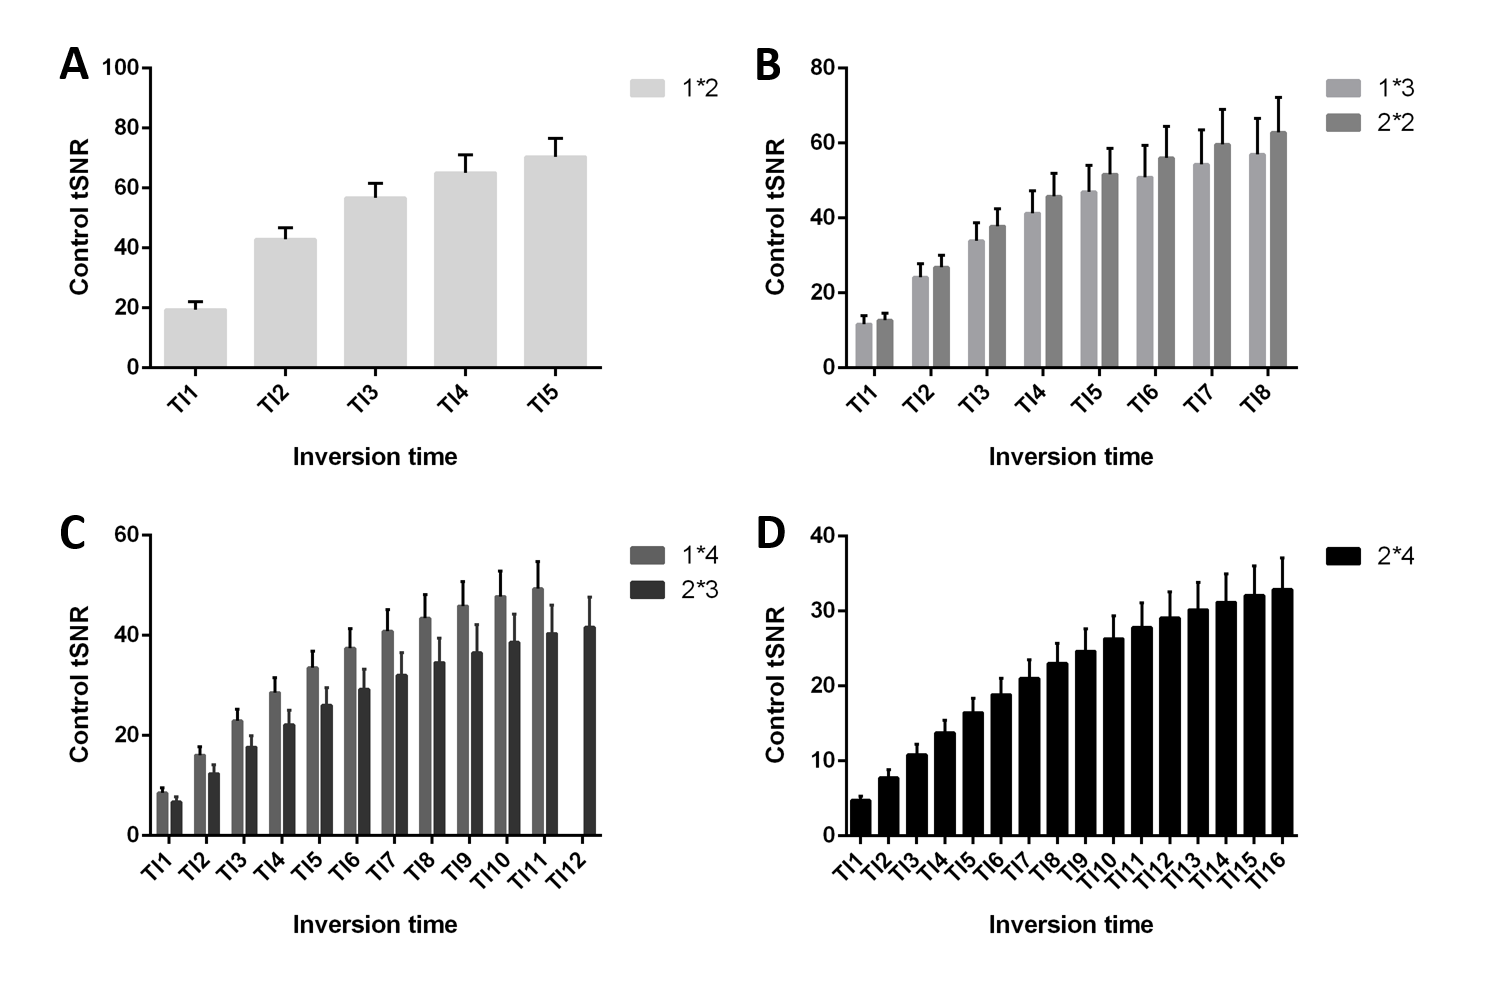
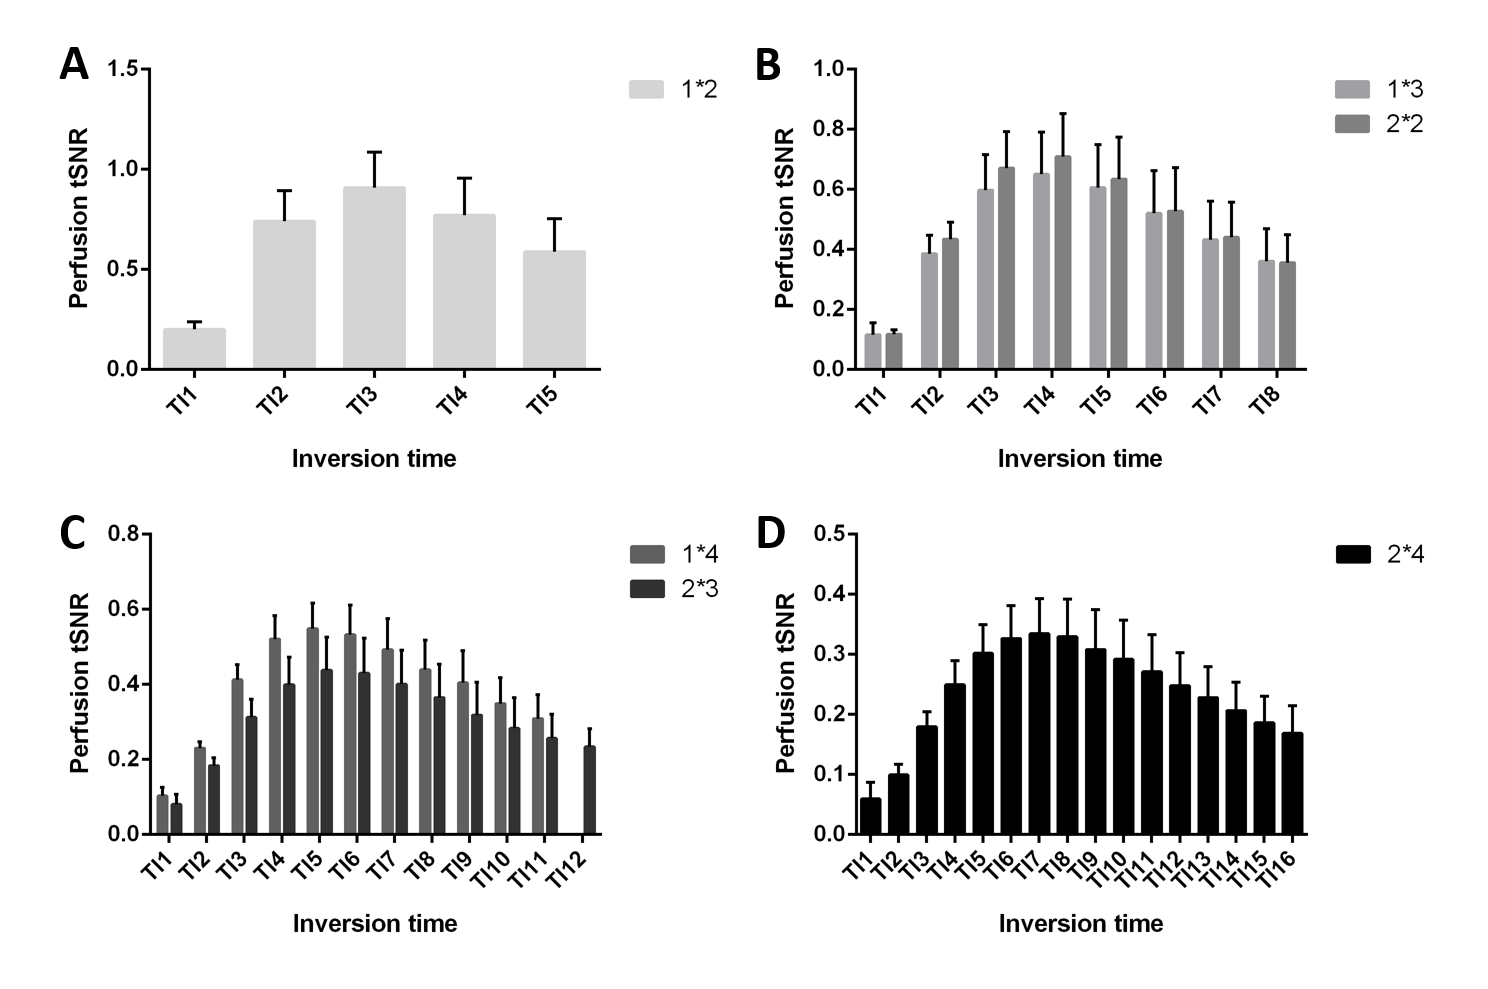
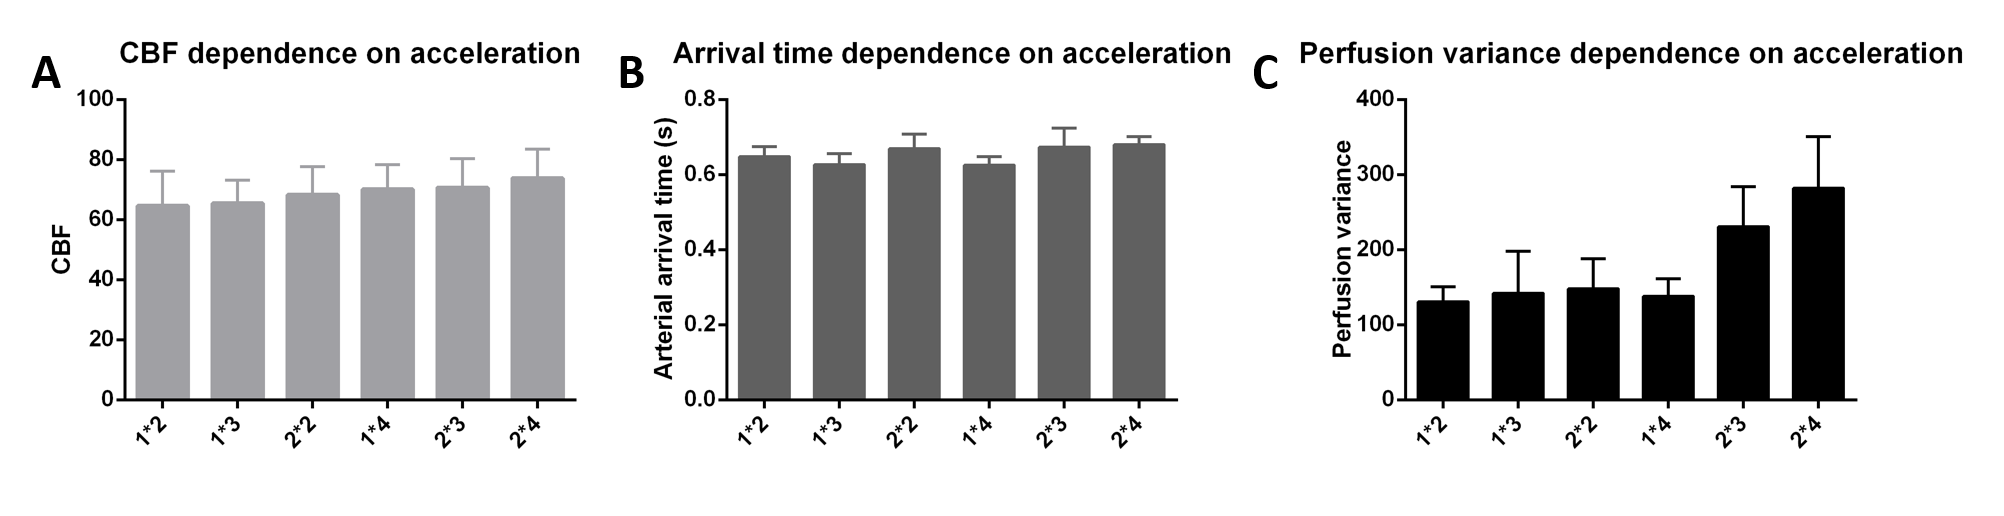
Representative single-subject mean perfusion-weighted images at the different inversion times from the GRAPPA=2/SMS=2 (2*2) protocol are depicted in Figure 1. The images demonstrate how the labeled blood signal starts from the large arteries, gets distributed throughout the brain, enters the small vessels, then the tissue and has largely decayed there by the end of the TR. Figure 2A shows a single-subject perfusion tSNR map from TI6 of the 2*2 protocol corresponding to inversion times between 1585 ms and 1844 ms often employed for single-TI approaches. Despite the short readout window, coverage close to whole-brain can be achieved with high spatial resolution and excellent data fidelity. Figure 2B depicts the CBF map (in mL blood/100 g tissue per min) from the same subject obtained using BASIL. Figures 3 and 4 exemplify the dependence of the mean control and perfusion tSNR, respectively, on the acceleration factors and inversion times. The control tSNR continuously rises with increasing inversion time within the same protocol, while higher total acceleration factors typically lead to lower control tSNR. Nevertheless, the 2*2 protocol displayed in 3B results in higher control tSNR than the alternative 1*3 and 1*4 protocols. In comparison, the perfusion tSNR shows a distribution across inversion times reminiscent of the general kinetic modelling curve with a peak around TI=1100 ms. Perfusion tSNR also generally decreases with increasing total acceleration factor, while the 2*2 protocol outperforms all protocols but the 1*2 one. Figure 5A and 5B show that despite the large tSNR differences between protocols no statistically significant differences between the CBF and arterial arrival times estimated with BASIL could be found. However, what the increasing acceleration had a significant effect on, is the estimated perfusion variance displayed in Figure 5C. Here, the 2*3 and 2*4 protocols performed poorly despite the increased number of inversion times acquired. In summary, the 2*2 protocol offers the best compromise between tSNR and number of inversion times and its use in clinical applications can be recommended. In particular, the characterization of arterial arrival times and arterial blood volume offered in BASIL can give clinically-valuable physiological information beyond CBF. In conclusion, a time-efficient 2D SMS multi-TI ASL approach has been presented, which can be employed for whole-brain perfusion parameter characterization in health and disease at 7T.Acknowledgements
The study was supported by funding from Dutch Research Council with NWO VIDI grants 452-11-002 to KU, 16.Vidi.178.052 to BAP, NWO VENI project 016.Veni.198.032 to LH, and European Research Council H2020 FET-Open AROMA grant agreement no. 88587 (BAP).References
[1] Gardener et al. MRM, 2009. 61:874-82;
[2] Ivanov et al. NIMG. 2017;156:363-376;
[3] Teeuwisse et al. Int J Imaging Syst Technol, 2010. 20:62–70;
[4] Luh et al. MRM, 2013. 69:402-10;
[5] Ivanov et al. Magn Reson Med. 2017; 78: 121-129;
[6] Kim SG MRM, 1995. 34:293-301;
[7] Setsompop et al. MRM, 2012, 67:1210-24;
[8] Hurley et al. MRM, 2010. 63:51-8;
[9] Teeuwisse et al. MRM, 2012. 67:912-8;
[10] Chappell et al. IEEE Transactions on Signal Processing 57:223-236, 2009.
Figures