0044
“Reverse Perfusion” Imaging of the Cerebral Venous System with Displacement Spectrum Imaging (DiSpect)
Ekin Karasan1, Zhiyong Zhang2, and Michael Lustig1
1University of California, Berkeley, Berkeley, CA, United States, 2Biomedical Engineering, Shanghai Jiao Tong University, Shanghai, China
1University of California, Berkeley, Berkeley, CA, United States, 2Biomedical Engineering, Shanghai Jiao Tong University, Shanghai, China
Synopsis
Displacement Spectrum Imaging (DiSpect) is a Fourier encoding variant of Displacement Encoding with Stimulated Echoes (DENSE). DiSpect can resolve a multi-dimensional spectrum of displacements that spins exhibit between tagging and imaging. We previously demonstrated ASL-like retrospective vessel-selective perfusion imaging with DiSpect. Here, we demonstrate the versatility of DiSpect by doing the reverse; tracing how blood drains from the capillary bed through the cerebral venous system. We image two locations in the superior sagittal sinus and trace how the superior superficial veins drain into the superior sagittal sinus, in a sense measuring reverse perfusion.
Introduction
The hemodynamics of the venous system are important for diagnosing and treating diseases and studying biophysical functions1,2. Due to its complex structure and person-to-person variability3, the cerebral venous system has been studied less frequently than the arterial system. Non-contrast enhanced methods for studying perfusion, such as Arterial Spin Labeling (ASL)4, are not suitable for veins because of the lack of a single labeling plane. Therefore, the main tools to probe the venous system are based on measuring flow velocity, such as Time of Flight (TOF) MR Venography (MRV) and phase-contrast (PC) MRI3,5,6. However, these fail to capture the full dynamics of venous flow draining from capillaries into sinuses.We previously presented Displacement Spectrum Imaging (DiSpect), a technique which can resolve the multi-dimensional displacement spectrum that spins exhibit between tagging and imaging7. In DiSpect, each image voxel holds information on where the blood was displaced from. Previously, we’ve shown the ability of DiSpect to perform retrospective vessel selective perfusion-like imaging7. Here, we demonstrate its versatility by doing the reverse; tracing how blood drains from the capillary bed through the superior superficial veins into the superior sagittal sinus (SSS), in a sense, measuring reverse perfusion (Figure 1b). As proof of concept, we perform non-selective tagging, and image slices containing the SSS. By imaging near the surface and close to receiver coils, we obtain higher SNR. We perform two in-vivo experiments, imaging two positions on the SSS.
Methods
Pulse SequenceThe DiSpect pulse sequence is shown in Figure 1a. DiSpect tags spins using a 1-1 SPAMM tagging module8,9. After a mixing time, an image is acquired with a phase proportional to the displacement that has occurred. Previously, we used a single-shot EPI readout. Here, we replace it with a single-shot spiral readout to improve SNR and reduce flow sensitivity in the imaging plane. By varying the displacement encoding gradients in phase-encoding increments we Fourier encode the displacement information. The displacement spectra can be obtained by performing an inverse Fourier transform along the displacement encoding directions. Spatial saturation bands were used to suppress static tissue and blood already present in the SSS. To improve effectiveness, saturation was applied before and after tagging. A sequence of image acquisitions are performed after tagging, acquiring displacement spectra at mixing times from 100ms to 1.4s, in 100ms increments.
Experiment 1: Imaging the back of the head
Two in-vivo experiments were conducted with a 3T GE MR750W system (Waukesha, Wisconsin). First, a 2D coronal slice was imaged at the back of the head (Figure 2a). Displacement encoding was performed in the AP and SI directions, resulting in a 2D sagittal spectrum (projection along LR). The image resolution was 4x4mm2, 150x150mm2 FOV and the displacement resolution was 6x6mm2, 144x90mm2 displacement FOV. For visualization, voxels containing the SSS were masked out from the image (Figure 2b). The displacement spectra of these voxels were denoised by thresholding and combined.
Experiment 2: Imaging the top of the head
Next, a 2D axial slice was imaged on the top of the head (Figure 3a). Displacement encoding was performed in the LR and SI directions, resulting in a 2D coronal spectrum. The image resolution was 4x4mm2, 150x150mm2 FOV and the displacement resolution was 4x4mm2, 120x56mm2 displacement FOV. For visualization, three ROIs at different positions in the AP direction were selected (Figure 3c). The displacement spectra of voxels in each ROI were denoised by thresholding and combined.
For both experiments, a 3D phase-contrast based MRV sequence was performed.
Results and Discussion
The results of the first experiment are shown in Figure 2. Combined displacement spectra are displayed at four mixing times (Figure 2d) and also shown dynamically (Figure 2e).The results of the second experiment are shown in Figures 3-5. For visualization, two sections are selected from the 3D MRV and a coronal projection of each is displayed (Figure 3b). The combined displacement spectra of each ROI is displayed at four mixing times (Figure 3d). We observe that veins in the posterior section drain into ROI #1 whereas the veins in the anterior section drain into the other two ROIs. Figure 4 shows the combined displacement spectra from each ROI and the displacement spectrum energy of the imaging slice dynamically across mixing times.
Figure 5 looks at the displacement spectra from single voxels. Different sets of voxels are selected and their displacement spectra are overlaid on a venogram in the corresponding colors. Once again, we see that different veins drain into different regions of the imaging slice.
With both experiments, we observe that the signal gets dispersed at longer mixing times. We believe this could correspond to draining from the capillaries to the superior veins. We hypothesize that our method could therefore be used as an alternative way to measure perfusion. Since the signal is imaged near the surface rather than the center this method can provide higher SNR. One limitation is that the person-to-person variability of the venous system could make quantification harder.
Conclusions
DiSpect produces a rich dataset that contains information about complex dynamics of flow and perfusion. We show the feasibility of imaging blood draining from the capillary bed to the cerebral venous system with DiSpect.Acknowledgements
No acknowledgement found.References
- Leach, James L., et al. "Imaging of cerebral venous thrombosis: current techniques, spectrum of findings, and diagnostic pitfalls." Radiographics 26.suppl_1 (2006): S19-S41.
- Agid, Ronit, et al. "Imaging of the intracranial venous system." The neurologist 14.1 (2008): 12-22.
- Stoquart-ElSankari, Souraya, et al. "A phase-contrast MRI study of physiologic cerebral venous flow." Journal of Cerebral Blood Flow & Metabolism 29.6 (2009): 1208-1215.
- Alsop, David C., et al. "Recommended implementation of arterial spin‐labeled perfusion MRI for clinical applications: A consensus of the ISMRM perfusion study group and the European consortium for ASL in dementia." Magnetic resonance in medicine 73.1 (2015): 102-116.
- Ruehm, Stefan G. "MR venography." Magnetic Resonance Angiography. Springer, Milano, 2005. 331-340.
- Morgan, Alasdair G., et al. "4D flow MRI for non-invasive measurement of blood flow in the brain: a systematic review." Journal of Cerebral Blood Flow & Metabolism 41.2 (2021): 206-218.
- Zhang, Zhiyong, et al. "DiSpect: Displacement spectrum imaging of flow and tissue perfusion using spin‐labeling and stimulated echoes." Magnetic Resonance in Medicine (2021).
- Aletras, Anthony H., et al. "DENSE: displacement encoding with stimulated echoes in cardiac functional MRI." Journal of magnetic resonance (San Diego, Calif.: 1997) 137.1 (1999): 247.
- Epstein, Frederick H., and Wesley D. Gilson. "Displacement‐encoded cardiac MRI using cosine and sine modulation to eliminate (CANSEL) artifact‐generating echoes." Magnetic Resonance in Medicine: An Official Journal of the International Society for Magnetic Resonance in Medicine 52.4 (2004): 774-781.
Figures
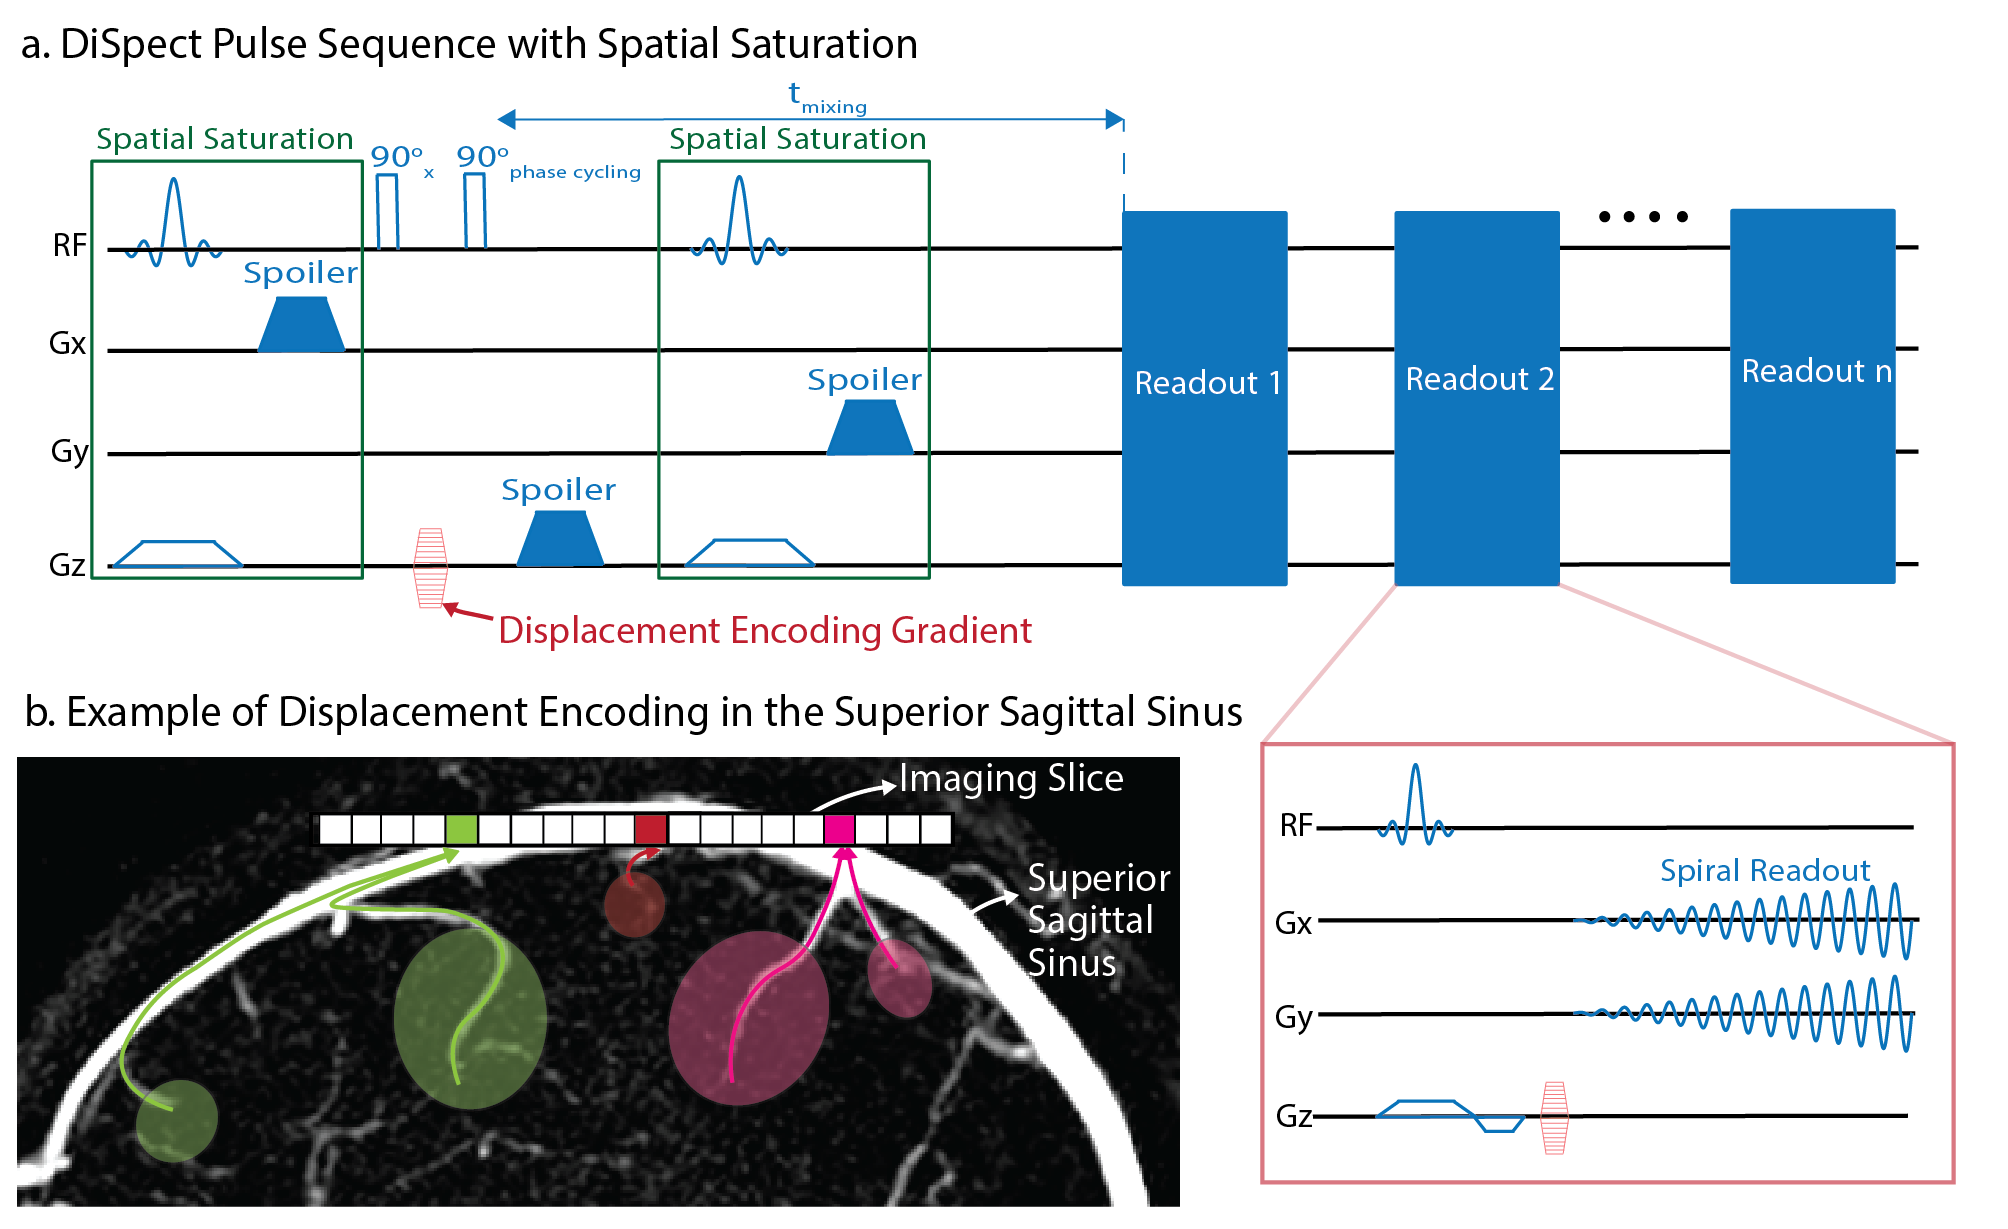
a) The DiSpect pulse sequence: Spatial saturation pulses are placed before and after tagging to suppress unwanted signals. Spoiler gradients are applied on a different axis for each saturation pulse and after tagging in order to avoid any unwanted stimulated echoes from forming. Images are acquired repeatedly after tagging with a single shot spiral readout. b) An example imaging slice placed on the superior sagittal sinus. Three image voxels are selected and an example of blood displacing to each is shown. We hypothesize that the blood displaces from veins as well as surrounding tissue.
a) Experimental setup showing the imaging slice and saturation band. b) An ROI containing the superior sagittal sinus is selected from the imaging slice. c) Sagittal projection of 3D MRV is shown for reference. d) The displacement spectra of voxels in the selected ROI are denoised by thresholding and combined. The combined displacement spectra are shown at four mixing times. e) A dynamic video of the combined displacement spectra across mixing times is overlaid on the sagittal venogram.
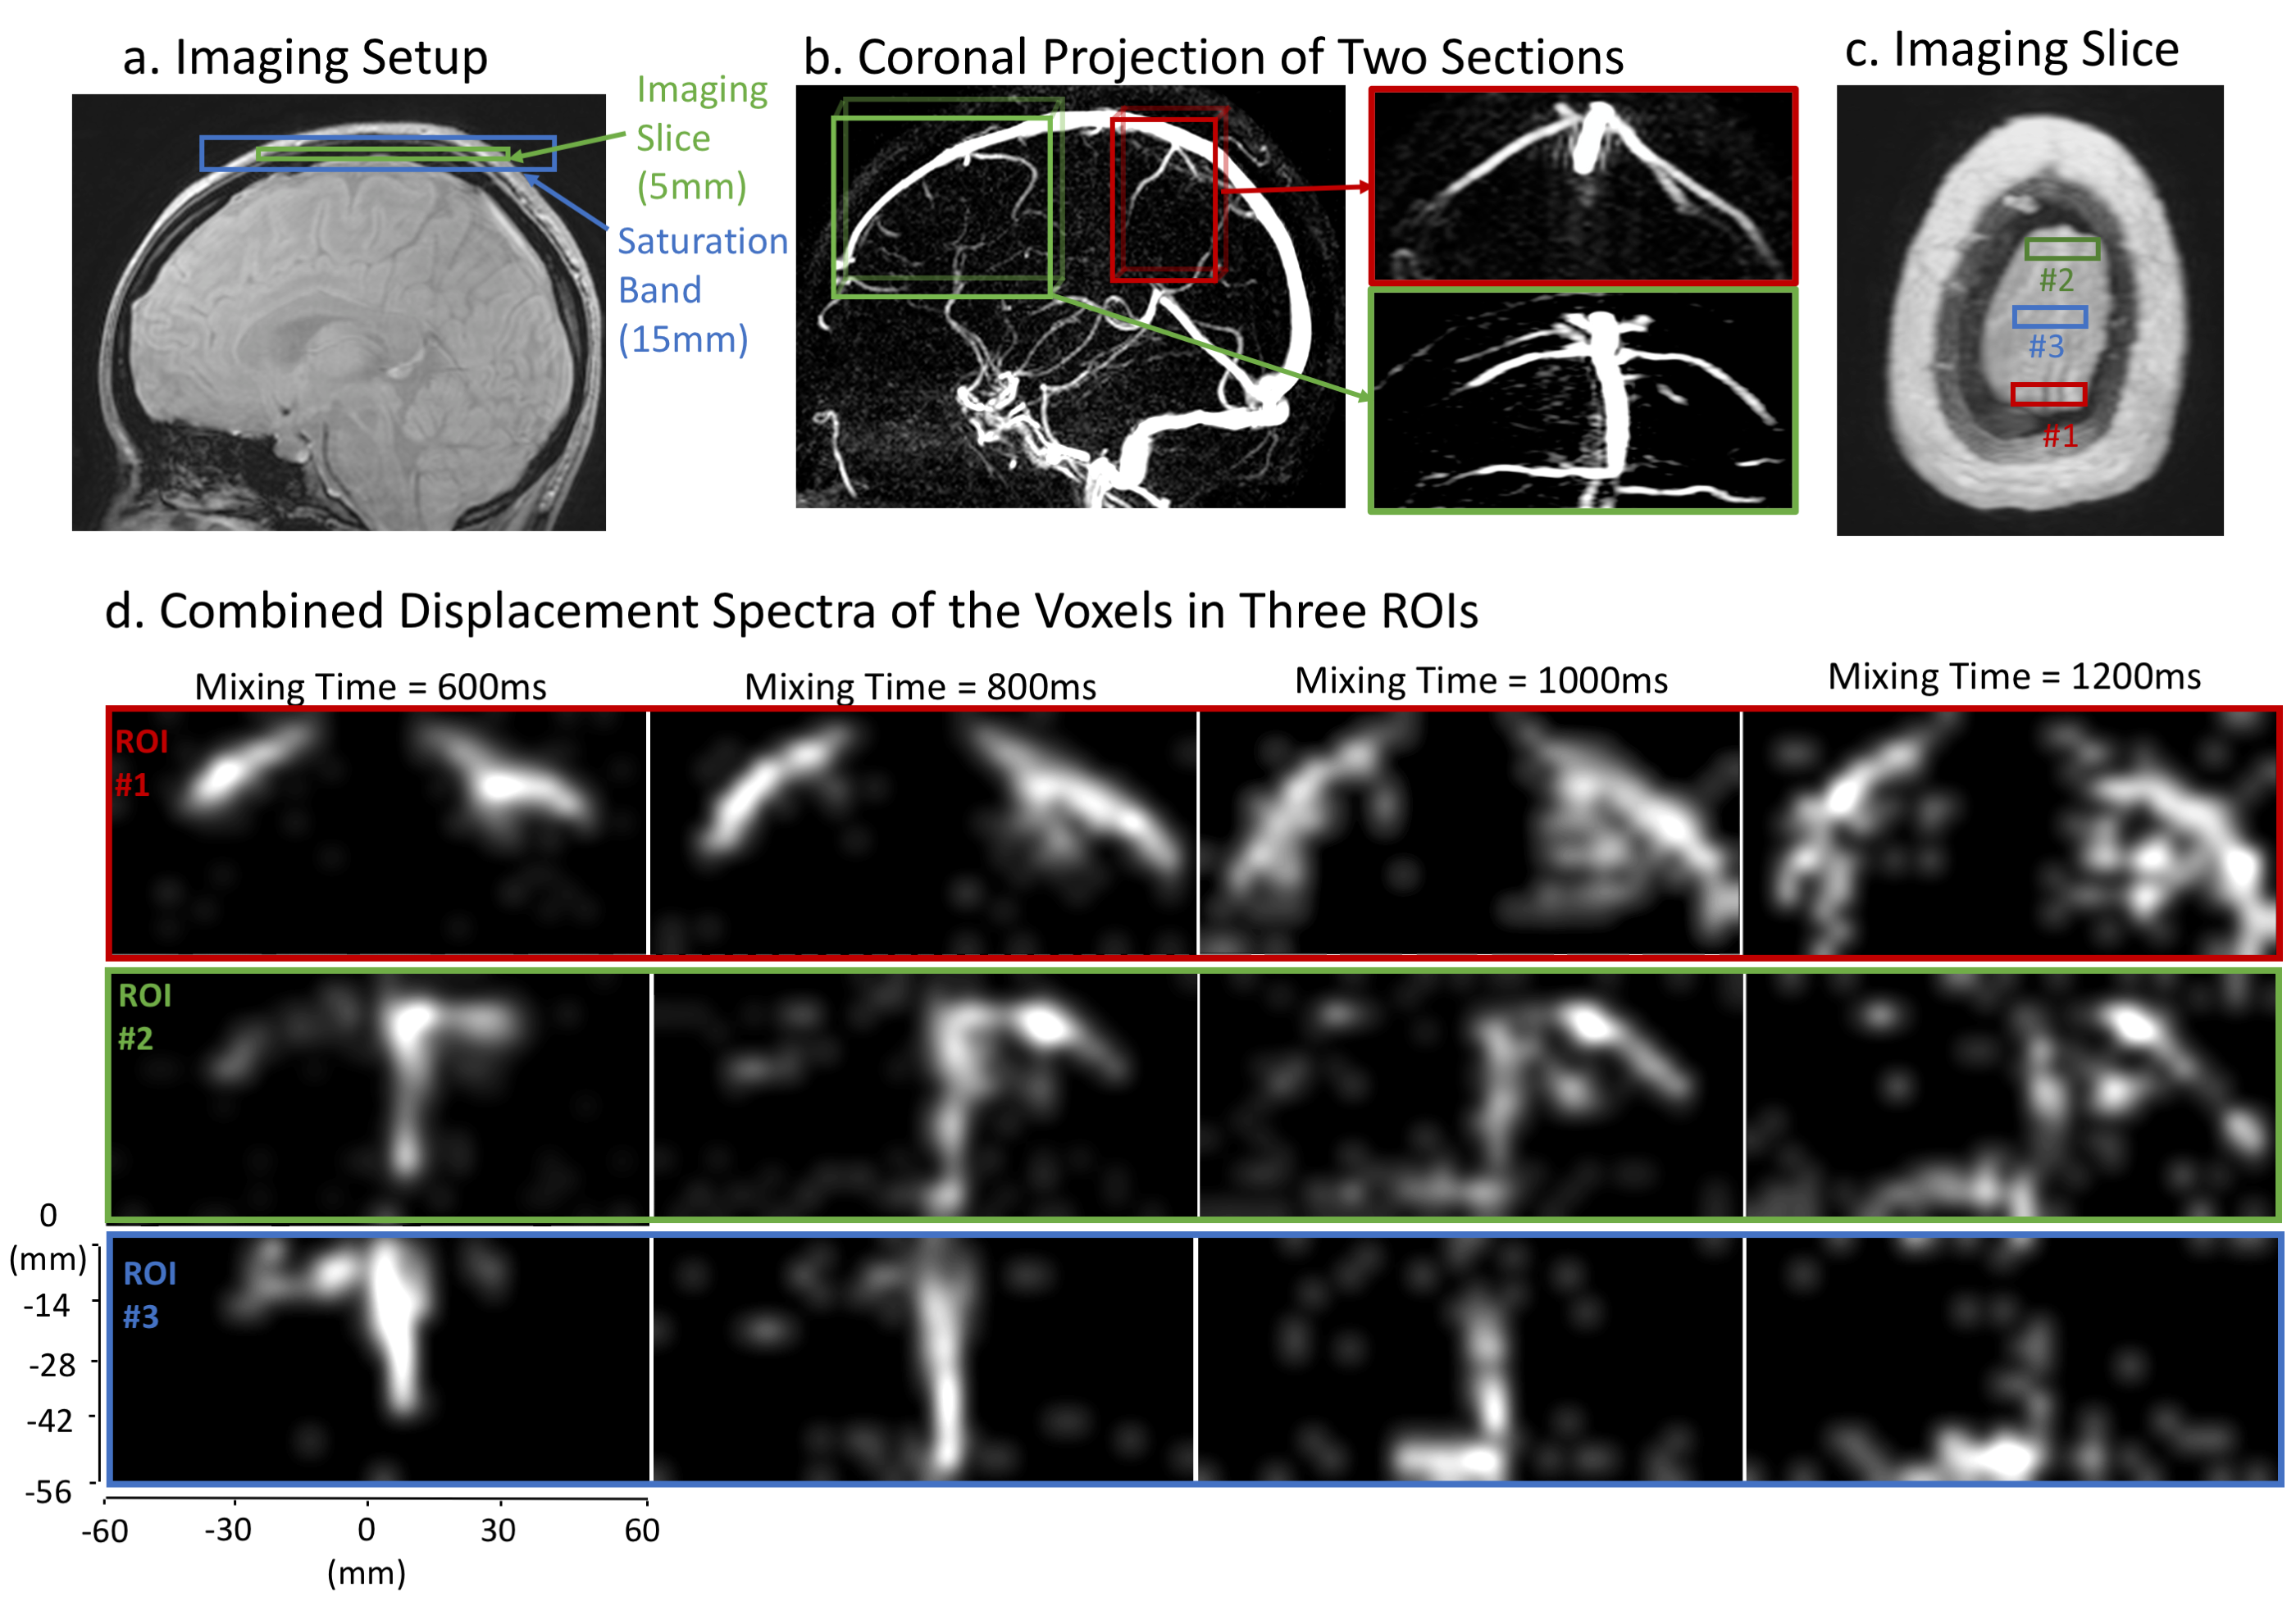
a) Experimental setup showing the imaging slice and saturation band. b) For visualization, two sections are selected from the 3D MRV map, one on the anterior (green) and the other on the posterior (red) side of the imaging slice. The coronal projection of each section is shown separately. c) Three, 4x1 voxel ROIs are selected from the imaging slice. d) The corresponding combined displacement spectra of the voxels in the selected ROIs are shown at four mixing times. While veins in the posterior section drain into ROI #1, the veins in the anterior section drain into the other two ROIs.
a) An axial venogram of the imaging slice is shown as reference. b) Three ROIs are selected from the imaging slice (same as in Figure 3c) c) The displacement spectrum energy of the imaging slice is shown dynamically across mixing times. d) The combined displacement spectra of the three image ROIs are overlaid on the corresponding coronal venogram and displayed dynamically.
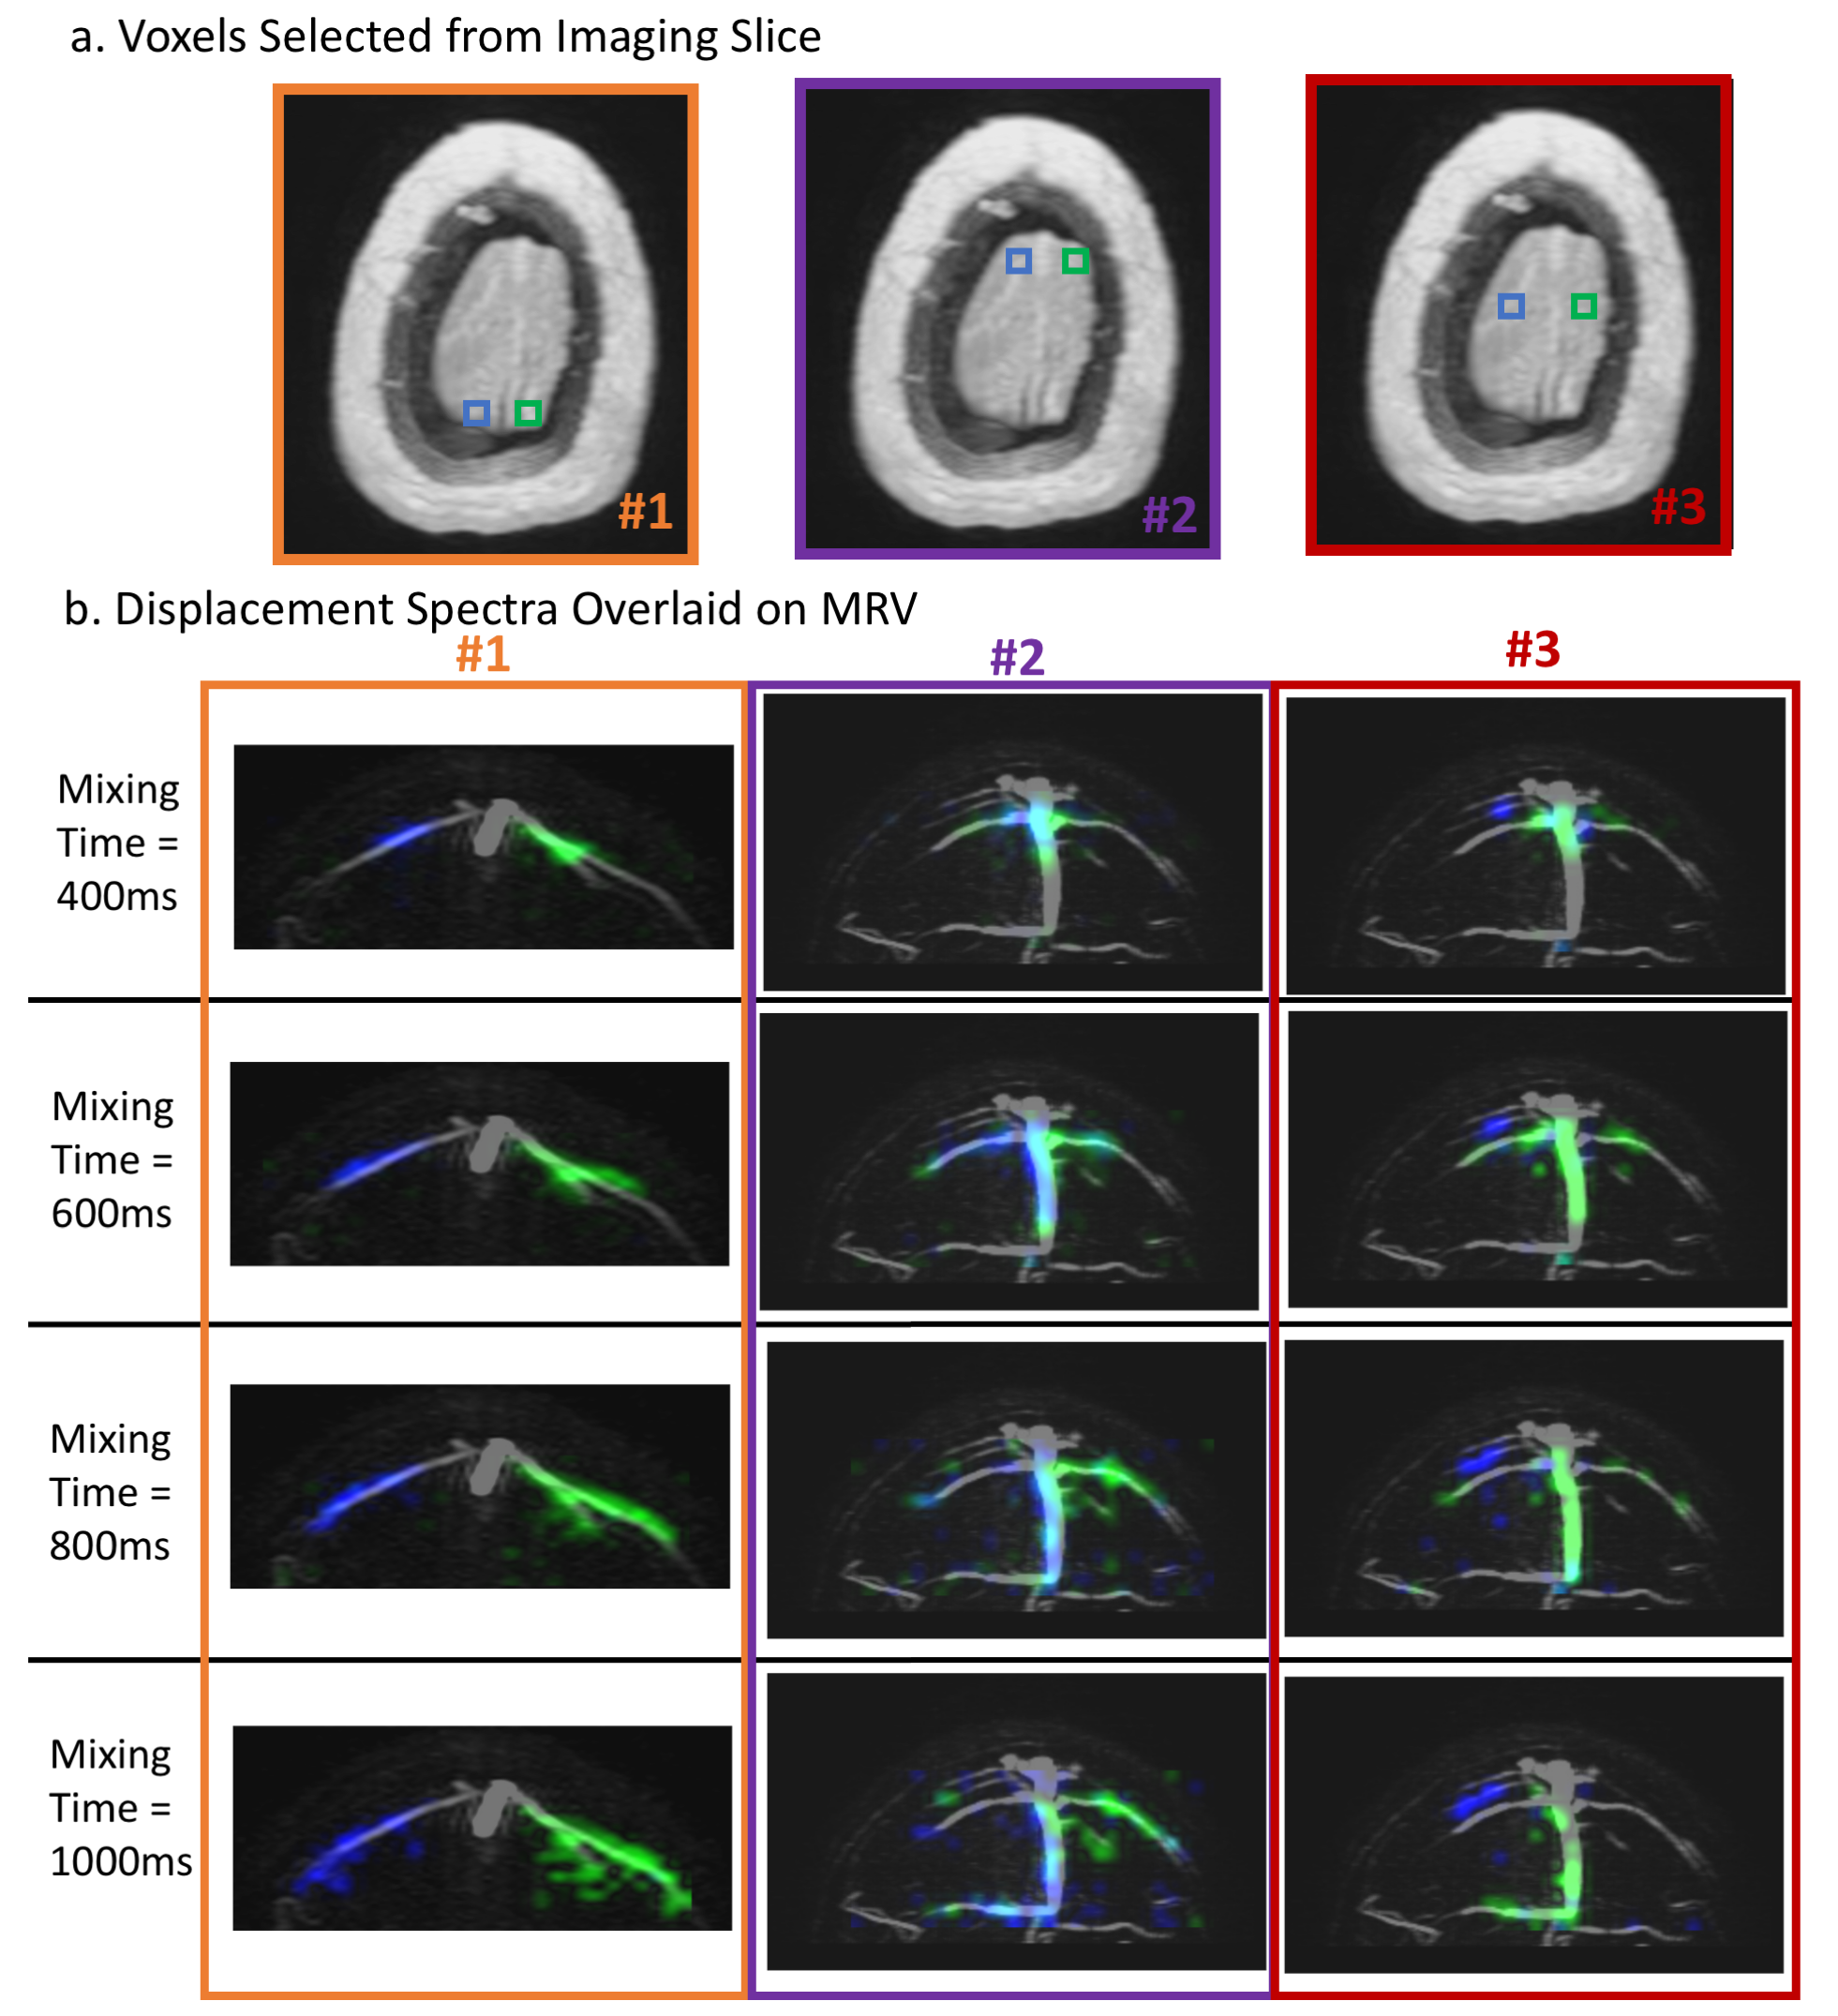
a) Three sets of voxels are selected from the imaging slice. Each set of two voxels have the same coordinate in the AP direction but are at different positions in the LR direction. b) For each set, the displacement spectra of the two voxels are displayed in the corresponding color and overlaid on the corresponding coronal venogram. The results are shown for four mixing times. It can be observed that different veins drain into different locations in the imaging slice.
DOI: https://doi.org/10.58530/2022/0044