0041
Radiomic Features Measured with Multiparametric Magnetic Resonance Imaging Predict Prostate Cancer Metastatic Risk1Department of Radiation Oncology, University of Miami Miller School of Medicine, Miami, FL, United States, 2Department of Urology, University of Miami Miller School of Medicine, Miami, FL, United States
Synopsis
Circulating tumor cells (CTCs) have been shown to be an indicator for metastatic risk in prostate cancer. We investigated the association between radiomics features extracted from multiparametric MRI of the prostate and CTC counts in prostate cancer patients enrolled in two institutional clinical trials (n=71). We trained a neural network to predict the dichotomized CTCs counts, defined by a 5 CTCs threshold. The top seven features, ranked using maximum-relevance minimum-redundancy, were used as input to a neural network. The training and testing were repeated for 100 runs of 5-Fold cross validation, resulting in AUC 0.834 to predict CTCs ≥ 5.
Introduction
The number of Circulating Tumor Cells (CTCs) have been shown to be indicative of metastatic risk and are a significant biomarker of response in prostate cancer.1-4 We sought to assess the association between radiomics features based on multiparametric MRI (mpMRI) with CTC counts in prostate cancer patients, and to build machine learning models on radiomics features to predict the presence or absence of CTCs.Materials and methods
Blood was collected prospectively from patients, enrolled in a single arm active surveillance trial (AS-trial) tand a phase II randomized radiotherapy clinical trial investigating MRI-guided prostate radiotherapy boost (RT-trial). The patients in both trials, upon signing an informed consent, have undergone mpMRI, followed by MRI-ultrasound (MRI-US) fusion biopsy. CTCs were successfully harvested and enumerated using a microfilter system. The CTCs were enriched onto specially engineered microscope slides and visualized by immunofluorescence staining. Epithelial and prostate specific markers were used for identification and quantification. mpMRI data was acquired on 3T Discovery MR750 magnet (GE, Waukesha, WI), 3T MR Magnetom Trio, Skyra and 1.5T Symphony (Siemens, Erlagen, Germany). The sequences and sequences parameters were consistent with the recommendation for PIRADS v2.5 The exams consisted of Axial T2-weighted MRI, Diffusion Weighted Imaging (DWI) and Dynamic Contrast Enhanced (DCE)-MRI. mpMRI were analyzed with Habitat Risk Score algorithm.6 HRS is a quantitative imaging system, which derives pixel-by-pixel based score on a 1-10 scale. Tumor Regions of Interest (ROIs) were assigned as the volumes of HRS=6 coinciding with the individual needle tracks from the MRI-US fused biopsy session. Volumes with HRS6 are concordant with the tumor volumes from radical prostatectomy samples.6 In cases where the needle tracks were not recorded, the recorded location of the biopsy was used as a guidance for selecting the biopsy ROIs. For normalization of the T2-weigthed intensities, a multireference normalization approach is utilized.7 Using MASK-RCNN network, three reference contours were selected in the gluteus maximus (GM), femoral head and bladder.8 The average intensity values from these reference contours were assigned a fixed reference value. For each patient, a spline function between average and reference values is fitted. GM was the only reference contour that was consistently identified on high b-value images (BVAL) for all patients and the BVAL were normalized by GM intensity only. Nine histogram parameters were extracted from 6 intensities and texture features from T2, ADC and BVAL, resulting in 162 variables.9 In addition 4 pharmacokinetic parameters from DCE-MRI (Tonset – time of onset of the contrast washin; Ktrans – volume transfer constant between blood plasma and Extracellular Extravascular Space (EES); kep – rate constant between EES and blood plasma; ve – volume fraction of EES) plus the HRS6 volume resulted in a total of 167 variables. Maximum relevance – minimum redundancy (MRMR)10 was used to rank to select the features with maximum relevance regarding the dichotomized CTCs (F-Test) and minimum redundancy regarding the features selected at previous iterations (Pearson correlation). The CTCs were dichotomized as absent or present (5 counts or greater).11 Cross-validated neural network machine learning models based on radiomics features were trained and evaluated for the prediction of CTCs.Results
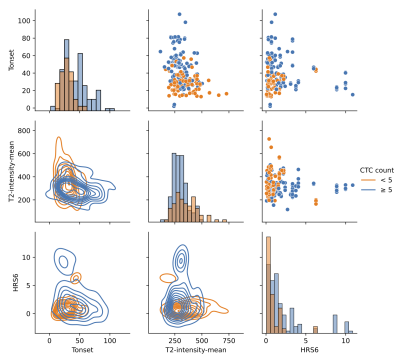
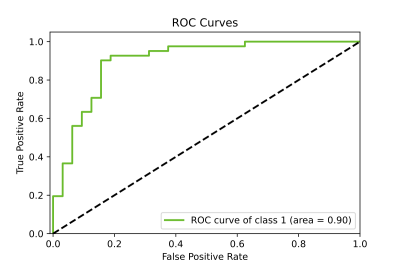
CTCs were enumerated in blood samples from 71 patients: AS-Trial (n=40) and RT-Trial (n=31). The median age of the patients was 65 years (range: 44-82); 29 patients were Grade Group 1 (GG1), 20 patients GG2, 6 patients GG3, 9 patients GG4, and 7 patients GG5. 49 patients were T-category T1, with thirteen T2, and seven T3. In the AS-Trial patients, the mean and median CTC count in 7.5 mL blood were 19 (±42 SD) and 2 (range 0-206), with 23 (58%) patients having insignificant CTCs (<5 CTCs).10 Accordingly, in the RT-Trial patients the figures were 74 (± 85 SD), 42 (range 0-429), and one (3%) patient had insignificant CTCs. The CTCs counts between the patients from the two trials were statistically significant (p=.0008). The top seven radiomics features as ranked by MRMR were used as input to the neural network model, as including more features had negligible or negative impact on the performance. These features are: Tonset, BVAL intensity SD, ADC intensity Skewness, ADC contrast 90%, T2 intensity mean, HRS6 volume, and ADC contrast 10%. In Figure 1 the association between three of the imaging features selected by MRMR and dichotomized by CTC counts is presented. The training and testing were repeated for 100 runs of 5-Fold cross validation, and the model was found to be highly predictive of CTC counts of 5 or greater. The average area under the receiver operating characteristic curve (AUC) was 0.834 ± 0.109 (Figure 2).Discussion
To the best of our knowledge, this is the first study to model CTC counts with in vivo mpMRI radiomics. As shown in Figure 1, higher tumor volume (HRS6), lower T2-intensity measurements and early Tonset, all of which are known to be associated with adverse effects are also associated with ≥5 CTCs counts. These findings confirm in part the validity of the model.Conclusions
Magnetic resonance imaging radiomics features are promising markers of prostate cancer metastatic risk.Acknowledgements
NIH NATIONAL CANCER INSTITUTE – 1U01CA189295References
1. Eschwège P, Moutereau S, Droupy S, et al. Prognostic value of prostate circulating
cells detection in prostate cancer patients: a prospective study. Br J Cancer. 2009;100(4):608-610. doi:10.1038/sj.bjc.6604912
2. Kerr BA, Miocinovic R, Smith AK, et al. CD117+ cells in the circulation are predictive of advanced prostate cancer. Oncotarget. 2015;6(3):1889-1897. doi:10.18632/oncotarget.2796
3. Goldkorn A, Ely B, Quinn DI, et al. Circulating tumor cell counts are prognostic of overall survival in SWOG S0421: a phase III trial of docetaxel with or without atrasentan for metastatic castration-resistant prostate cancer. J Clin Oncol. 2014;32(11):1136-1142. doi:10.1200/JCO.2013.51.7417
4. Murray NP, Reyes E, Orellana N, Fuentealba C, Dueñas R. Elimination of primary circulating prostate cells after radical prostatectomy for prostate cancer decreases the risk of future biochemical failure. Arch Esp Urol. 2014;67(8):684-691.
5. Barentsz JO, Weinreb JC, Verma S, et al. Synopsis of the PI-RADS v2 Guidelines for Multiparametric Prostate Magnetic Resonance Imaging and Recommendations for Use. Eur Urol. 2016;69(1):41-49. doi:10.1016/j.eururo.2015.08.038
6. Stoyanova R, Chinea F, Kwon D, et al. An Automated Multiparametric MRI Quantitative Imaging Prostate Habitat Risk Scoring System for Defining External Beam Radiation Therapy Boost Volumes. Int J Radiat Oncol Biol Phys. 2018;102(4):821-829. doi:10.1016/j.ijrobp.2018.06.003
7. Stoilescu L, Huisman H, Maas M. "Feasibility of multireference tissue normalization of T2-weighted prostate MRI", In: European Society for Magnetic Resonance in Medicine and Biology, 2017.
8. Breto AL, Zavala-Romero O, Xu IR, et al. Deep Learning Approach for Multi-Reference Tissue Normalization on T2-weighted MRI in Longitudinal Dataset from Prospective Radiotherapy Trial for Prostate Cancer. International Journal of Radiation Oncology*Biology*Physics. 2020;108(3):S130. doi:10.1016/j.ijrobp.2020.07.858
9. Kwon D, Reis IM, Breto AL, et al. Classification of suspicious lesions on prostate multiparametric MRI using machine learning. J Med Imaging (Bellingham). 2018;5(3):034502. doi:10.1117/1.JMI.5.3.034502
10. de Bono JS, Scher HI, Montgomery RB, et al. Circulating tumor cells predict survival benefit from treatment in metastatic castration-resistant prostate cancer [published correction appears in Clin Cancer Res. 2009 Feb 15;15(4):1506]. Clin Cancer Res. 2008;14(19):6302-6309. doi:10.1158/1078-0432.CCR-08-0872
11. Z. Zhao, R. Anand and M. Wang, "Maximum Relevance and Minimum Redundancy Feature Selection Methods for a Marketing Machine Learning Platform," 2019 IEEE International Conference on Data Science and Advanced Analytics (DSAA), 2019, pp. 442-452, doi: 10.1109/DSAA.2019.00059.Figures

Figure 1: Association of imaging features selected by MRMR and dichotomized by CTC counts. Diagonal: Histograms of feature distribution between the two CTCs groups; Below diagonal: Bi-variate kernel density estimation between imaging features; Upper diagonal; Scatter plots between imaging features.

Figure 2: Sample ROC of radiomics-based neural network model predicting the insignificant (<5) or significant (≥5) CTCs counts.