0039
Radio-pathomic associations between MRI and complex histomorphometric features of prostate cancer1Biophysics, Medical College of Wisconsin, Milwaukee, WI, United States, 2Biophysics, Medical College of Wisconsin, Wauwatosa, WI, United States, 3Radiology, Medical College of Wisconsin, Wauwatosa, WI, United States, 4Pathology, Medical College of Wisconsin, Wauwatosa, WI, United States, 5Biomedical Engineering, Medical College of Wisconsin, Wauwatosa, WI, United States
Synopsis
This study used digitized histology and MP-MRI from 48 patients with prostate cancer (PCa) to determine the relationship between complex histomorphometric features of PCa histology and MRI features. After prostatectomy, tissue samples were digitized, and co-registered to the T2 image. Slides were annotated by a pathologist, individual glands were identified using automated image processing algorithms, and histomorphometric features were calculated. Radiomic features were calculated to compare higher order texture and histological features. We found that lumen was more strongly associated with raw intensity, whereas epithelial features were more strongly associated with computed texture features.
Introduction
Prostate cancer (PCa) is the most diagnosed non-cutaneous cancer in men, affecting one in eight men during their lifetime1. PCa is graded using the Gleason grading scale, which assigns a score corresponding to the grade of the two most predominant glandular patterns and assigns patients into five Grade Groups (GG) to predict prognosis2. Multiparametric magnetic resonance imaging (MP-MRI) has shown promise in differentiating clinically significant cancers (GG ≥2, tumor volume ≥ 0.5 mL, or stage ≥ T3)3 from indolent disease4–6. Radiomics is a multi-step process where quantitative imaging features or textures from medical images are extracted using data-characterization algorithms to decode tissue characteristics7,8. Radiomic features contain first-, second-, and higher-order statistics that are combined with other patient data to develop models that may detect and characterize a clinically relevant outcome9–12. Radio-pathomics takes this further and aligns tissue to medical imaging to correlate radiology and pathology. Measuring tissue heterogeneity across large regions composed of many voxels has been made possible through this tissue alignment13–15.This study compares complex histomorphometric features of prostate cancer to MRI intensity and radiomic features using tissue acquired after prostatectomy aligned to the patient’s clinical imaging. Specifically, we tested the hypothesis that histomorphometric features of prostate cancer would show clinically relevant imaging signatures.
Methods
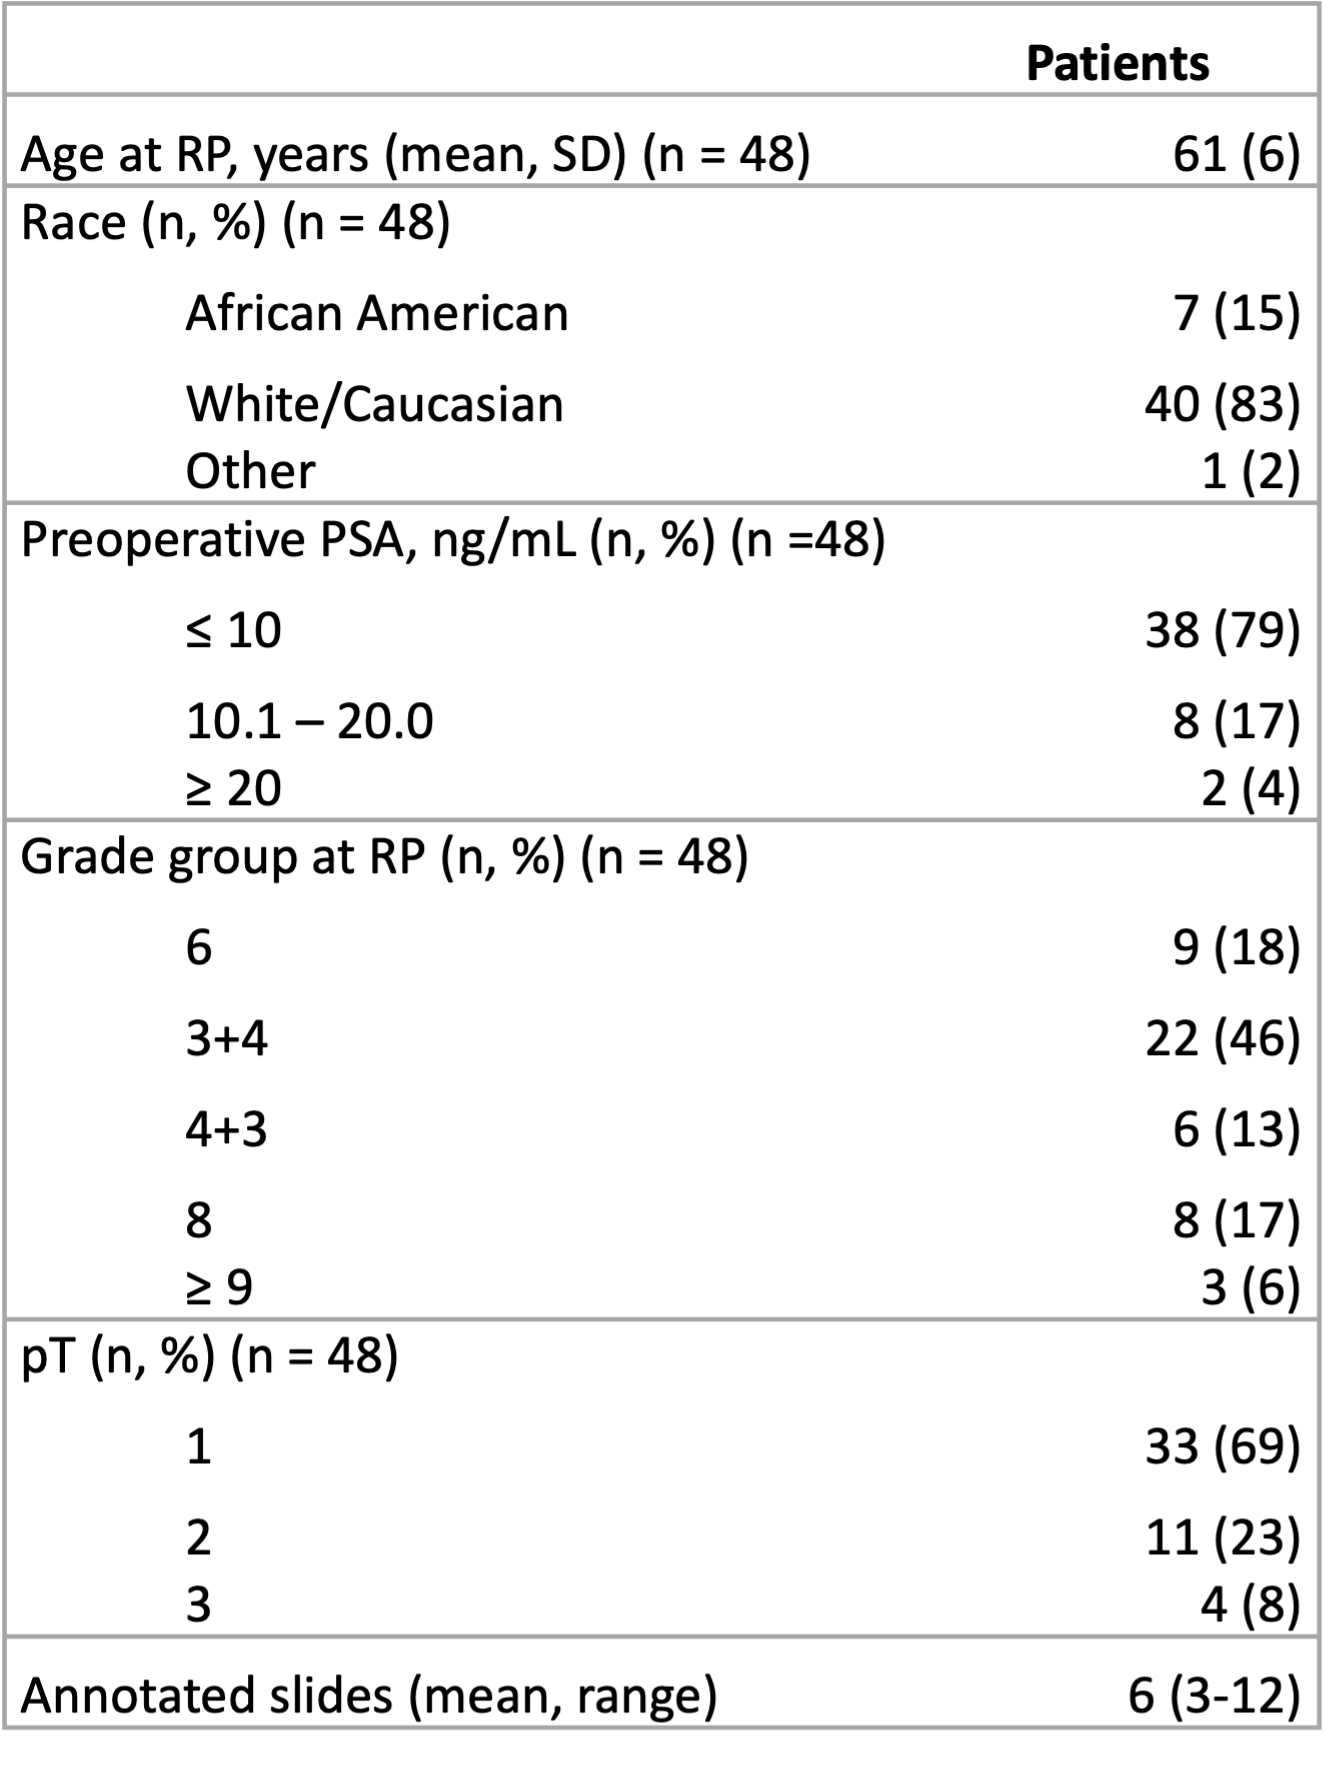
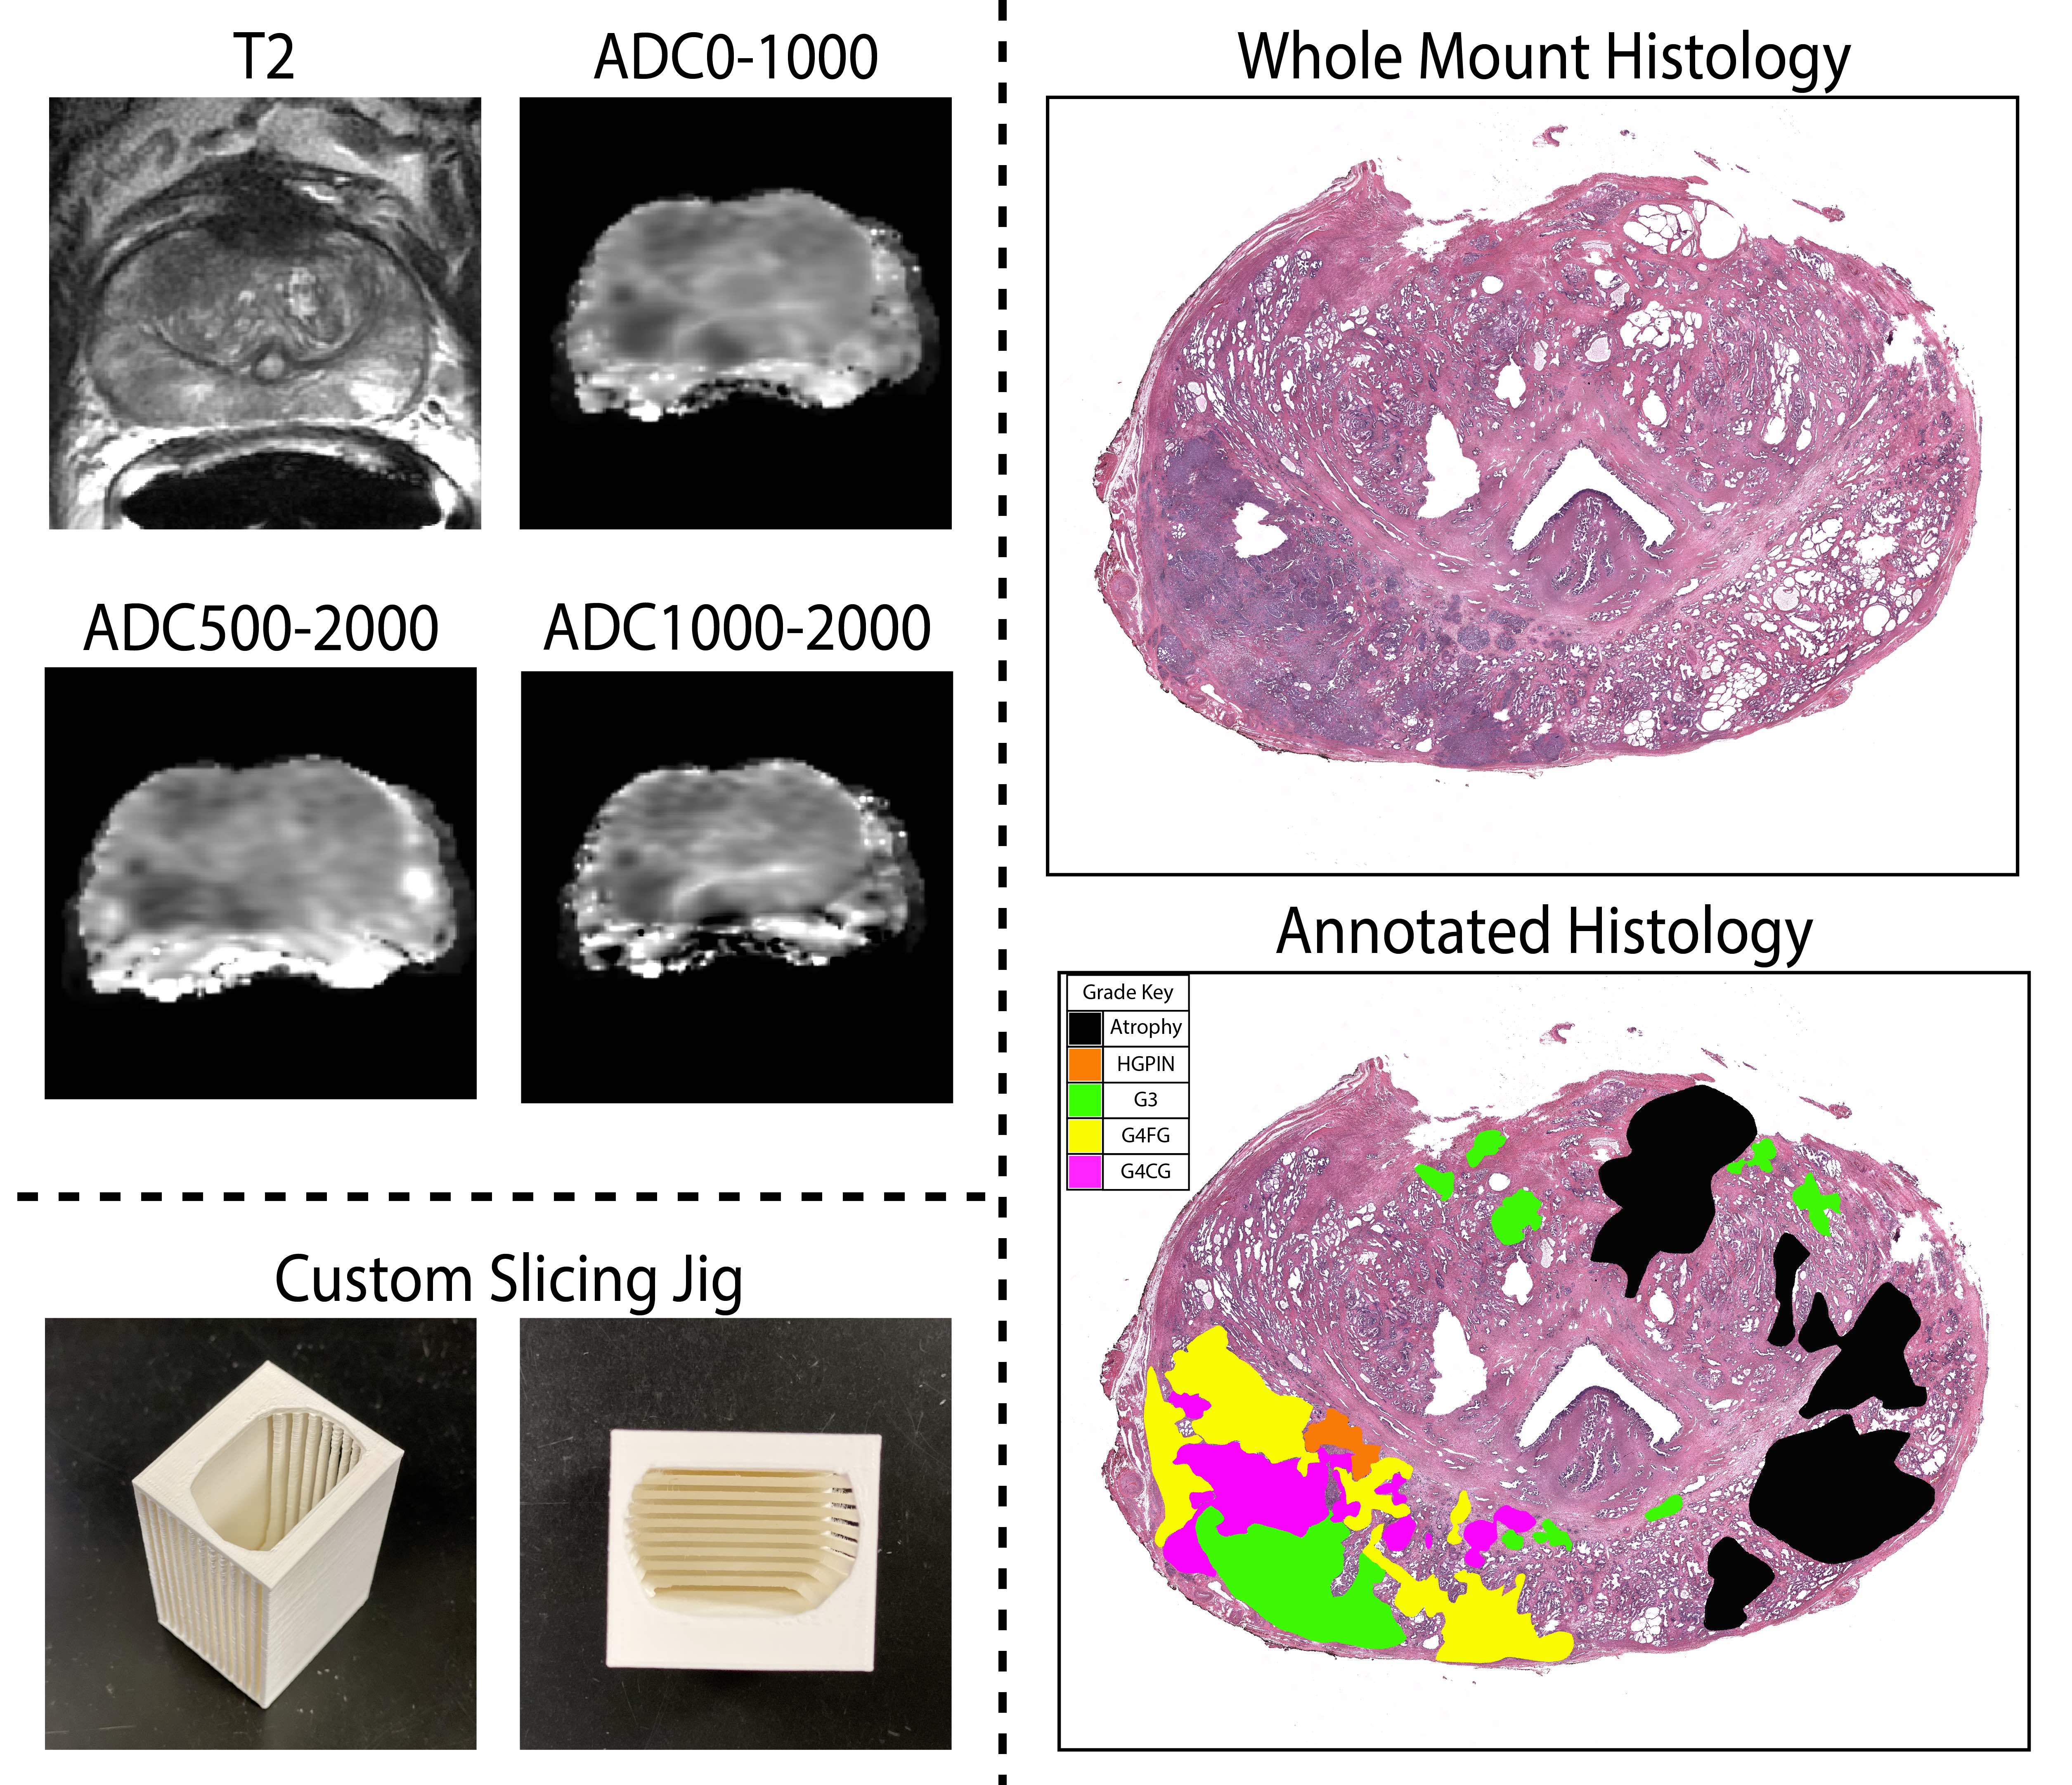
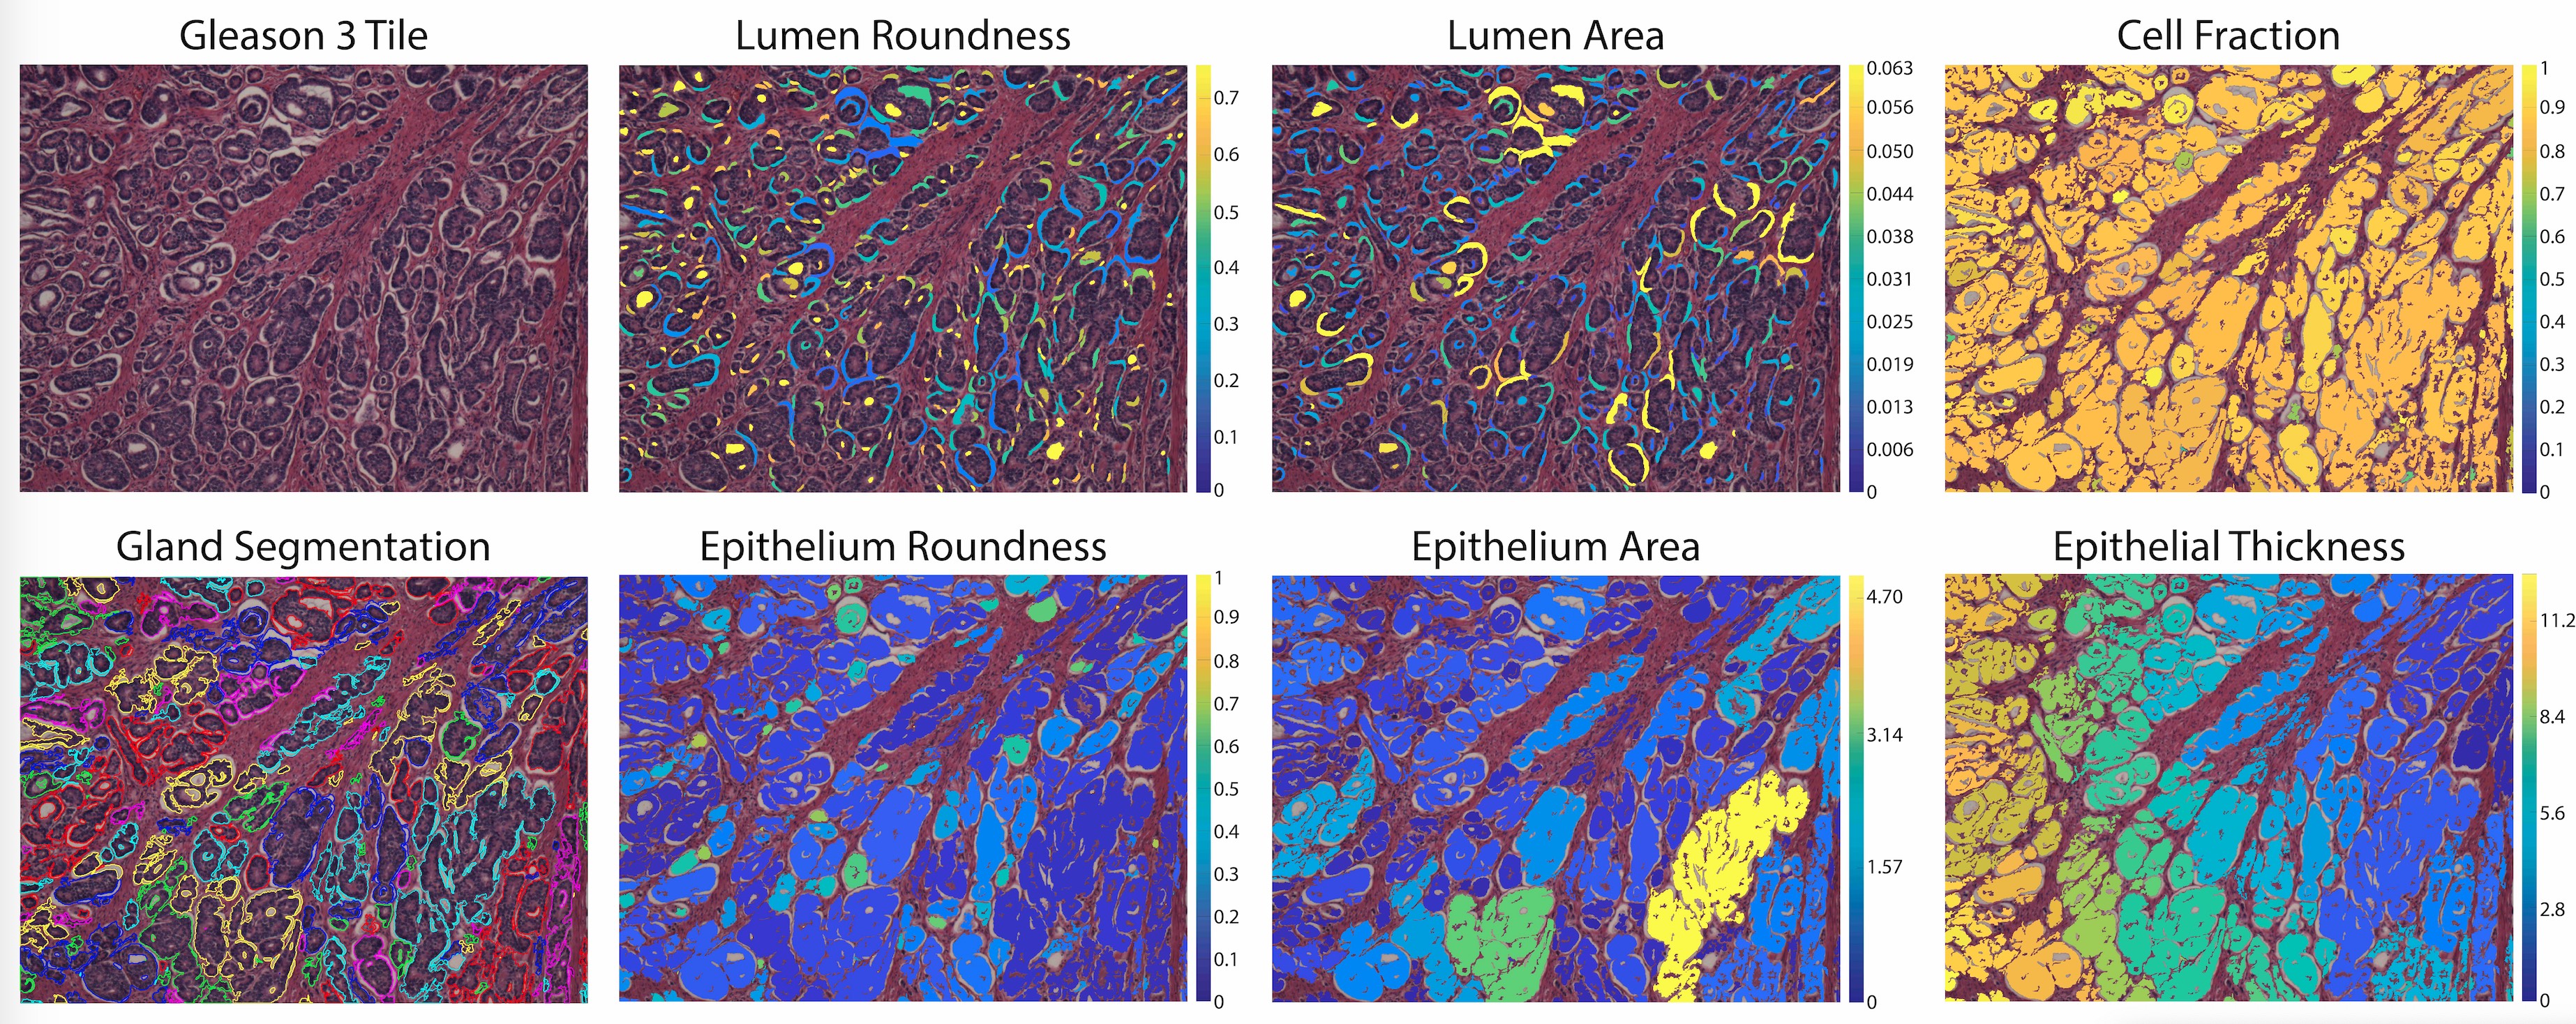
This study recruited 48 patients with pathologically confirmed prostate cancer, whose demographic and clinical information can be found in Table 1. Figure 1 summarizes data collection and tissue processing steps. MP-MRI was acquired using a 3T MRI scanner using an endorectal coil and included T2, and apparent diffusion coefficient (ADC) with four b-values (0, 500, 1000, and 2000 s/mm2). After surgery, tissue was sliced using a custom patient-specific, 3D-printed slicing jig modeled after the patient’s T2-weighted image. Tissue slices were processed, stained for hematoxylin and eosin (H&E), and digitized at 40x resolution (0.2 microns/pixel) using a sliding stage microscope. A board-certified genitourinary pathologist (KAI) annotated lesions by Gleason patterns on a total of 285 digitized slides. The slides were then automatically segmented to calculate nine pathomic features of prostate cancer: lumen area, proportion, and roundness; epithelial area, proportion, wall thickness, and roundness; cell fraction (percent of nuclei per gland area), and stromal proportion (Figure 2). Whole-mount slides and their calculated pathomic features were then nonlinearly aligned to each patient’s T2 and normalized T2 image using custom in-house control-point based MATLAB software4,16,17. T2 was normalized by dividing the T2 image by the standard deviation of image intensity across the prostate.Pearson correlations were used to identify relationships between complex histo-morphometric features and MRI intensity. First, single-voxel intensity correlations were measured across the whole prostate. Because of the large number of observations, lesion-wise correlations were measured by segmenting the annotated lesions from pathology to reduce noise. Correlation coefficients between median MR intensity and histological features across the lesion were calculated. Finally, 93 radiomic texture features across the lesions were calculated and compared to the pathomic features for each MRI.
Results
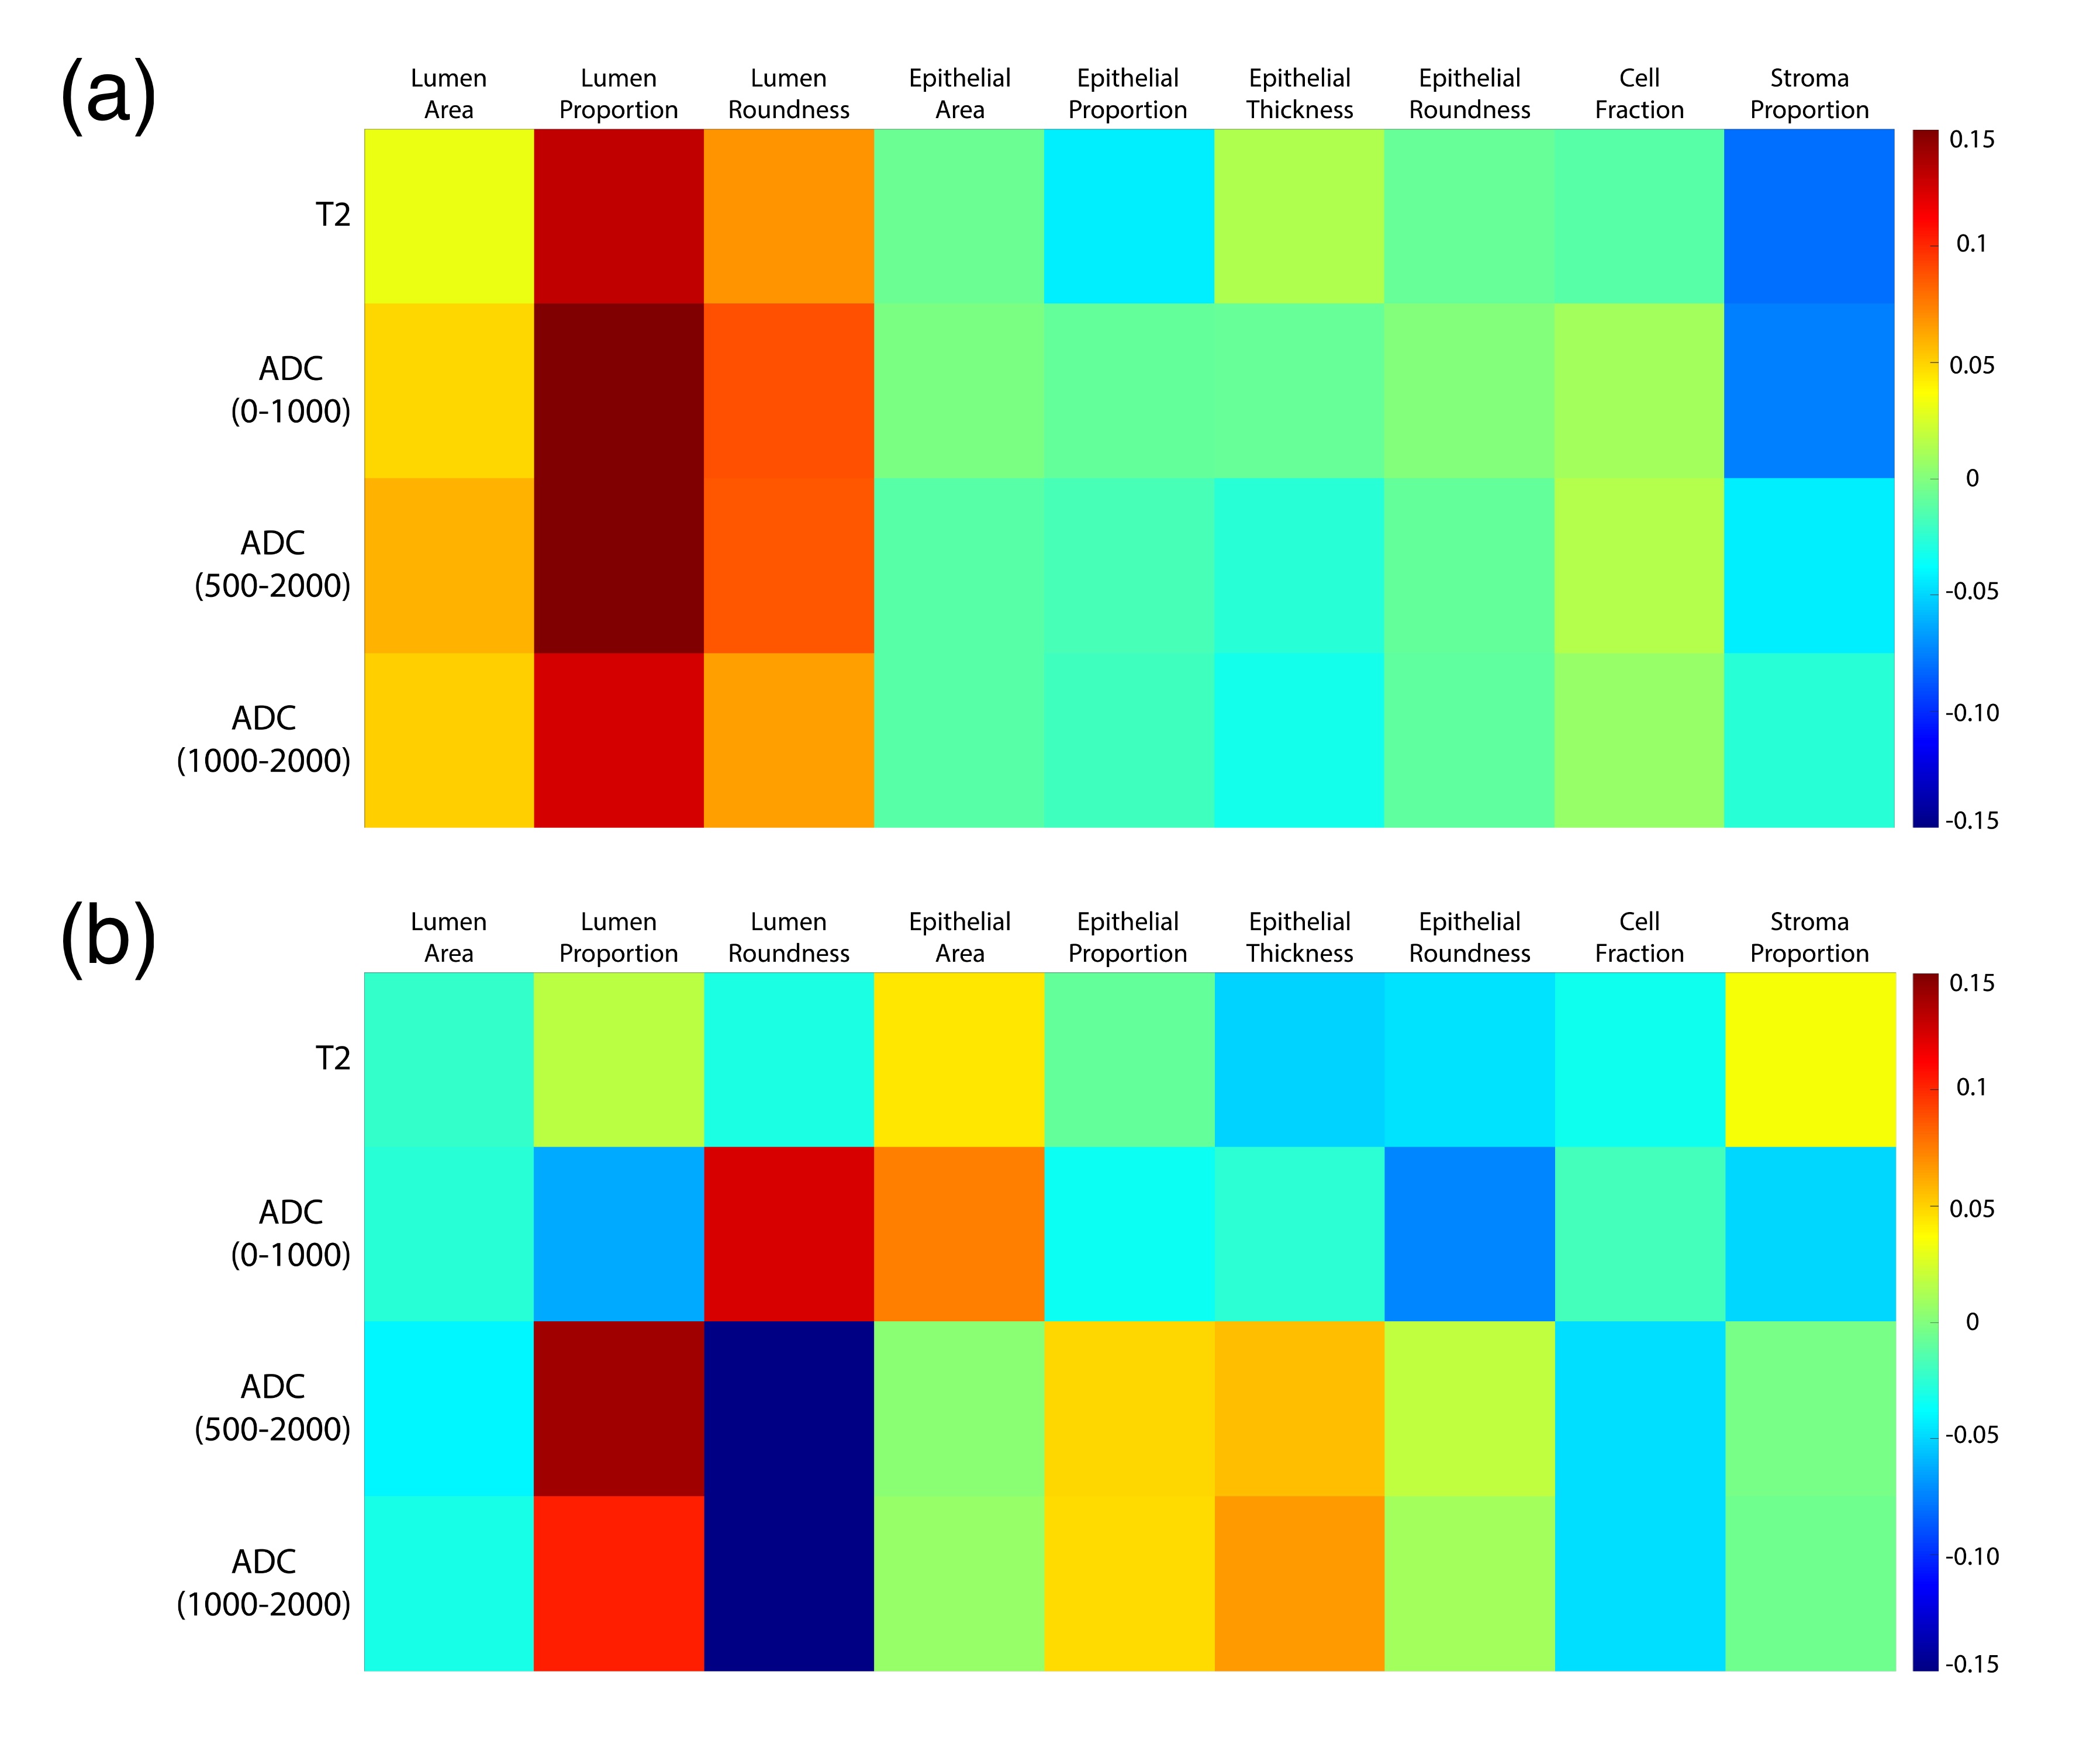
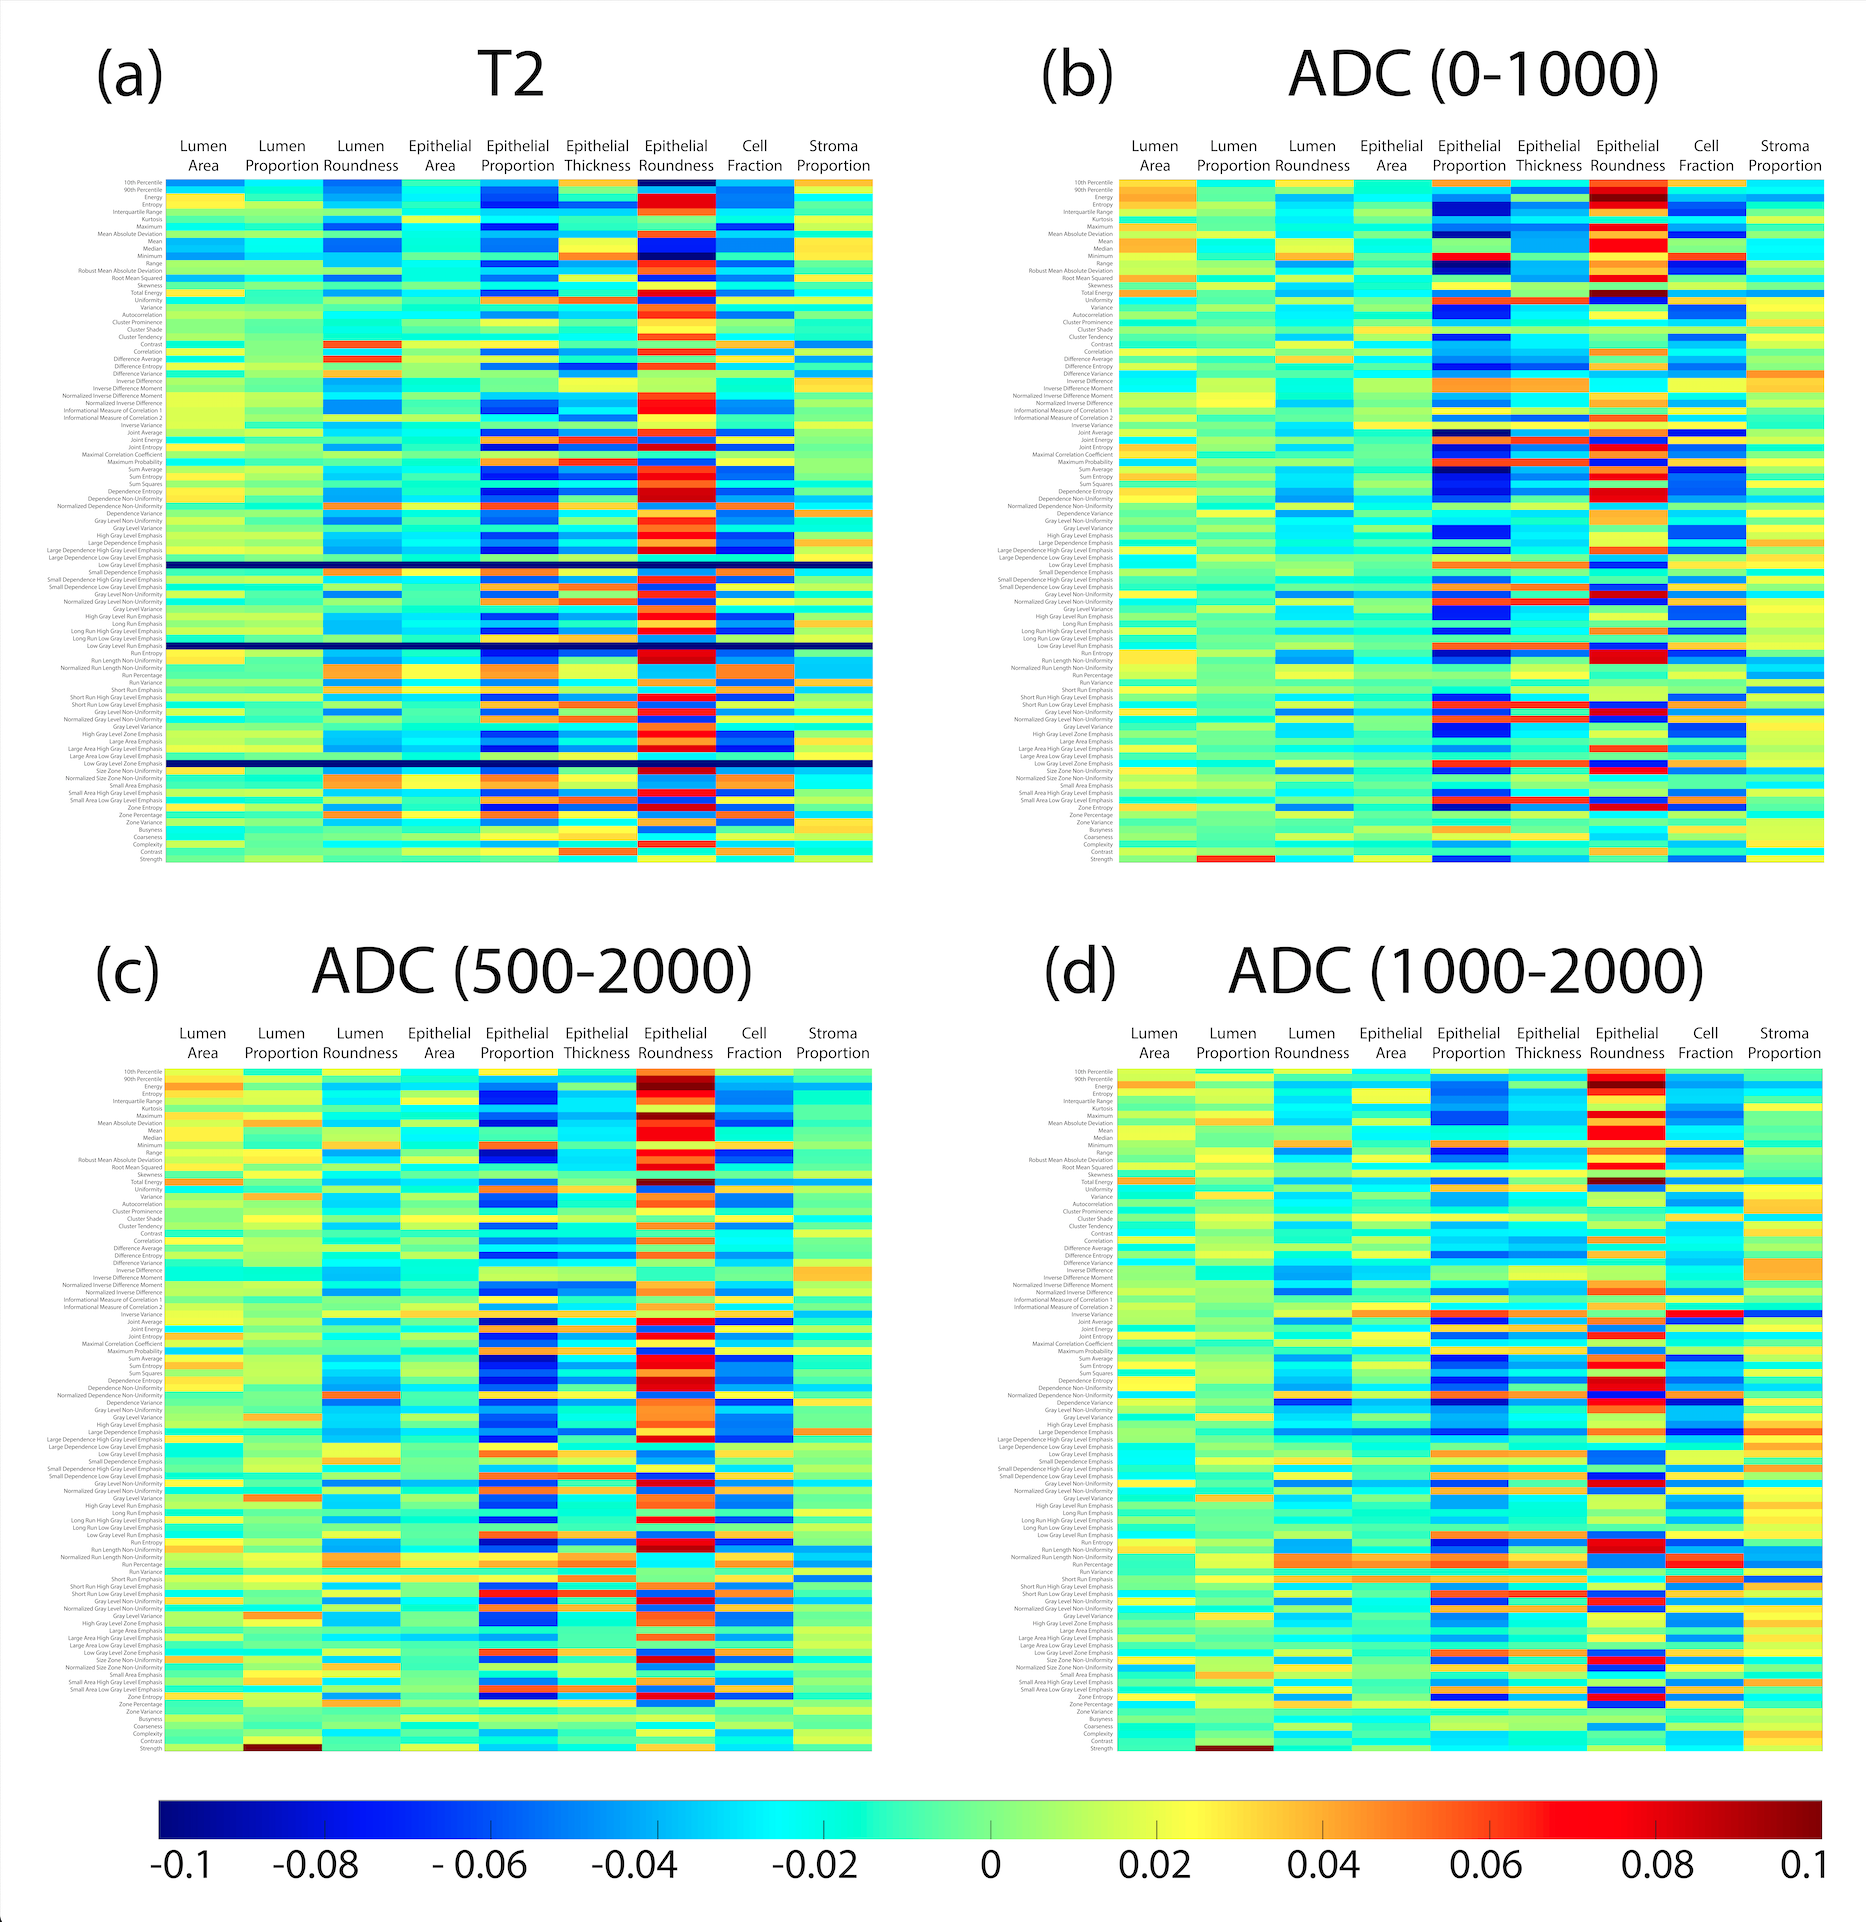
Voxel-wise correlations are presented in Figure 3a. Overall, small positive correlations were found between lumen features and single-voxel intensities of the MRI (lumen proportion R > 0.1; lumen area and roundness R > 0.05). Slightly negative correlations were found between stroma proportion and single-voxel intensity (R < -0.05), but little-to-no correlation was found for epithelial features. Figure 3b shows the lesion-wise correlations from the median MR intensity and histological features across lesions. At the lesion-level, ADC had various associations with lumen features and epithelial area, with T2 showing no meaningful associations. Radiomic feature correlations are shown in Figure 4. Generally, across each MRI, epithelial features had the highest correlations between texture features compared to luminal and stromal features.Discussion
At the single-voxel or lesion-wise level, lumen features had positive correlations with T2 and ADC, while epithelial features had no or negative correlation. Conversely, when correlating radiomic texture features, epithelial features showed greater correlation (positive or negative) than luminal features. These results suggest that more complicated texture features calculated with radiomics might reveal more nuanced relationships between MRI and epithelium. Future studies using machine learning or deep learning algorithms may be able to use these radiomic features to predict pathomic features in MR space that may be useful for noninvasive treatment guidance.Conclusion
This study demonstrated that in prostate cancer, lumen was more associated with raw intensity, whereas epithelial features were associated more with computed texture features.Acknowledgements
We would like to thank our patients for their participation in this study, the Medical College of Wisconsin Machine Learning Working Group for helpful feedback and discussions, and our funding sources: American Brain Tumor Association Grant DG160004, Froedtert Foundation, Strain for the Brain 5K Run, Milwaukee, WI, NIH/NCI R01CA218144, R01CA218144-02S1, R21CA231892, and R01CA249882.References
1. Siegel RL, Miller KD, Fuchs HE, Jemal A. Cancer Statistics, 2021. CA: A Cancer Journal for Clinicians. 2021;71(1).
2. Epstein JI, Zelefsky MJ, Sjoberg DD, Nelson JB, Egevad L, Magi-Galluzzi C, Vickers AJ, Parwani A v., Reuter VE, Fine SW, Eastham JA, Wiklund P, Han M, Reddy CA, Ciezki JP, Nyberg T, Klein EA. A Contemporary Prostate Cancer Grading System: A Validated Alternative to the Gleason Score. European Urology. 2016;69(3).
3. Swanson GP, Chen W, Trevathan S, Hermans M. Long-Term Follow-Up after Prostatectomy for Prostate Cancer and the Need for Active Monitoring. Prostate Cancer. 2020;2020.
4. Hurrell SL, McGarry SD, Kaczmarowski A, Iczkowski KA, Jacobsohn K, Hohenwalter MD, Hall WA, See WA, Banerjee A, Charles DK, Nevalainen MT, Mackinnon AC. Optimized b-value selection for the discrimination of prostate cancer grades, including the cribriform pattern, using diffusion weighted imaging. Journal of Medical Imaging. 2017;5(01).
5. Hambrock T, Somford DM, Huisman HJ, van Oort IM, Witjes JA, Hulsbergen-van de Kaa CA, Scheenen T, Barentsz JO. Relationship between Apparent Diffusion Coefficients at 3.0-T MR Imaging and Gleason Grade in Peripheral Zone Prostate Cancer. Radiology. 2011;
6. Vos EK, Kobus T, Litjens GJS, Hambrock T, Hulsbergen-Van De Kaa CA, Barentsz JO, Maas MC, Scheenen TWJ. Multiparametric Magnetic Resonance Imaging for Discriminating Low-Grade from High-Grade Prostate Cancer. Investigative Radiology. 2015;50(8).
7. Gillies RJ, Kinahan PE, Hricak H. Radiomics: Images Are More than Pictures, They Are Data. Radiology. 2016 Feb;278(2).
8. Rizzo S, Botta F, Raimondi S, Origgi D, Fanciullo C, Morganti AG, Bellomi M. Radiomics: the facts and the challenges of image analysis. European Radiology Experimental. 2018 Dec 14;2(1).
9. McGarry SD, Hurrell SL, Kaczmarowski AL, Cochran EJ, Connelly J, Rand SD, Schmainda KM, LaViolette PS. Magnetic Resonance Imaging-Based Radiomic Profiles Predict Patient Prognosis in Newly Diagnosed Glioblastoma Before Therapy. Tomography. 2016 Sep 1;2(3).
10. Artan Y, Haider MA, Langer DL, van der Kwast TH, Evans AJ, Yongyi Yang, Wernick MN, Trachtenberg J, Yetik IS. Prostate Cancer Localization With Multispectral MRI Using Cost-Sensitive Support Vector Machines and Conditional Random Fields. IEEE Transactions on Image Processing. 2010 Sep;19(9).
11. Fehr D, Veeraraghavan H, Wibmer A, Gondo T, Matsumoto K, Vargas HA, Sala E, Hricak H, Deasy JO. Automatic classification of prostate cancer Gleason scores from multiparametric magnetic resonance images. Proceedings of the National Academy of Sciences. 2015 Nov 17;112(46).
12. Rampun A, Zheng L, Malcolm P, Tiddeman B, Zwiggelaar R. Computer-aided detection of prostate cancer in T2-weighted MRI within the peripheral zone. Physics in Medicine and Biology. 2016 Jul 7;61(13).
13. Shah V, Pohida T, Turkbey B, Mani H, Merino M, Pinto PA, Choyke P, Bernardo M. A method for correlating in vivoprostate magnetic resonance imaging and histopathology using individualized magnetic resonance -based molds. Review of Scientific Instruments. 2009 Oct;80(10).
14. Nguyen HS, Milbach N, Hurrell SL, Cochran E, Connelly J, Bovi JA, Schultz CJ, Mueller WM, Rand SD, Schmainda KM, LaViolette PS. Progressing Bevacizumab-Induced Diffusion Restriction Is Associated with Coagulative Necrosis Surrounded by Viable Tumor and Decreased Overall Survival in Patients with Recurrent Glioblastoma. American Journal of Neuroradiology. 2016 Dec;37(12).
15. Langer DL, van der Kwast TH, Evans AJ, Plotkin A, Trachtenberg J, Wilson BC, Haider MA. Prostate Tissue Composition and MR Measurements: Investigating the Relationships between ADC, T2, K trans , v e , and Corresponding Histologic Features. Radiology. 2010 May;255(2).
16. McGarry SD, Bukowy JD, Iczkowski KA, Unteriner JG, Duvnjak P, Lowman AK, Jacobsohn K, Hohenwalter M, Griffin MO, Barrington AW, Foss HE, Keuter T, Hurrell SL, See WA, Nevalainen MT, Banerjee A, LaViolette PS. Gleason Probability Maps: A Radiomics Tool for Mapping Prostate Cancer Likelihood in MRI Space. Tomography. 2019 Mar 1;5(1).
17. Bobholz SA, Lowman AK, Barrington A, Brehler M, McGarry S, Cochran EJ, Connelly J, Mueller WM, Agarwal M, O’Neill D, Nencka AS, Banerjee A, LaViolette PS. Radiomic Features of Multiparametric MRI Present Stable Associations with Analogous Histological Features in Patients with Brain Cancer. Tomography. 2020 Jun 1;6(2).
Figures