0038
Delta radiomics analysis of Magnetic Resonance guided radiotherapy imaging data for treatment response prediction in pancreatic cancer1Cancer Physiology, H Lee Moffitt Cancer Center, Tampa, FL, United States, 2Medical Physics, H Lee Moffitt Cancer Center, Tampa, FL, United States, 3Radiation Oncology, H Lee Moffitt Cancer Center, Tampa, FL, United States, 4Machine Learning, H Lee Moffitt Cancer Center, Tampa, FL, United States
Synopsis
Magnetic Resonance Image guided Stereotactic body radiotherapy (MRgRT) is increasingly used in treatment of multiple cancers including pancreatic adenocarcinoma (PDAC). We hypothesized that quantitative analysis (radiomics) of the longitudinal MRgRT imaging during treatment can help predict response. MRgRT TrueFISP images from n=26 non-resectable PDAC patients were analyzed and image feature ratios last/first fraction quantified. Image normalization to kidney signal was validated and robustness of features assessed. Histogram skewness change demonstrated significant association with Progression Free Survival. This result shows promise for future application of the novel integrated framework for processing and quantification of MRgRT data presented here first time.
Introduction
Magnetic Resonance Image-guided Radiation Therapy (MRgRT) is an emerging technology increasingly used in the treatment of multiple cancers, including Pancreatic Adenocarcinoma (PDAC)(1). MRgRT enables collection of time-resolved MR imaging data at each radiation fraction, allowing for daily monitoring of acute changes during a treatment course. Given the variable response rates and short progression times of PDAC, there is an unmet clinical need for a robust quantitative method to assess early response for better prescription personalization and to aid surgical decisions. The emerging field of machine learning in image analytics, or “radiomics” (2), has shown great promise for disease prognosis or prediction of treatment response, including RT (3), and can provide powerful tools to enable analysis of dense MRgRT data. In this study, we present a robust radiomic framework for quantification of image changes during radiotherapy in PDAC, demonstrating the feasibility of the approach for prediction of disease progression in a cohort of 26 borderline/locally advanced PDAC patients.Methods
Twenty six patients were treated with 5 fractions of stereotactic body radiation therapy (SBRT) on the MRidian (ViewRay Inc., Cleveland, OH) to a median dose of 50Gy to Gross Tumor Volume (GTV) and did not undergo resection. Progression Free Survival (PFS) was quantified as time from MRgRT to latest follow-up or a progression event. Local progression was defined via RECIST 1.1 as ≥20% in largest tumor diameter in CT scans first obtained approximately 1 month after RT and then every 3 months. Distant progression was determined by US guided biopsy confirming metastatic disease. Each patient received 6 MRI scans with the same protocol - simulation (SIM), ~14-21 days before treatment start, and then immediately prior to each radiation fraction (F1-F5) delivery. Images were acquired on the MRIdian 0.35T MRI-Linac system using a balanced steady state free precession (4) pulse sequence: TR/TE=3.33/1.43ms, flip angle=60deg, 310x360 points, 144 slices, 1.5x1.5x3mm voxels. GTV was segmented by the radiation oncologist in the SIM scan, and the scans F1-F5 were co-registered online to the SIM scan. Image features (73 histogram and texture variables) were quantified in F1 and F5, and their ratios (F5/F1) evaluated for association with PFS using univariate Cox proportional hazards model with Bonferroni-Holm multiplicity correction. Spatial stability of features was tested by quantification of Lin’s Concordance Correlation Coefficient (CCC) (5) for feature values in the SIM scan between ROIs created by radial contraction or expansion of the GTV by 1.5mm in each slice.Results
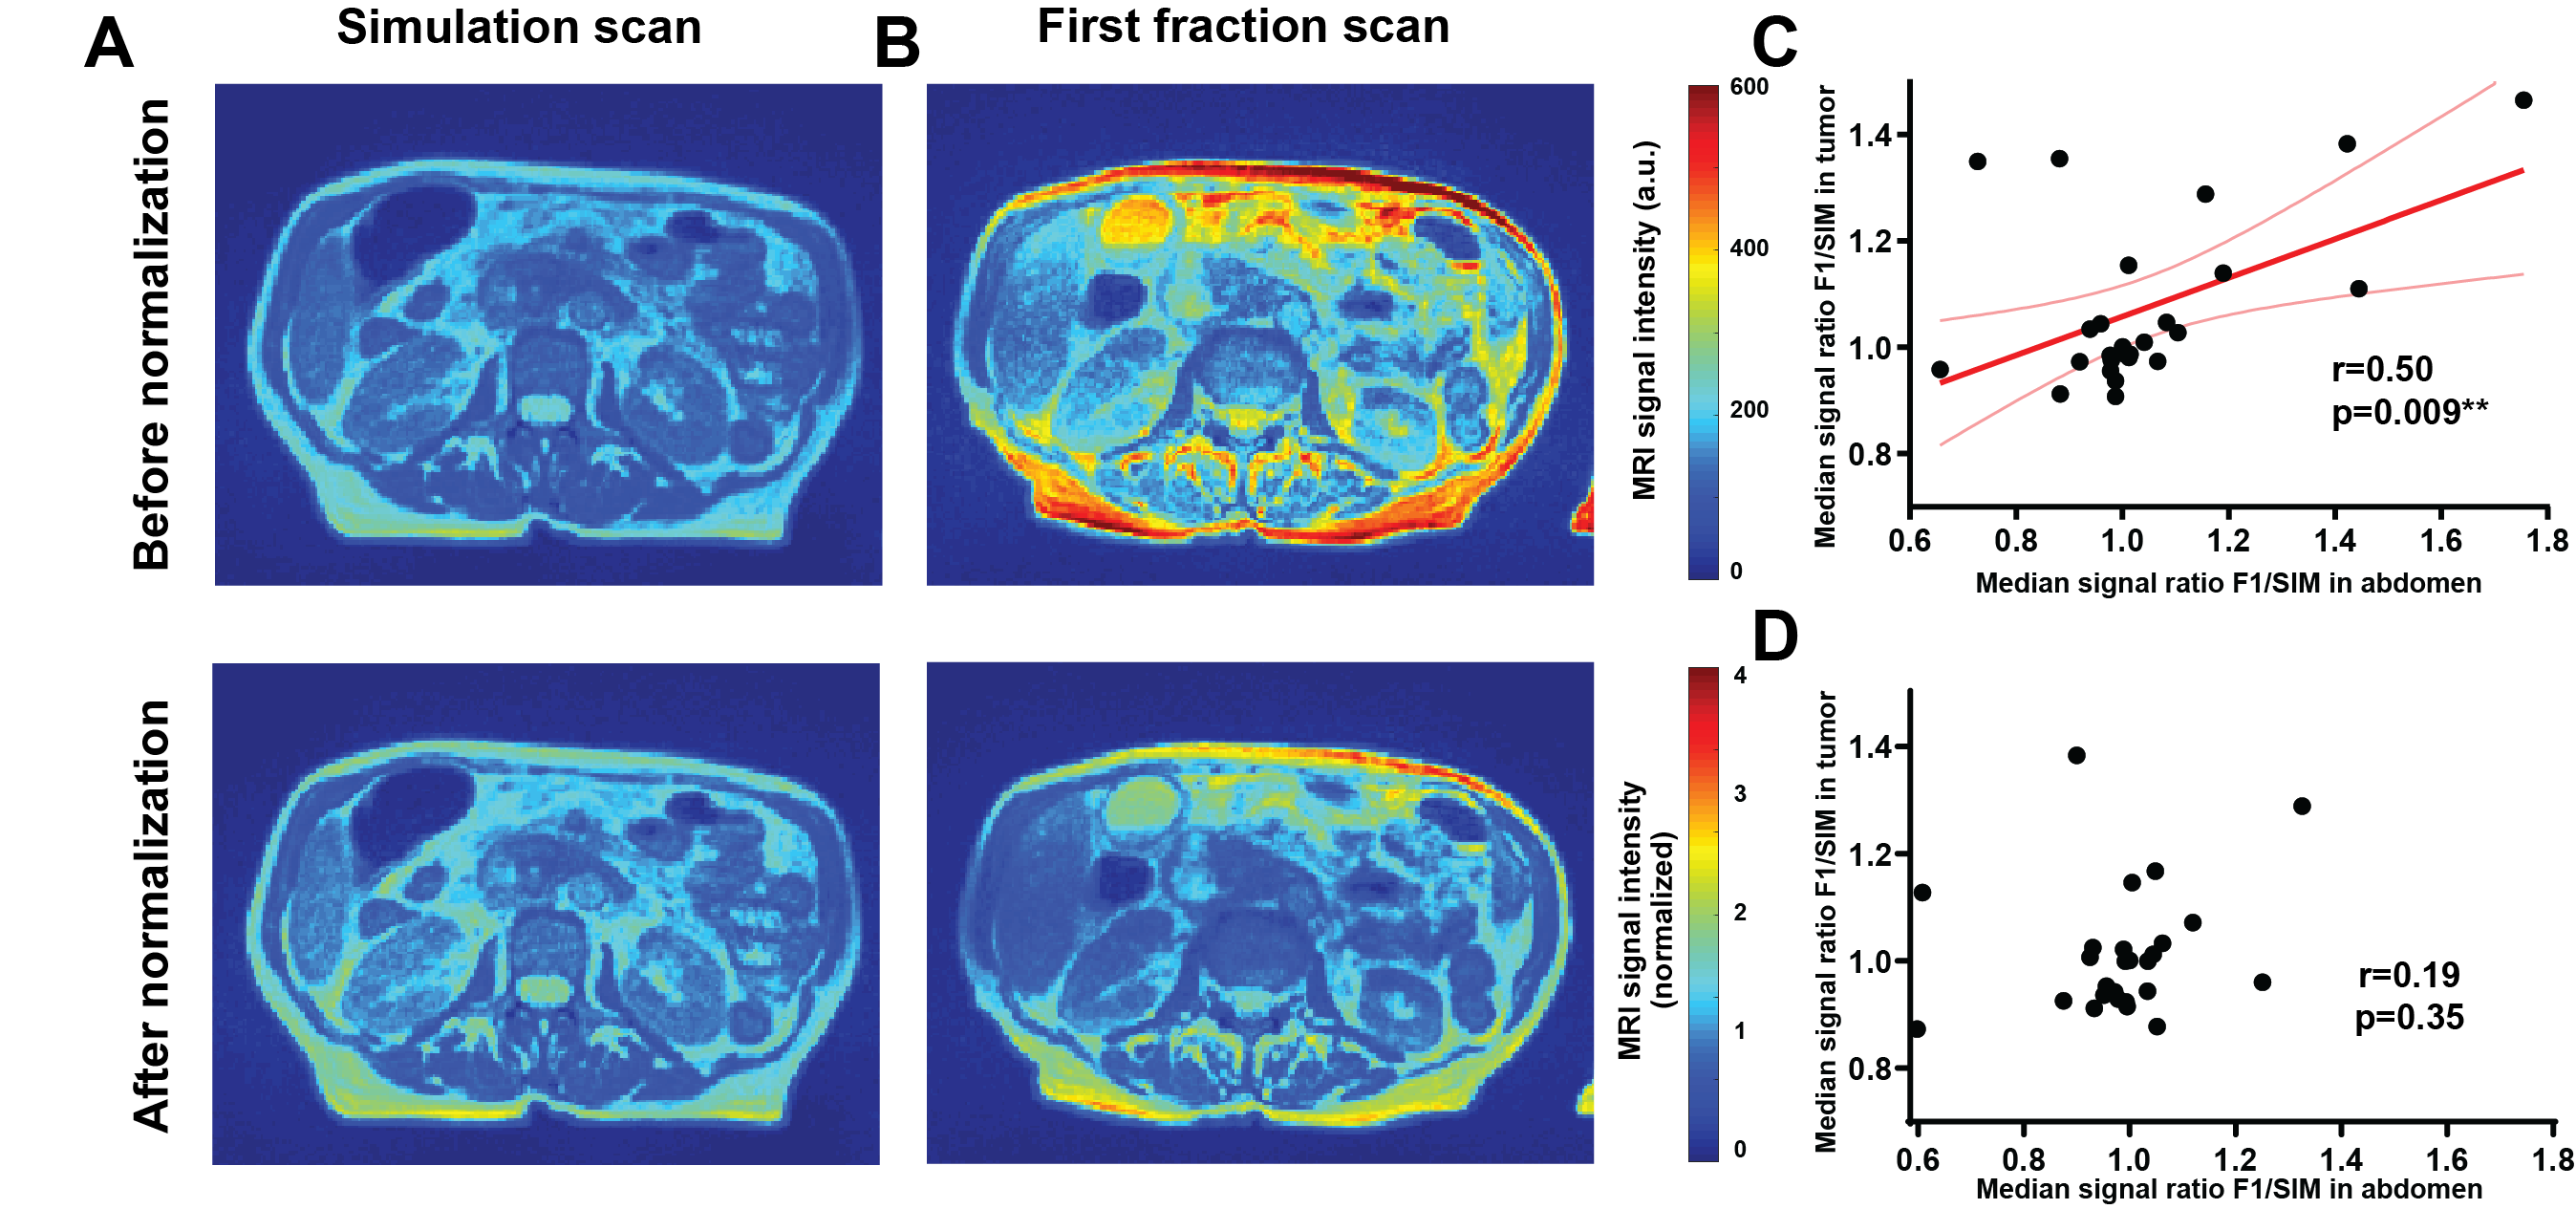
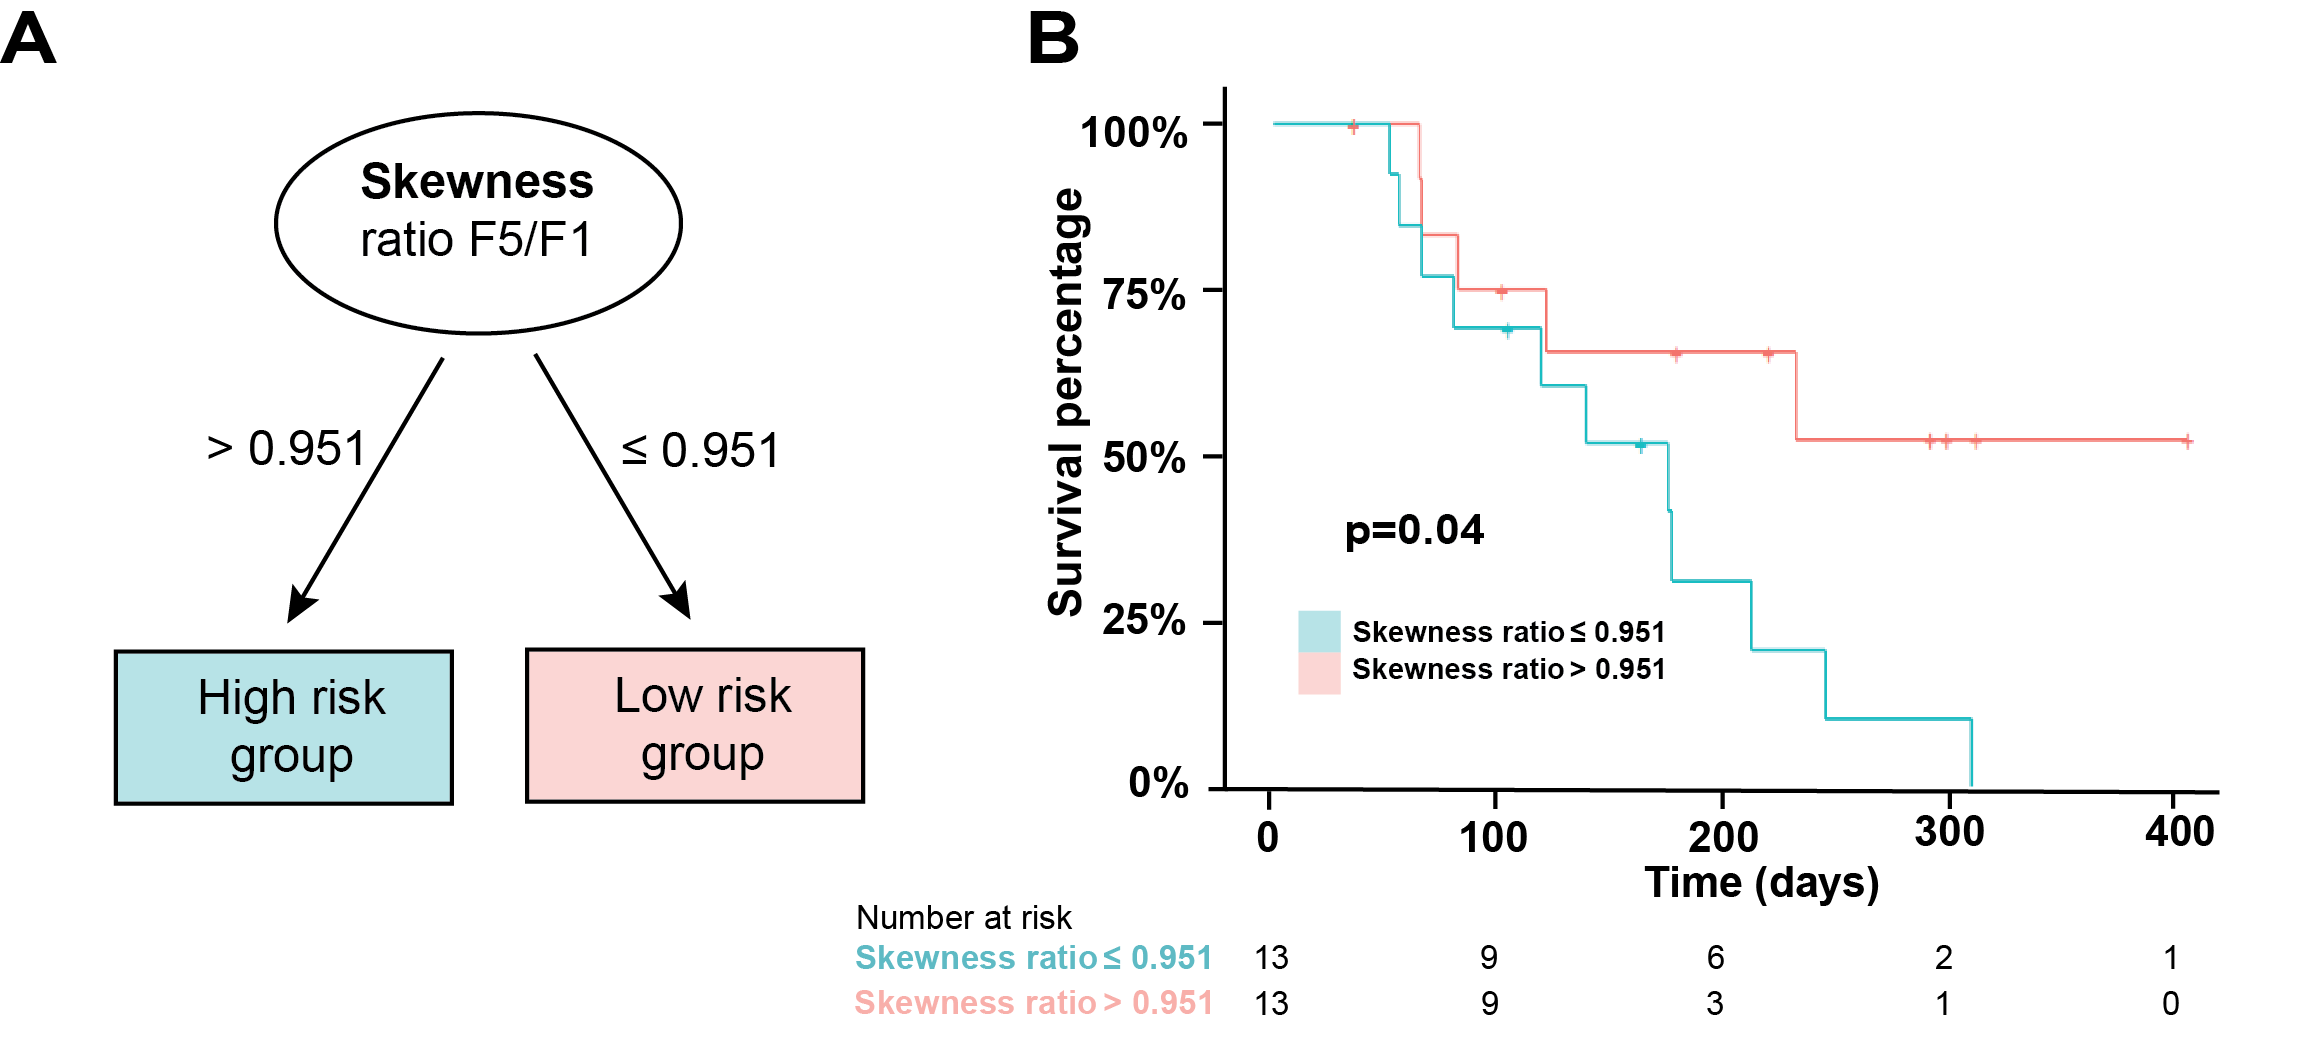
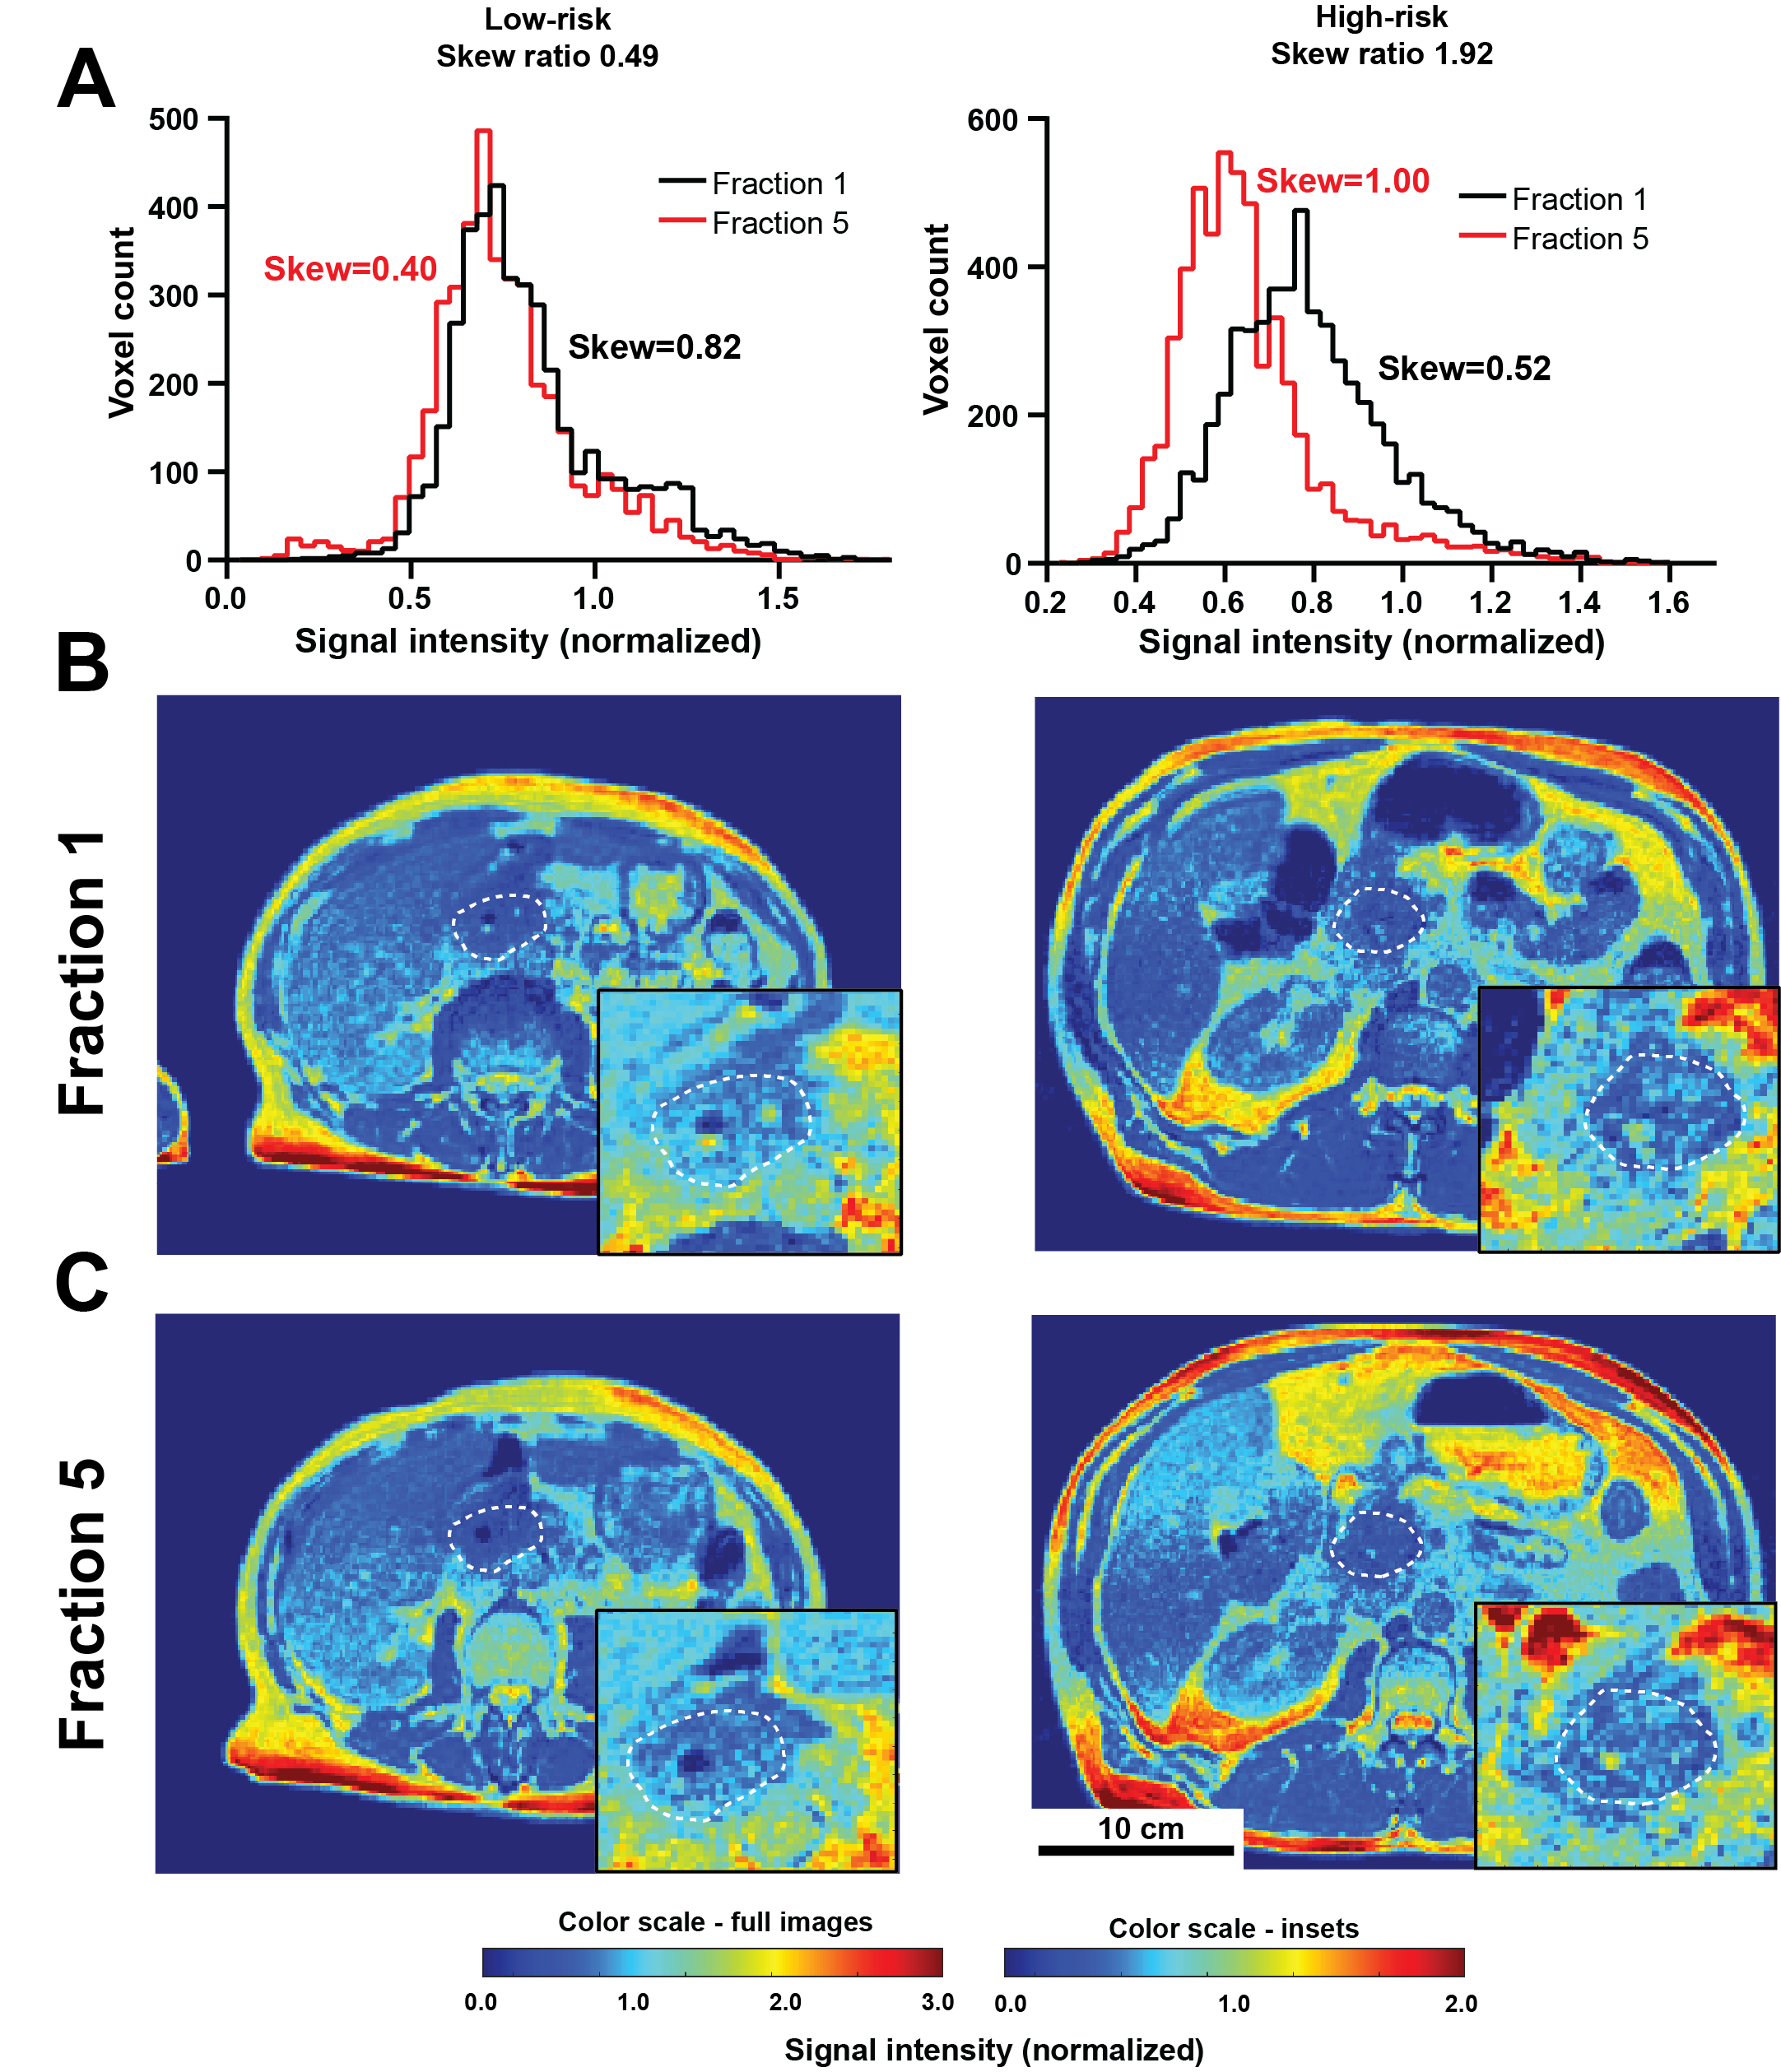
Before normalization, a strong intensity variation between SIM and F1 (before any treatment) was observed (Figure 1A and B), suggesting whole-image technical signal drift. This effect was confirmed through significant correlation in signal intensity changes in whole patient abdomen vs GTV (Figure 1C, p= 0.009). Normalization through division by median kidney image intensity was found to remove this artefactual relationship (Figure 1D). A significant association between PFS and the F5/F1 ratio for histogram skewness was observed (Hazard Ratio 2.75 (1.36-5.56), p=0.038 post multiplicity correction). Notably, no significant association was observed between the PFS and any pre-treatment (SIM) image features (p>0.11) including volume (p=0.40). Importantly, the treatment variables, i.e., dose delivered and the number of days between the first and last radiation fraction, were also not associated with PFS (p=0.15 and p=0.50 respectively). Patients could be stratified (Figure 2) to differentiate high risk of progression group (Skewness Ratio>0.95) from lower risk patients (Skewness Ratio ≤0.95), with significantly different PFS between the groups (p=0.041) Analysis of spatial robustness of MRgRT radiomics confirmed a relatively high stability of the skewness feature (CCC=0.972, 62nd percentile), with good performance measured for all histogram features (CCC>0.935) compared to other texture features, in particular the grey level run emphasis feature class. High risk patients showed an increase in right skewness during treatment (F5/F1 ratio=1.52±0.05) while low-risk group showed a decrease in skewness (F5/F1 ratio=0.60±0.01). Representative patients are shown in Figure 3.Discussion
We demonstrate in this preliminary study that the dynamic information available from the MRI scans at each radiation fraction may provide insight into early effects of irradiation on the tumor, showing that tumor skewness change may predict disease progression. Biologically, skewness may be directly related to tumor heterogeneity. Beyond demonstrating the relationship with outcome, the study is the first to develop the protocol for MRgRT image analytics. We show that linear image normalization not only reduces signal variability between scans but is required to remove technical global signal drift and identify the tumor-specific signal intensity changes. Additionally, we discuss the spatial robustness of the quantified radiomic features, highly relevant for PDAC lesions notoriously challenging to segment reliably and prone to motion. While some feature groups showed high technical variability following small changes in segmentation, suggesting poor reproducibility, the work revealed multiple robust features, promising for further radiomic studies. With further research, the findings may shed more light on the role of intratumor heterogeneity in radiotherapy response potentially increasing the reliability of predicting which patients can proceed to R0 resection (6), which can dramatically improve survival.Acknowledgements
This work was supported by NIH grants NIH 1U54CA193489, R01CA187532 and U01CA200464.References
1. Rudra S, Jiang N, Rosenberg SA, Olsen JR, Roach MC, Wan L, et al. Using adaptive magnetic resonance image-guided radiation therapy for treatment of inoperable pancreatic cancer. Cancer Med. 2019;8(5):2123-32.
2. Gillies RJ, Kinahan PE, Hricak H. Radiomics: Images Are More than Pictures, They Are Data. Radiology. 2016;278(2):563-77.
3. Avanzo M, Wei L, Stancanello J, Vallières M, Rao A, Morin O, et al. Machine and deep learning methods for radiomics. Medical physics. 2020;47(5).
4. Bieri O, Scheffler K. Fundamentals of balanced steady state free precession MRI. J Magn Reson Imaging. 2013;38(1):2-11.
5. Lin LI. A concordance correlation coefficient to evaluate reproducibility. Biometrics. 1989;45(1).
6. Gemenetzis G, Blair AB, Nagai M, Groot VP, Ding D, Javed AA, et al. Anatomic Criteria Determine Resectability in Locally Advanced Pancreatic Cancer. Annals of surgical oncology. 2021.
Figures