0035
Radio-pathomic tumor probability maps in glioma patients using autopsy tissue samples as ground truth1Biophysics, Medical College of Wisconsin, Milwaukee, WI, United States, 2Radiology, Medical College of Wisconsin, Milwaukee, WI, United States, 3Pathology, Medical College of Wisconsin, Milwaukee, WI, United States, 4Neurology, Medical College of Wisconsin, Milwaukee, WI, United States, 5Neurosurgery, Medical College of Wisconsin, Milwaukee, WI, United States, 6Biostatistics, Medical College of Wisconsin, Milwaukee, WI, United States, 7Biomedical Engineering, Medical College of Wisconsin, Milwaukee, WI, United States
Synopsis
This study used autopsy tissue samples to develop multi-stage radio-pathomic models of tumor probability in glioma patients. Three models were trained to predict cell density, extracellular fluid density, and cytoplasm density segmented from autopsy samples using T1, T1C, FLAIR, and ADC intensity. A fourth model was then trained to predict tumor probability from pathological annotations using the cellularity, extracellular fluid, and cytoplasm segmentations as input. The combined models were then able to non-invasively estimate tumor probability using MRI. These maps identified regions of tumor beyond the contrast-enhancing region and discriminated between areas of tumor and vasogenic edema within FLAIR hyperintensity.
Introduction
Gliomas are the most common primary intracranial brain tumor, with high-grade subtypes such as glioblastomas (GBMs) leading to near certain mortality1. Multi-parametric MRI is used as the primary tool for monitoring glioma growth and treatment response, with features such as T1-weighted contrast enhancement, FLAIR hyperintensity, and restricted diffusion on apparent diffusion coefficient (ADC) images used to track tumor progression over the course of a patient’s treatment2,3. Recently, machine learning and deep learning techniques have been proposed as methods to augment and enhance the tumor tracking process, with segmentation studies developing automated methods of segmenting tumor based on radiologist annotations and radio-pathomic mapping using biopsy tissues as ground truth4–7. However, autopsy studies of gliomas have identified areas of tumor well beyond the contrast-enhancing region, potentially leading to active tumor areas that would be missed by radiologist annotations and biopsy targeting8,9. Therefore, radio-pathomic maps that sample tissue beyond the traditional tumor margin may be necessary to capture the full extent of infiltrative tumor in glioma patients. This study developed a multi-stage radio-pathomic model for tumor probability using autopsy tissue samples aligned to the patient’s last clinical imaging prior to death. Specifically, we tested the hypothesis that autopsy-based radio-pathomic tumor probability maps (TPMs) would be able to identify areas of infiltrative tumor beyond traditional imaging signatures.Methods
Autopsy tissue and clinical imaging was acquired form 65 patients with a pathologically confirmed glioma diagnosis. Demographic and clinical information is presented in Table 1. A schematic representation of the data collection process and analytic framework is presented in Figure 1. A total of 159 tissue samples were collected across all patients at autopsy, which were then processed and stained for hematoxylin and eosin (HE). Following staining, slides were digitized using a sliding stage microscope at 40X magnification (0.2 microns per pixel). Images were then segmented to compute cell density, extracellular fluid density (ECF) and cytoplasm density (Cyt) using a color deconvolution algorithm. A subset of 33 tissue samples from 9 patients were also annotated for tumor presence by our pathologist-trained technician. T1, T1C, FLAIR, and ADC images from each patient’s last clinical imaging session prior to death were used for this study. All images were aligned to the FLAIR image, and all images (T1, T1C, FLAIR) were intensity normalized. Histology samples were then aligned to the MRI using a custom in-house software that applies a nonlinear transform to match tissue data to the FLAIR image from manually defined control points8–11. Separate bootstrap aggregated (“bagged”) ensemble algorithms were trained to predict voxel-wise ECF, Cyt, and cell density using 5 by 5 voxel tiles from each MRI. Models were trained on 2/3s of the full data set (47 subjects) and tested on a held out set to assess generalizability (22 subjects). Several algorithms were then trained to classify tumor vs. non-tumor using the annotations as ground truth and the tissue segmentations for cell density, ECF, and Cyt as input (train size: 6 subjects, test size: 3 subjects). Receiver operator characteristic analysis was used to select the highest performing model amongst the candidate algorithms, and this model was then used to convert MRI-based predictions of ECF, Cyt, and cell density to whole brain tumor probability maps to identify regions of predicted tumor beyond traditional imaging signatures.Results
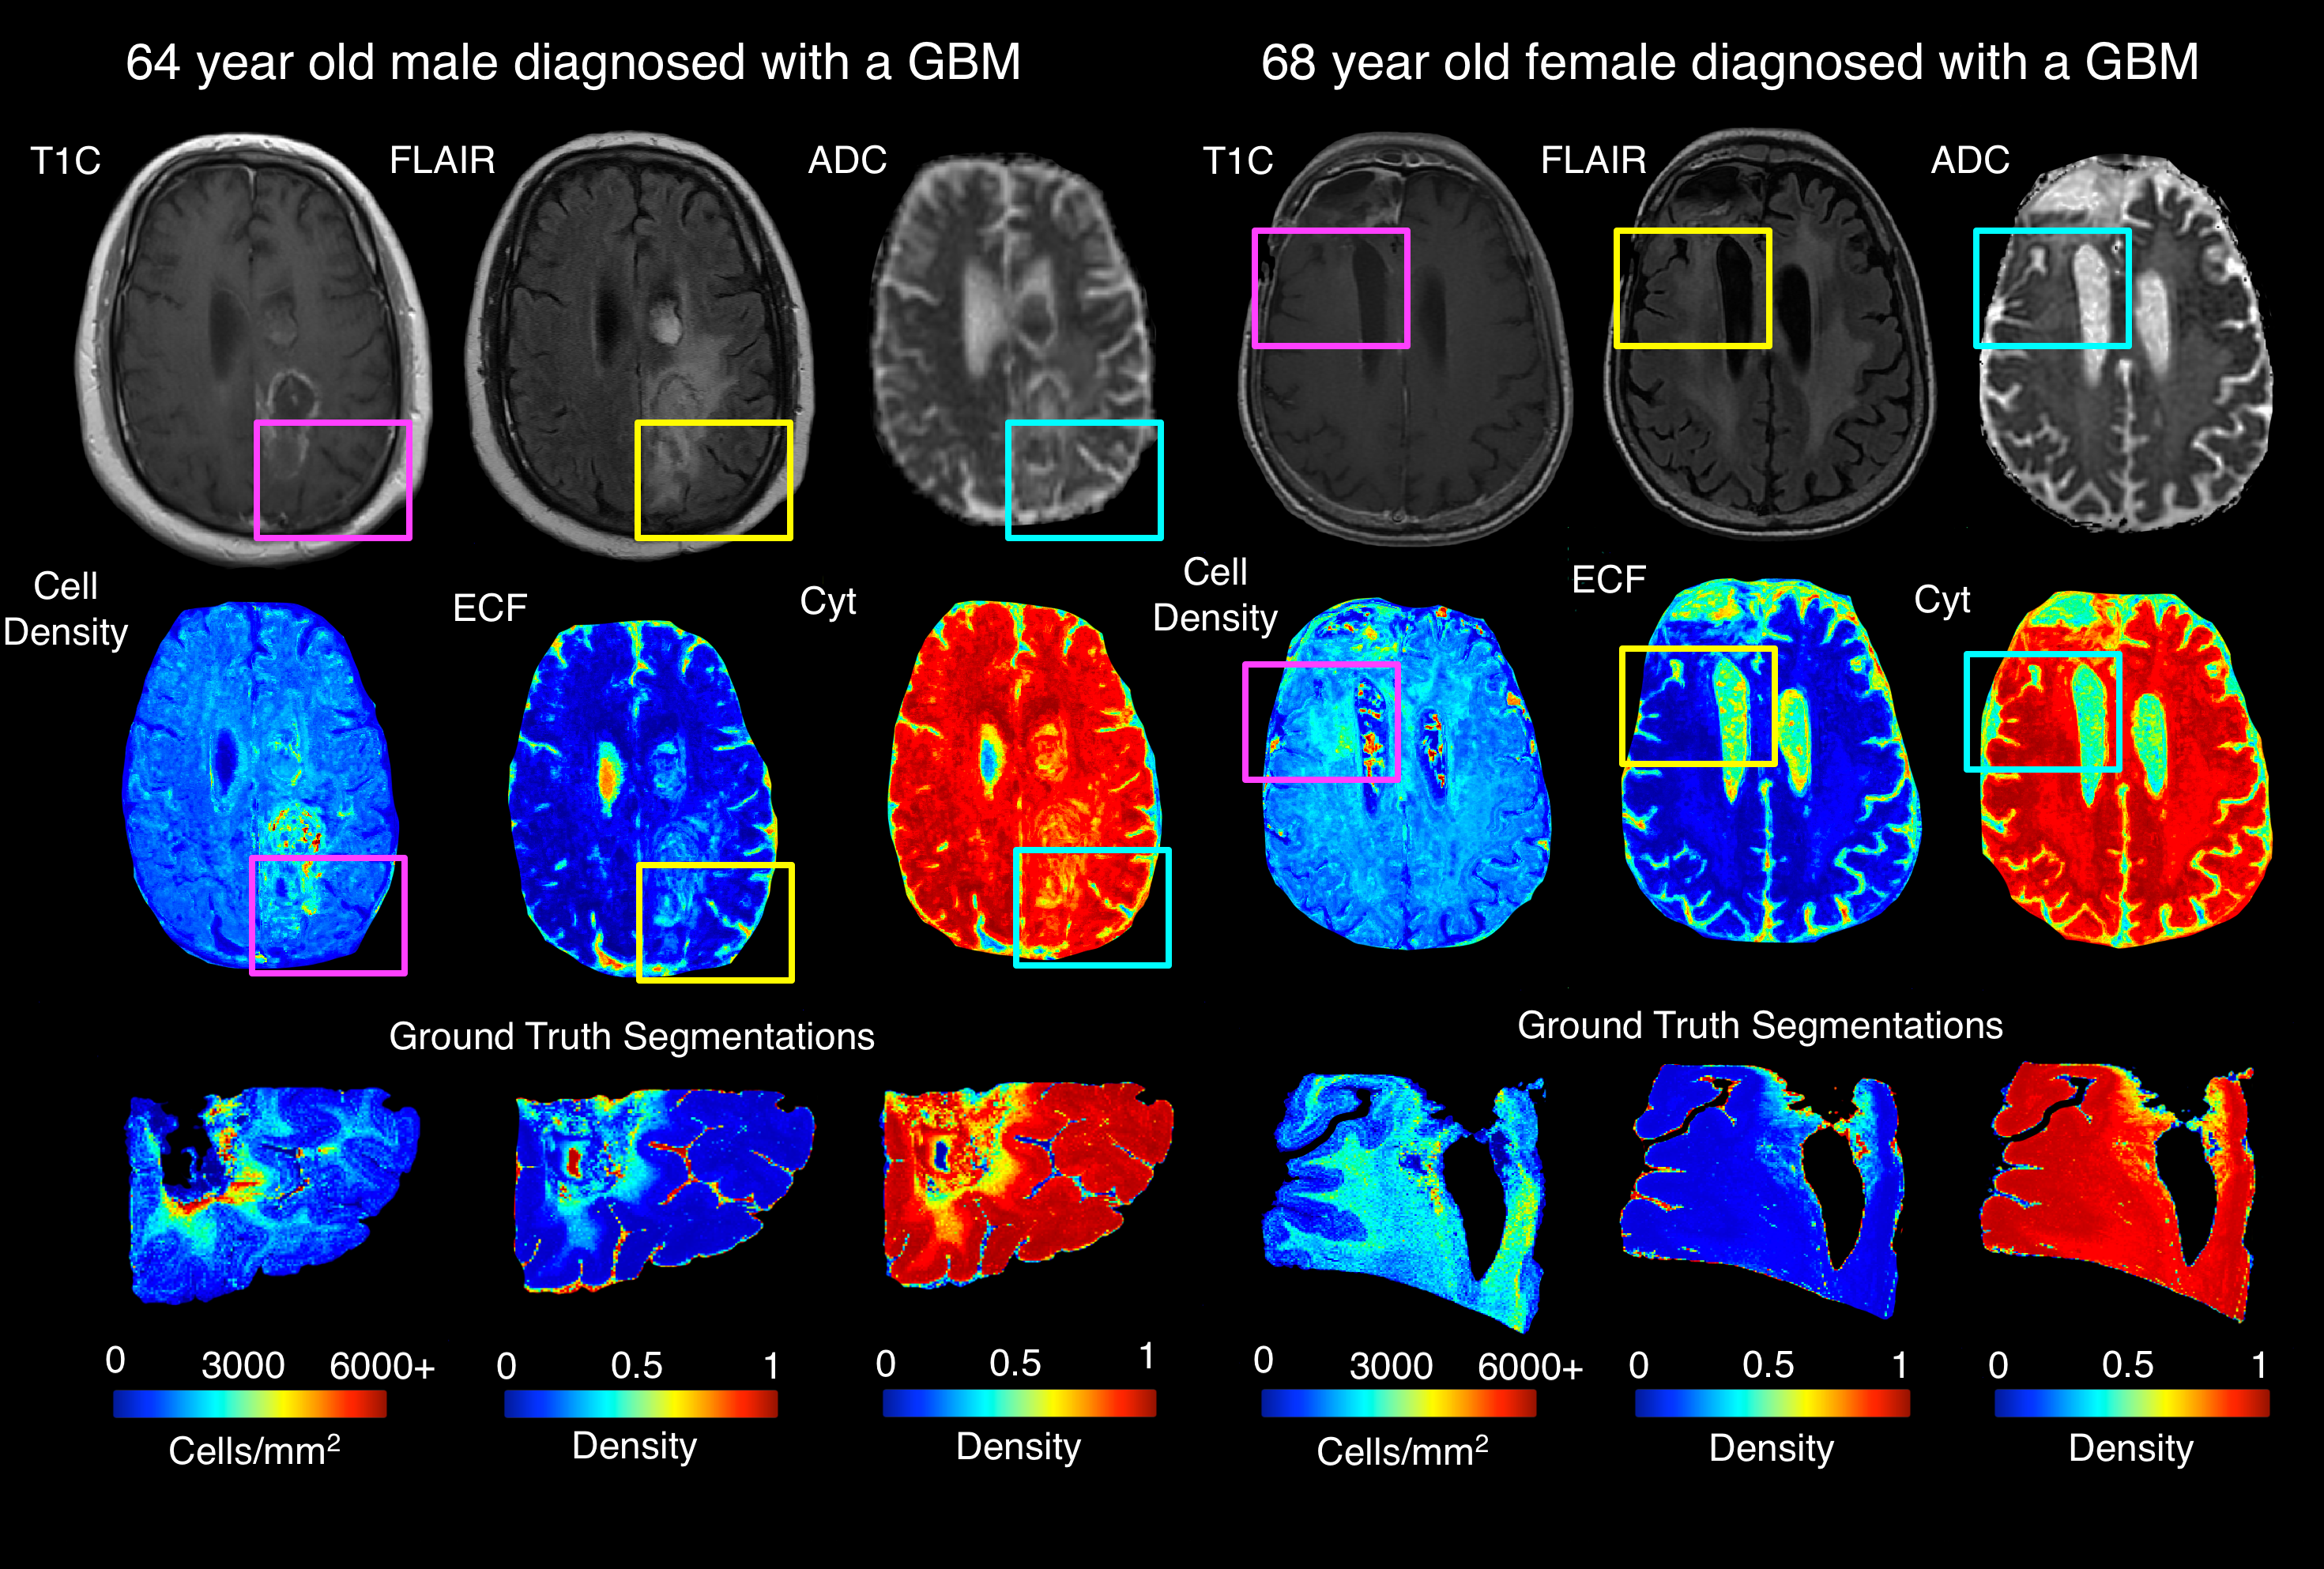
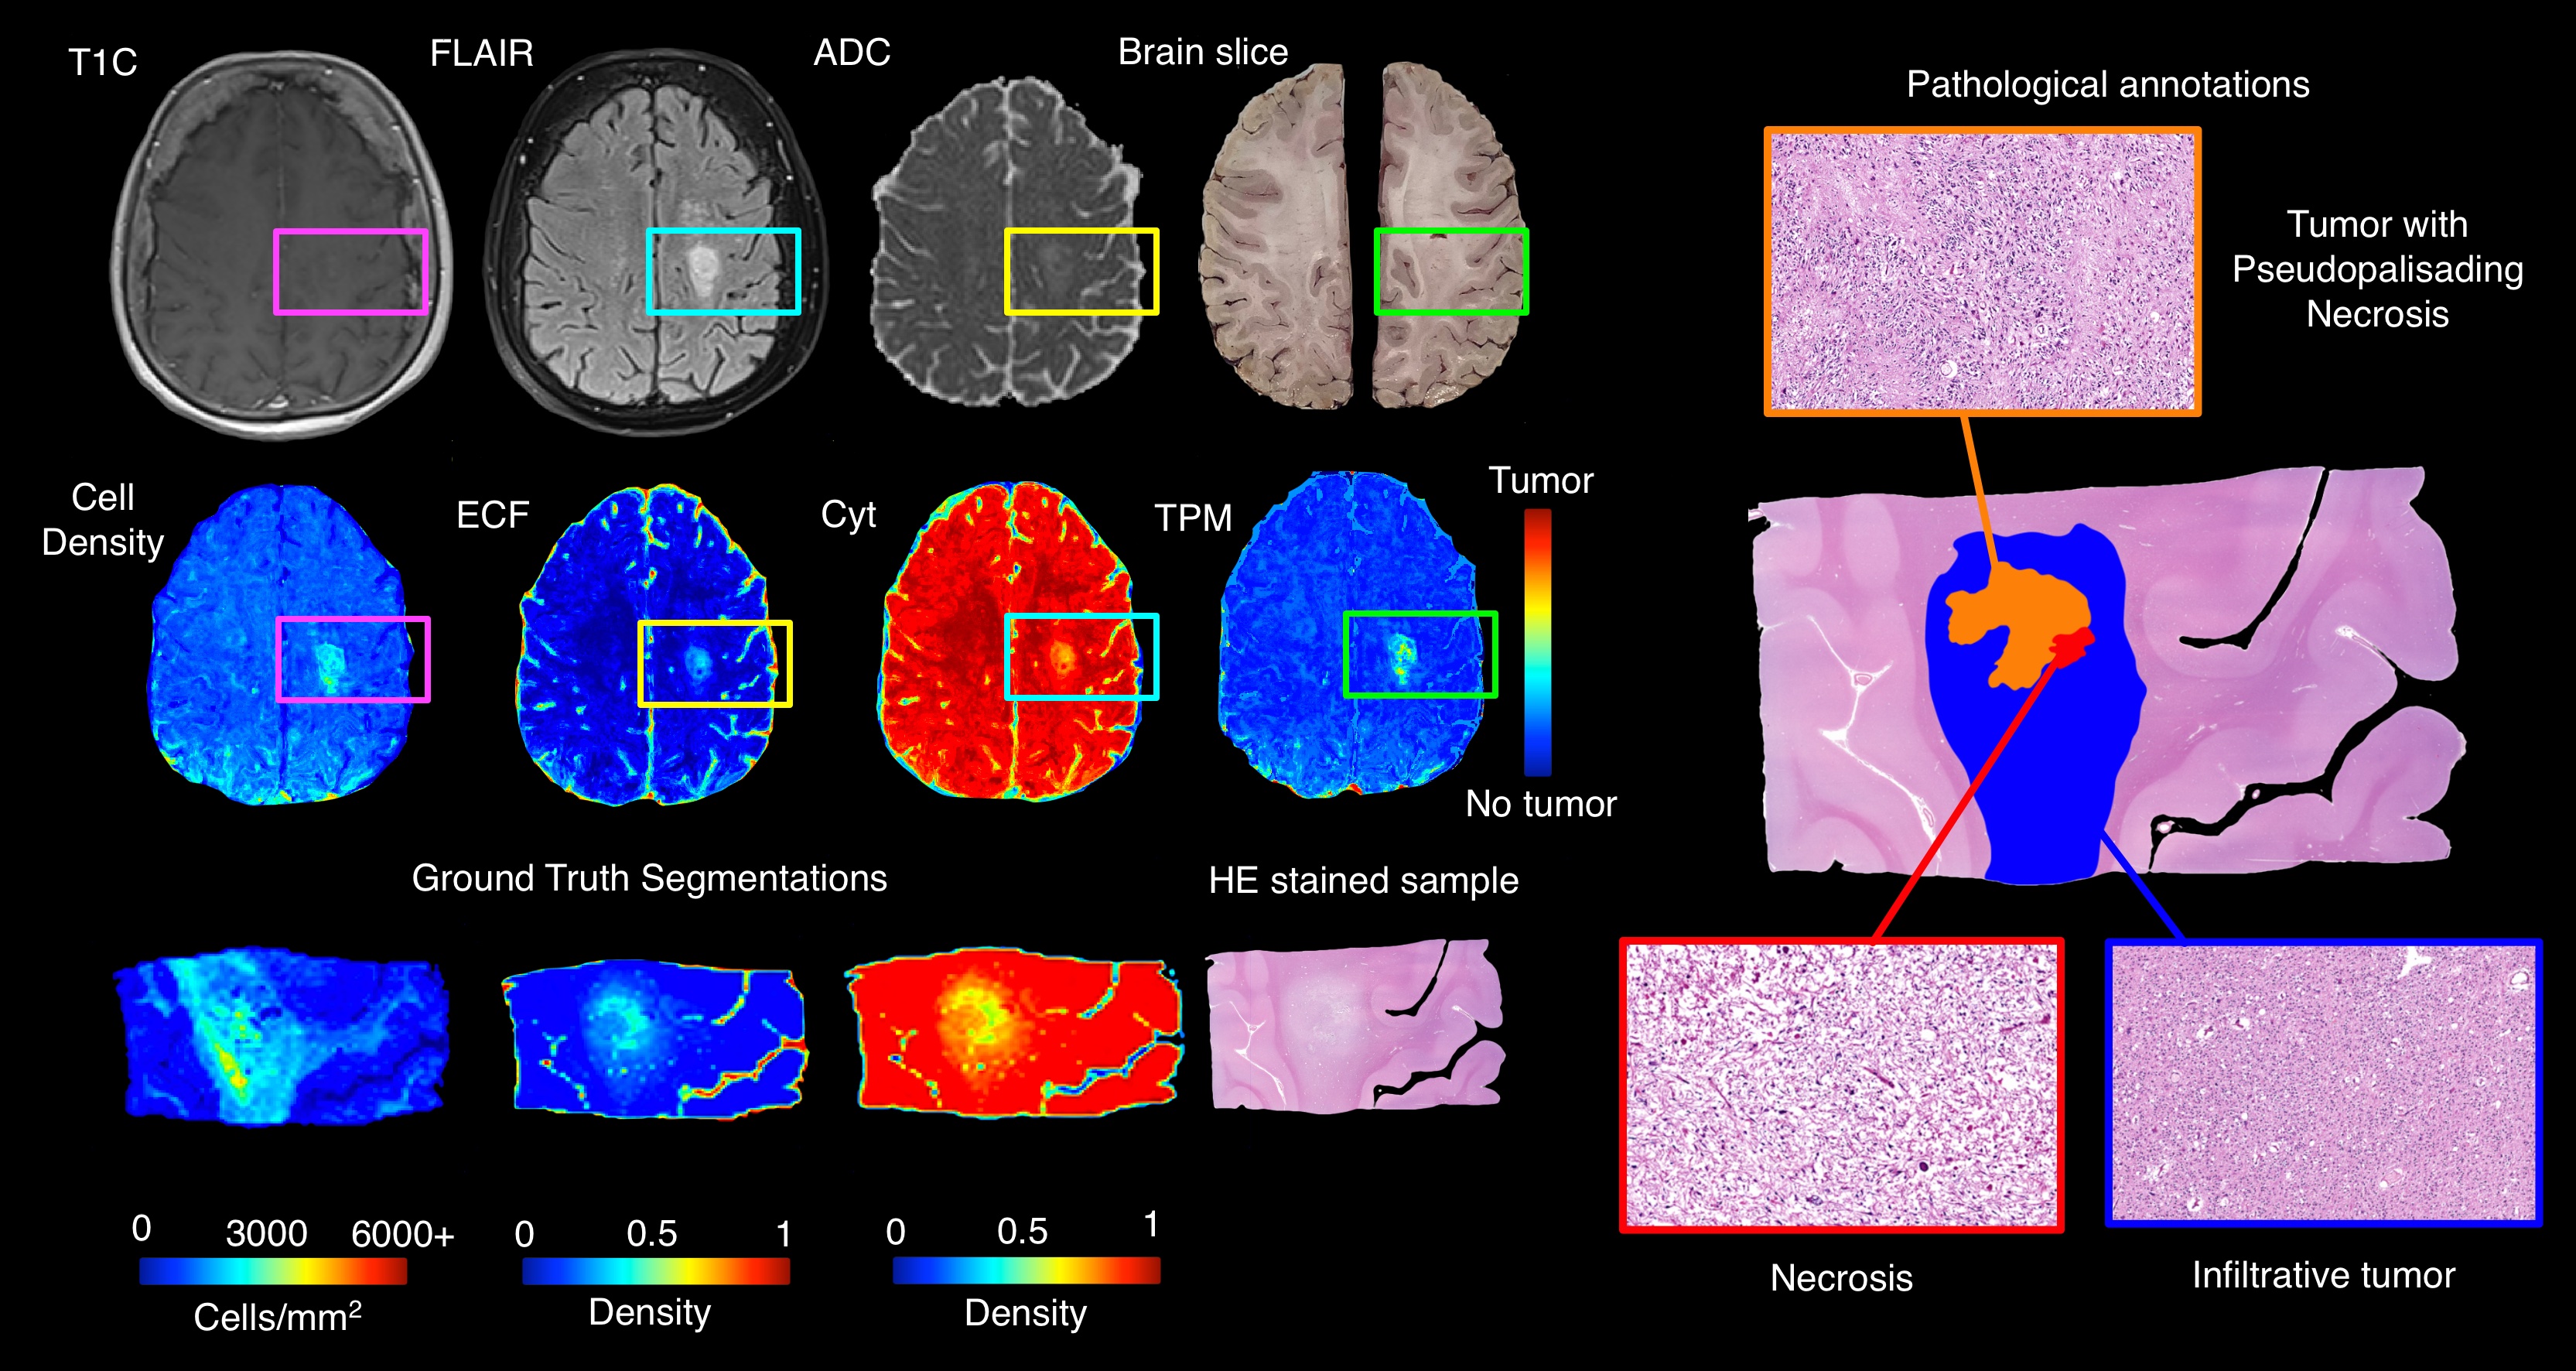
Results from the model fitting process across the three radio-pathomic models and the tumor prediction model are presented in Figure 2. Each radio-pathomic model had a mean subject-level RMSE within a standard deviation of the ground truth (Cell Density Std. RMSE = 0.756, Cyt Std. RMSE = 0.917, ECF Std. RMSE = 0.941), indicating reasonably accurate predictions for each tissue type. The RUSBoost ensemble model performed the best amongst candidate tumor prediction models (ROC AUC = 0.857) and was selected for the generation of tumor prediction maps from the radio-pathomic models. Example Cell, Cyt, and ECF predictions are presented in Figure 3, showing subjects where the models are able to identify areas of hypercellularity beyond contrast enhancement and distinguish between different components of the FLAIR hyperintense regions (i.e. increased ECF in regions of vasogenic edema, high cellularity in tumor regions). Figure 4 shows an example TPM for a subject along with ground truth annotations, demonstrating that the full multi-stage model can identify distinct regions of infiltrative tumor and pseudopalisading necrosis outside of contrast enhancement.Discussion
This study demonstrates a multi-stage model for mapping tumor probability in glioma patients using autopsy tissue samples as ground truth. The algorithm developed identifies areas of non-enhancing tumor. This technology may be useful in the future for tracking tumor progression and guiding therapy. Time between MRI and death becomes a caveat when using autopsy tissue data to model tumor location; therefore, future studies incorporating tumor growth models from longitudinal imaging may be able to account for this effect beyond what could be controlled for in this study.Conclusion
This study developed a multi-stage model for mapping gliomas using autopsy tissue samples as ground truth, which was able to identify regions of tumor beyond traditional imaging signatures.Acknowledgements
We would like to thank our patients for their participation in this study, the Medical College of Wisconsin Machine Learning Working Group for helpful feedback and discussions, and our funding sources: American Brain Tumor Association Grant DG160004, Froedtert Foundation, Strain for the Brain 5K Run, Milwaukee, WI, NIH/NCI R01CA218144, R01CA218144-02S1, R21CA231892, and R01CA249882.References
References
1. Ostrom QT, Bauchet L, Davis FG, et al. The epidemiology of glioma in adults: a “state of the science” review. Neuro Oncol 2014;16:896–913.
2. Smits M, van den Bent MJ. Imaging Correlates of Adult Glioma Genotypes. Radiology 2017;284:316–31.
3. Ellingson BM. Radiogenomics and imaging phenotypes in glioblastoma: novel observations and correlation with molecular characteristics. Curr Neurol Neurosci Rep 2015;15:506.
4. Gates EDH, Lin JS, Weinberg JS, et al. Guiding the first biopsy in glioma patients using estimated Ki-67 maps derived from MRI: conventional versus advanced imaging. Neuro Oncol 2019;21:527–36.
5. Eidel O, Neumann J-O, Burth S, et al. Automatic Analysis of Cellularity in Glioblastoma and Correlation with ADC Using Trajectory Analysis and Automatic Nuclei Counting. PLoS One 2016;11:e0160250.
6. Havaei M, Davy A, Warde-Farley D, et al. Brain tumor segmentation with Deep Neural Networks. Med Image Anal 2017;35:18–31.
7. Menze BH, Jakab A, Bauer S, et al. The Multimodal Brain Tumor Image Segmentation Benchmark (BRATS). IEEE Trans Med Imaging 2015;34:1993–2024.
8. LaViolette PS, Mickevicius NJ, Cochran EJ, et al. Precise ex vivo histological validation of heightened cellularity and diffusion-restricted necrosis in regions of dark apparent diffusion coefficient in 7 cases of high-grade glioma. Neuro Oncol 2014;16:1599–606.
9. Nguyen HS, Milbach N, Hurrell SL, et al. Progressing Bevacizumab-Induced Diffusion Restriction Is Associated with Coagulative Necrosis Surrounded by Viable Tumor and Decreased Overall Survival in Patients with Recurrent Glioblastoma. AJNR Am J Neuroradiol 2016;37:2201–8.
10. Bobholz SA, Lowman AK, Barrington A, et al. Radiomic Features of Multiparametric MRI Present Stable Associations With Analogous Histological Features in Patients With Brain Cancer. Tomogr (Ann Arbor, Mich) 2020;6:160–9.
11. McGarry SD, Bukowy JD, Iczkowski KA, et al. Gleason Probability Maps: A Radiomics Tool for Mapping Prostate Cancer Likelihood in MRI Space. Tomogr (Ann Arbor, Mich) 2019;5:127–34.
Figures
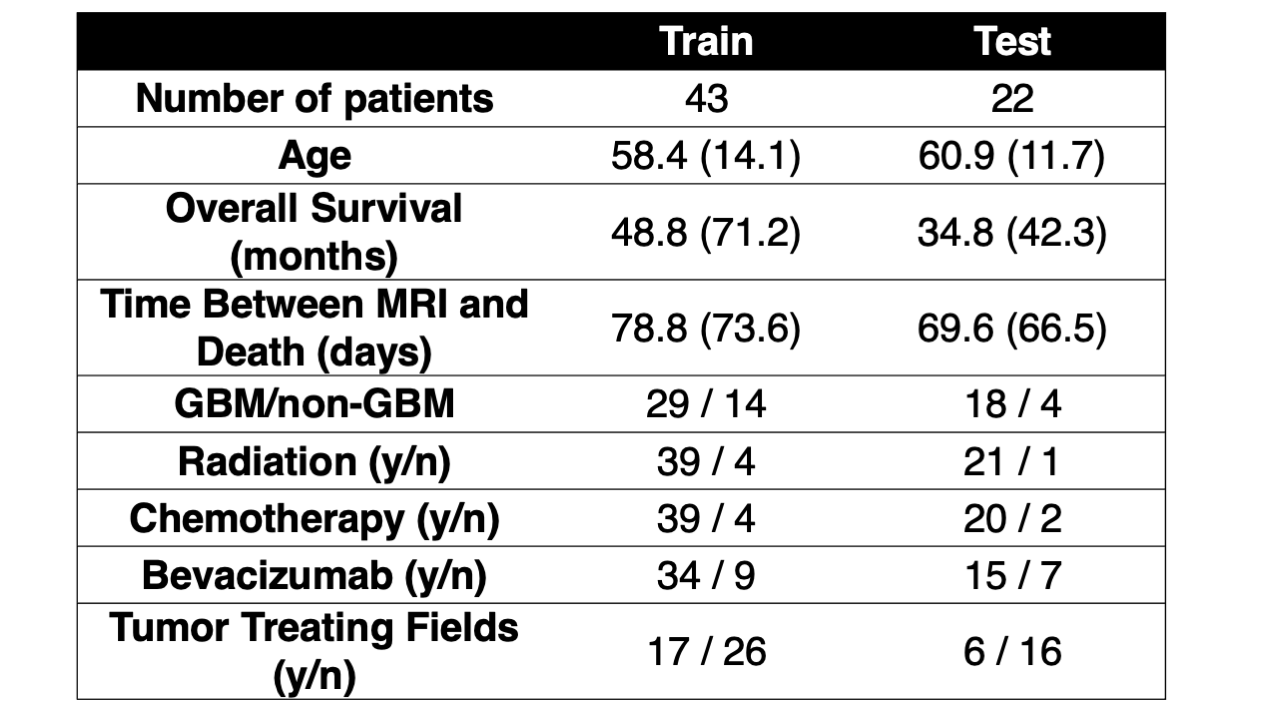
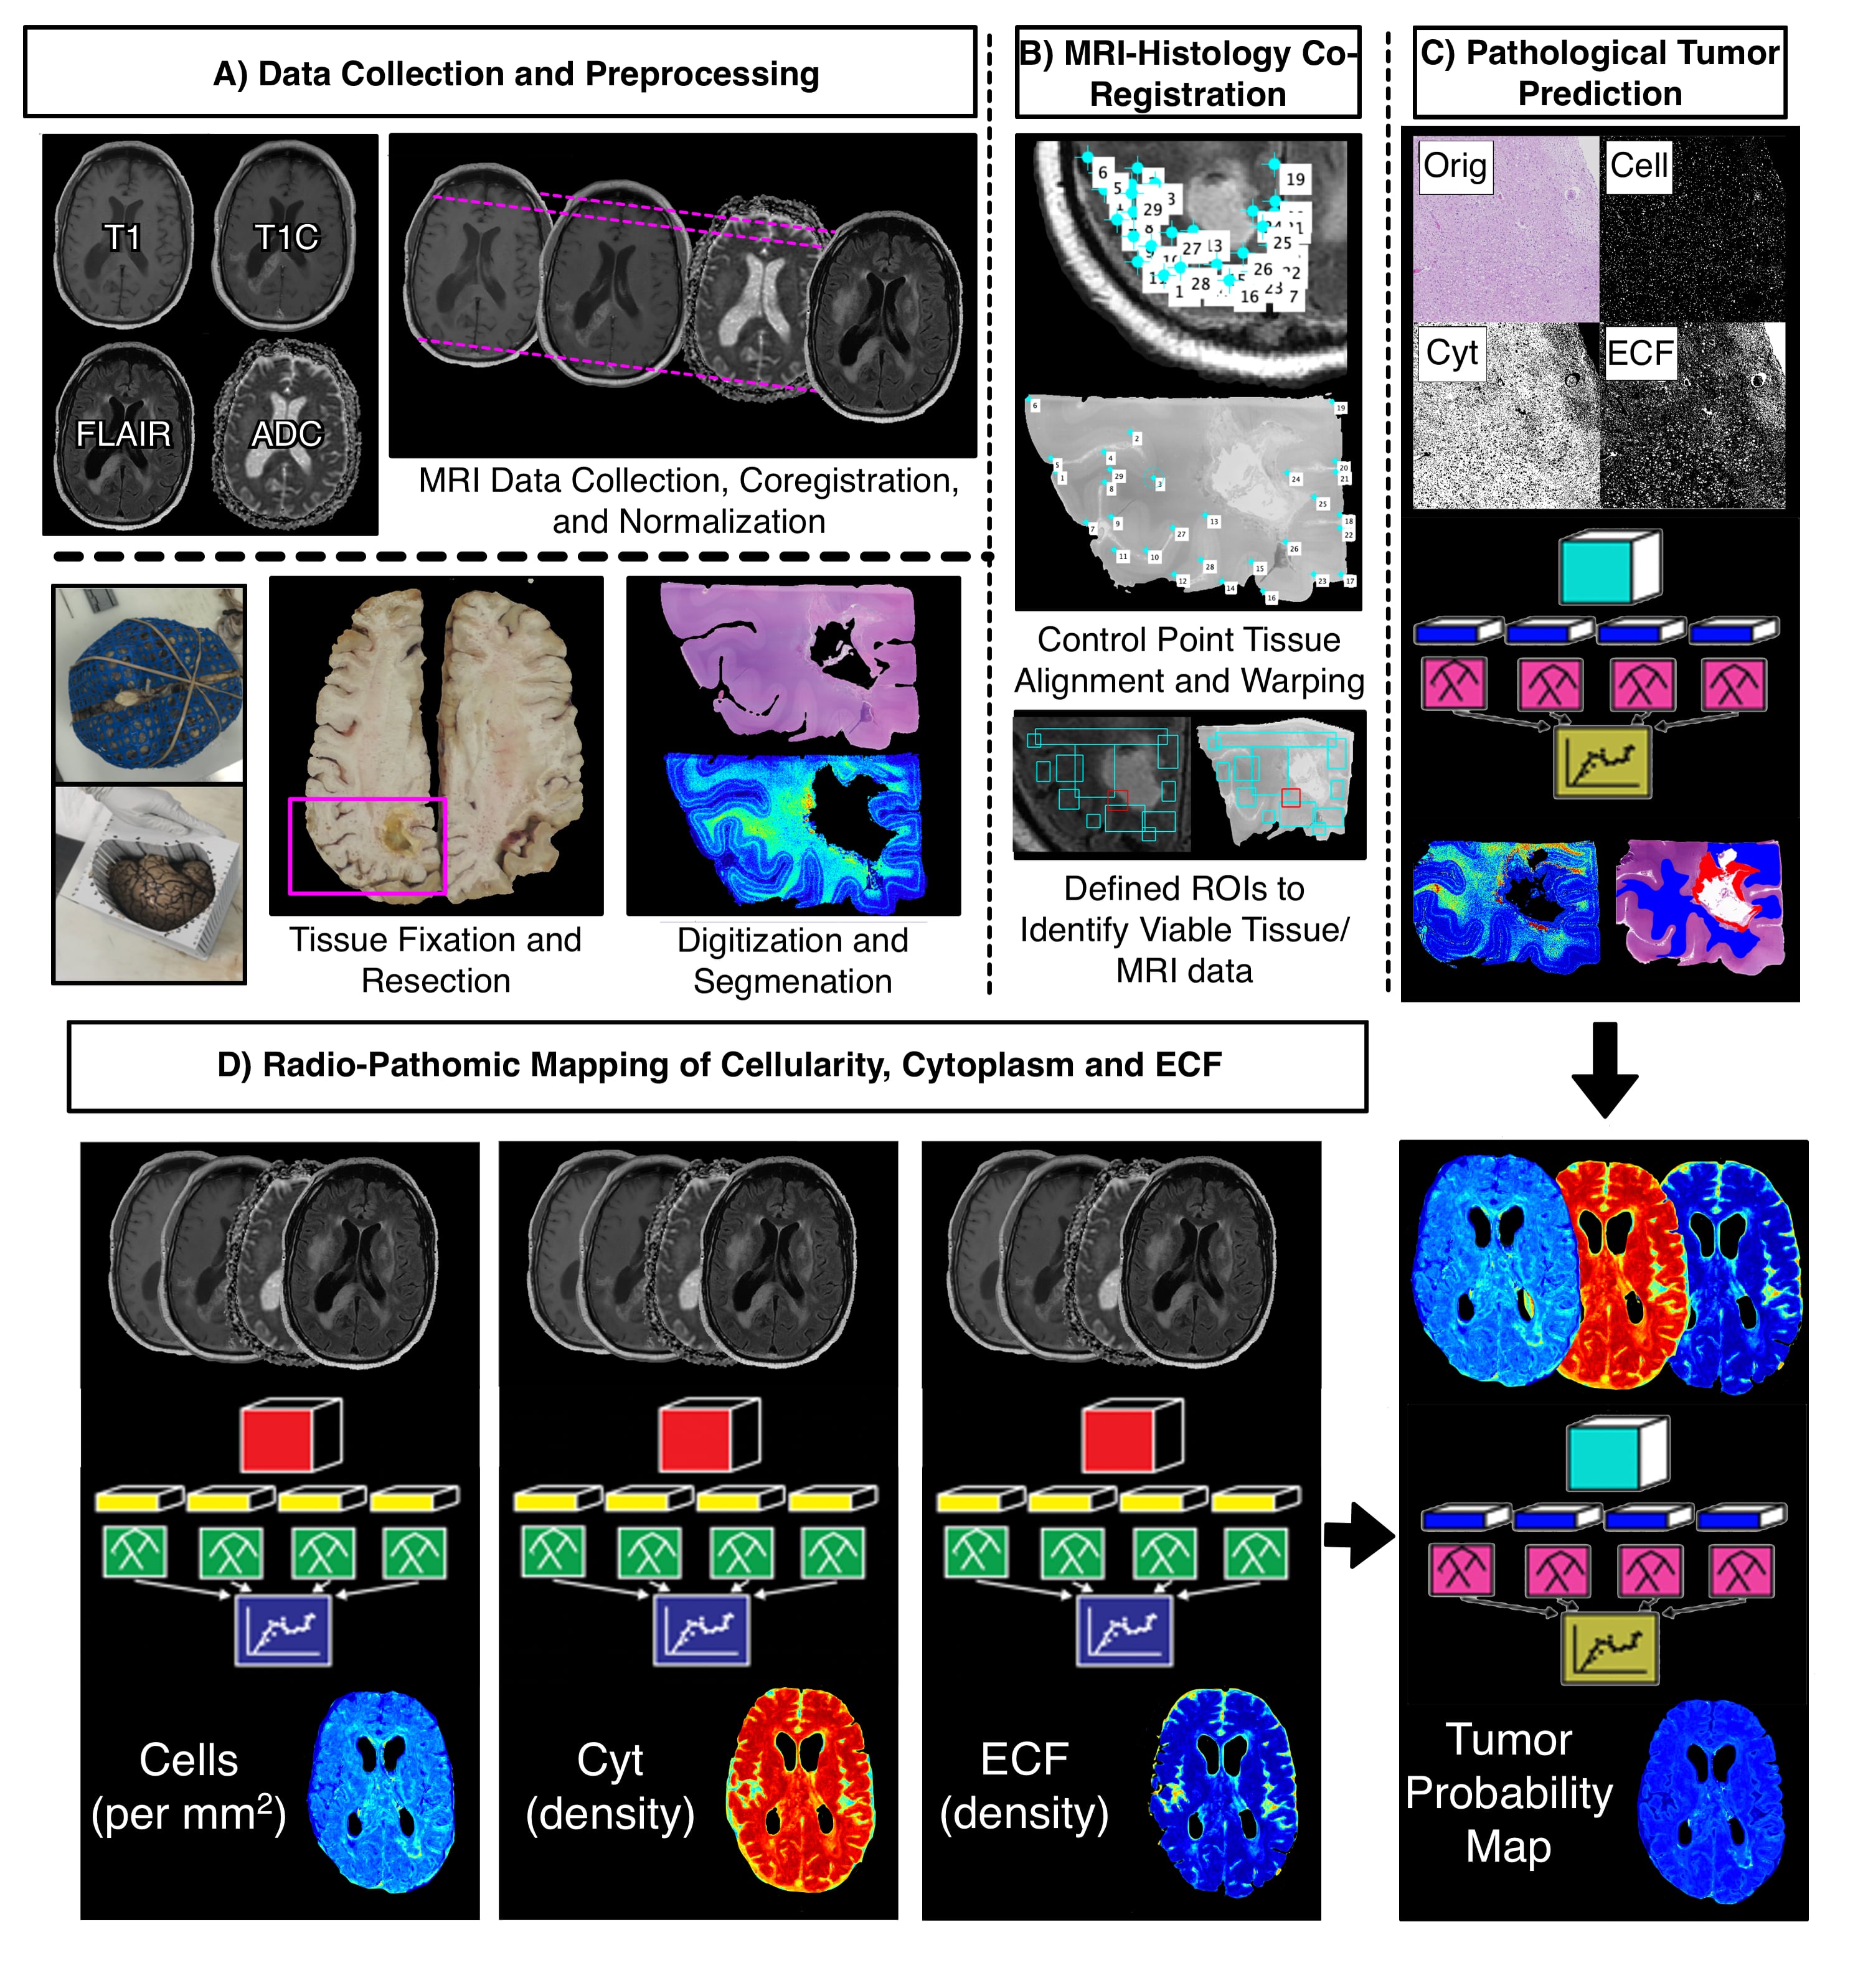
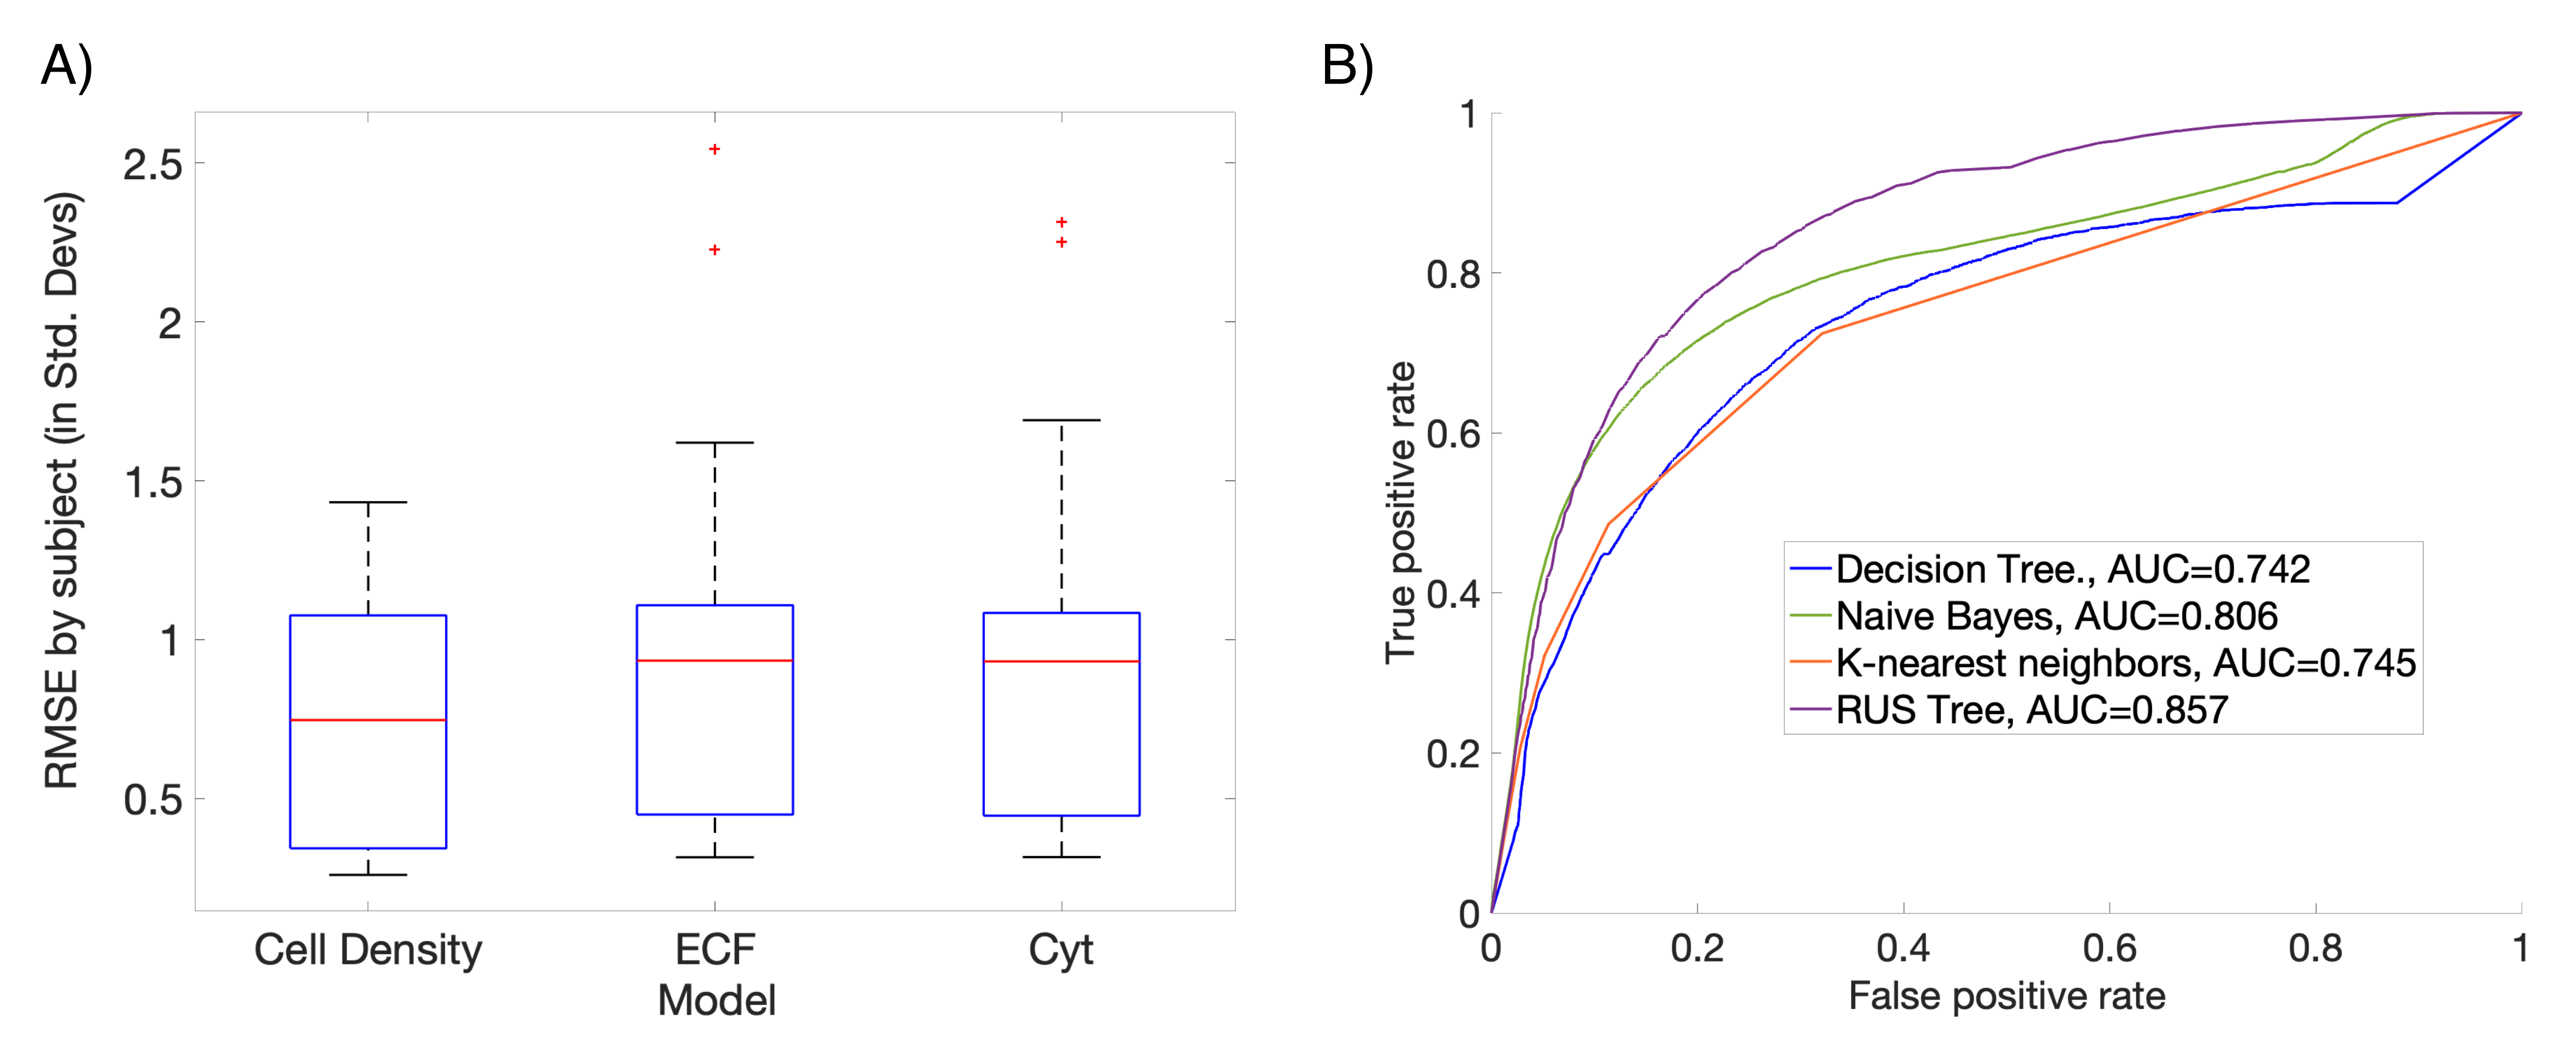
Figure 2: Performance summary for each component of the multi-stage model. A) The three radio-pathomic models predicted cell density, ECF and Cyt within a standard deviation of the ground truth. B) The RUSBoost tree algorithm performed the best amongst candidate tumor prediction models on ROC analysis, and was thus used to convert radio-pathomic segmentations into tumor probability.