0034
Test-retest repeatability of data-driven radiomic features derived from a deep-learning model: Diffusion-weighted MRI of soft-tissue sarcoma1Division of Radiotherapy and Imaging, Institute of Cancer Research, London, United Kingdom, 2Department of Radiology, Royal Marsden NHS Foundation Trust, London, United Kingdom, 3Institute of Cancer Research, London, United Kingdom
Synopsis
Monitoring treatment response of soft-tissue sarcomas (STS) following radiotherapy is challenging due to the inherent intratumoral heterogeneity of the disease. Radiomics and deep-learning provide opportunities for the discovery of potent biomarkers of treatment response. Successful response biomarkers must demonstrate good baseline repeatability if they are to be used for personalized treatment. We explore the stability of radiomic features derived from a deep-learning pipeline by determining the pairwise correlation of derived features, and measuring the baseline repeatability of features derived from the Apparent Diffusion-Coefficient maps. We demonstrate that 81/512 features are both independent and stable at repeat baseline measurement.
Introduction
Soft tissue sarcomas (STS) demonstrate high intratumoral heterogeneity, which makes it difficult to successfully monitor their response to treatment using conventional size-based criteria (i.e. RECIST). Radiomics is a relatively recent methodology that aims to quantify the level of intra-tumoral heterogeneity within tumours via the measurement of several statistical "hand-crafted" features that aim to represent image texture1. However, a potential disadvantage of these features is that they are not necessarily data driven and thus may miss characteristics within the image that could be important for demonstrating tumour response. For example, most derived texture features only explore local pixel characteristics and may not capture heterogeneity well at long length scales. On the other hand, features derived from pre-trained deep-learning networks represent characteristics within the image that are specifically tuned for classification tasks on many thousands of natural images and thus may better represent complex inter-dependencies between voxel locations. In this preliminary work we investigate the test-retest repeatability of 512 features derived using a pre-trained deep-learning network (VGG16) from maps of apparent diffusion coefficient (ADC) in 22 patients with retroperitoneal soft-tissue sarcoma (STS).Methods
Patient PopulationTwenty-two patients with retroperitoneal sarcoma were recruited as part of a prospective single-centre study with institutional board approval2. Patients received repeat pre-treatment baseline MR examinations (MAGNETOM Aera, Siemens Healthcare, Erlangen, Germany) using identical image acquisition parameters; the repeat scan was performed following a Gadolinium contrast injection and repositioning on the scanner. The acquisition included axial diffusion-weighted imaging (DWI) (b = 50,600,900 s/mm2). A single radiologist outlined the regions-of-interest (ROIs) on T2-weighted images; ROIs included the whole tumour on all slices in which the tumour appeared. Using a monoexponential fit, ADC maps were extracted from the diffusion imaging and the ROIs transferred to the ADC maps. All data and ROIs were resampled to the same resolution [2.4 x 2.4 x 5.0 mm3].
Image Processing
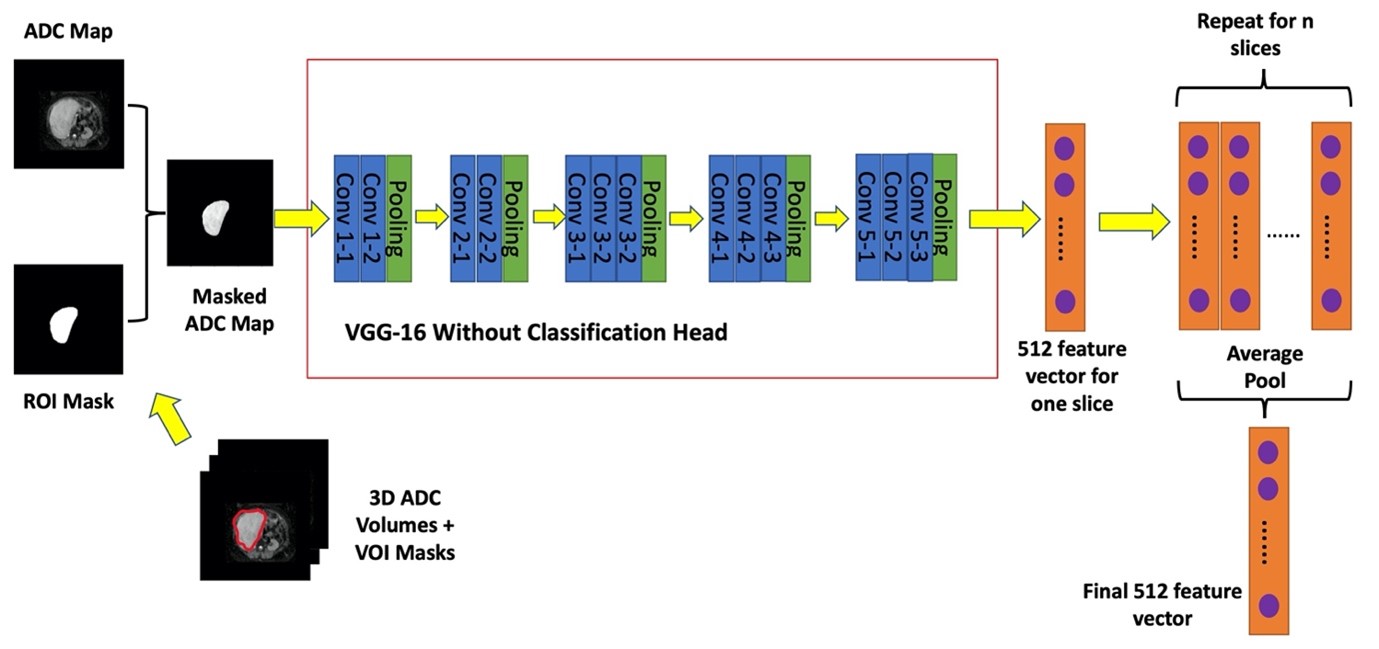
VGG16 is a convolutional neural network that achieves state-of-the-art performance on the ImageNet classification benchmark3. Feature extraction using deep learning has shown promising results in many areas of computer vision, natural language processing, and signal processing4 and has also started to be explored within the context of cancer radiomics studies5. In this work, we extracted the features from the last convolutional layer before the classification head of the VGG network, providing a feature map of size 7x7x512; we performed a global average pool of the 7x7 feature map in each of the 512 channels for each slice in a patient to get 512 feature vector. Then, we averaged the feature vectors across all the slices in each patient to get the final set of 512 features across the tumour volume. Features were extracted using Pytorch package6. Input ADC maps were resized to 224 x 224 by zero-padding. Next, we copied the ADC map data (units of 10-5 mm2/s) across the three channels as the VGG model expects images with three channels. The feature extraction pipeline can be seen in Figure 1.
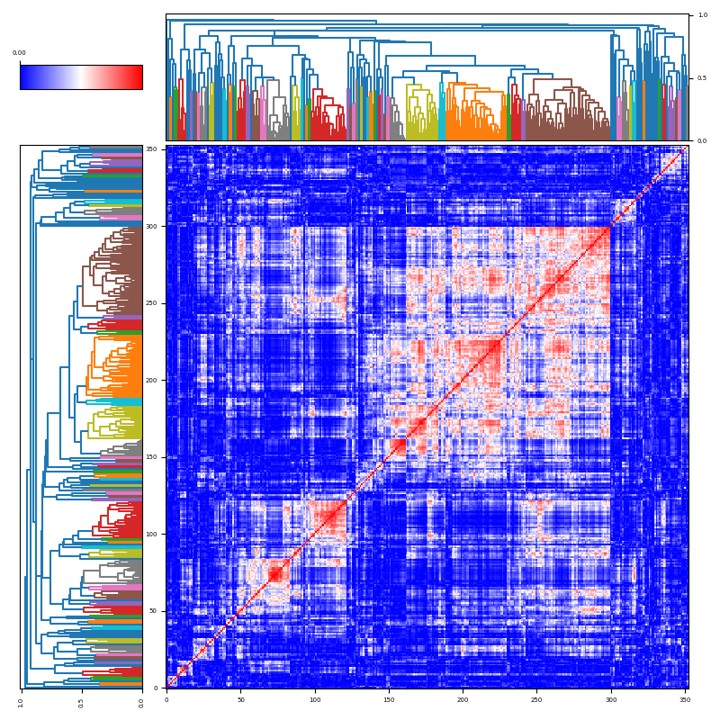
We performed hierarchical agglomerative clustering on the pairwise Pearson correlation (r) between all extracted features from the first baseline scan to identify linearly independent feature subgroups (independence was determined where r2 > 0.5). Next, from each independent sub-group we identified a single candidate feature that had the highest baseline intraclass correlation coefficient (ICC), which was calculated according to the following set of equations:
\begin{aligned}ICC &= \frac{\sigma_{b}^{2}}{\sigma_{b}^{2} + \sigma_{w}^{2}}\\\sigma_{b}^{2} &= \frac{1}{2N}\sum\limits_{i}\left(x_{i1} - x_{i2}\right)^{2}\\\sigma_{w}^{2} &= \frac{1}{N-1}\sum\limits_{i}\left(\overline{x}_{i} - \overline{\overline{x}}\right)^{2}\\\overline{x}_{i} &= \frac{x_{i1} + x_{i2}}{2}\\\overline{\overline{x}} &= \frac{1}{N}\sum\limits_{i}\overline{x}_{i}\end{aligned}
where $$$x_{i1}$$$ and $$$x_{i2}$$$ denote the first and second repeat baseline measurements of feature for patient. Any features where ICC was 0.85 or greater were considered statistically robust.
Results
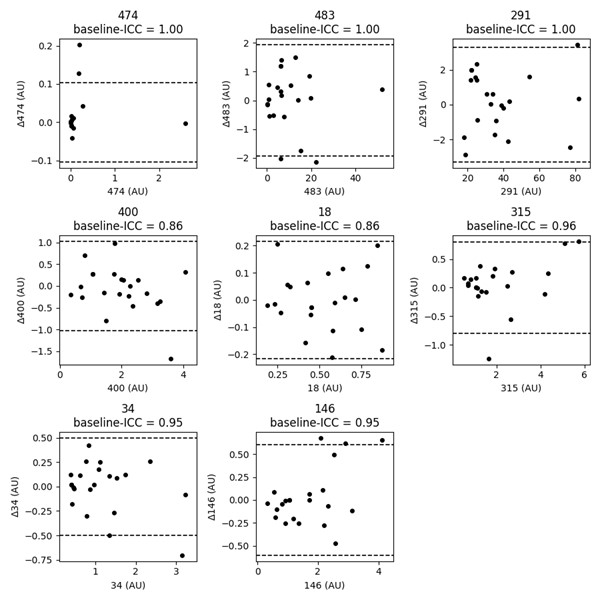
94 independent cluster groups were identified using the hierarchical agglomerative clustering, as illustrated in the pairwise correlation heatmap in Figure 2. A Waterfall plot of the highest ICC value within each cluster group is demonstrated in Figure 3; 81/94 (86.2%) of feature values demonstrated ICC > 0.85. Bland-Altman (BA) plots for 8 of the selected features distributed from ICC = 0.85 to ICC = 1.00 are demonstrated in Figure 4. We observed no systematic bias or significant outliers in these BA plots.Discussion & Conclusion
In this work, we described our approach to feature extraction from ADC maps of retroperitoneal soft-tissue sarcomas using a pre-trained deep learning architecture, namely VGG16. We identified a smaller, linearly independent subset of 81/512 (15.8%) features from the VGG model that also demonstrate good repeatability (ICC > 0.85) from a test-retest baseline experiment. These results agree with a previous study investigating the repeatability of conventional radiomic features in STS, where approximately 19/102 (19%) of features demonstrated linear independence and good repeatability7. We conclude from our preliminary investigation that features derived from a data-driven pre-trained deep-learning model may prove useful for assessing change in diffusion-weighted imaging of STS after radiotherapy. Whether the change in such features proves useful as a clinical response biomarker, either alone or combined with conventional radiomic analysis remains the subject of ongoing research.Acknowledgements
This work was supported by the International Accelerator Award funded by Cancer Research UK [C56167/A29363], Associazione Italiana per la Ricerca sul Cancro [AIRC - 24297] and Fundacion Cient´ıfica – Asociacion Espanola Contra el Cancer [Foundation AECC - GEACC19007MA]. We acknowledge Cancer Research UK and Engineering and Physical Sciences Research Council support to the Cancer Imaging Centre at Institute of Cancer Research and Royal Marsden Hospital in association with Medical Research Council and Department of Health C1060/A10334, C1060/A16464 and National Health Service funding to the National Institute for Health Research Biomedical Research Centre, Clinical Research Facility in Imaging and the Cancer Research Network. ML is a National Institute for Health Research Emeritus Senior Investigator. Also support from The David and Ruth Lewis Family Charitable Trust. This report is independent research funded by the National Institute for Health Research. The views expressed in this publication are those of the author(s) and not necessarily those of the National Health Service, the National Institute for Health Research or the Department of Health.References
1. Aerts, Hugo JWL, et al. "Decoding tumour phenotype by noninvasive imaging using a quantitative radiomics approach." Nature communications 5.1 (2014): 1-9.
2. Winfield, Jessica M., et al. "Utility of multi-parametric quantitative magnetic resonance imaging for characterization and radiotherapy response assessment in soft-tissue sarcomas and correlation with histopathology." Frontiers in oncology 9 (2019): 280.
3. Simonyan, Karen, and Andrew Zisserman. ”Very deep convolutional networks for large-scale image recognition.” arXiv preprint arXiv:1409.1556 (2014).
4. Dara, Suresh, and Priyanka Tumma. ”Feature extraction by using deep learning: a survey.” 2018 Second International Conference on Electronics, Communication and Aerospace Technology (ICECA). IEEE, 2018.
5. Afshar, Parnian, et al. ”From handcrafted to deep-learning-based cancer radiomics: challenges and opportunities.” IEEE Signal Processing Magazine 36.4 (2019): 132- 160.
6. Paszke, Adam et al. ”PyTorch: An Imperative Style, High-Performance Deep Learning Library.” (2019).
7. Thrussell, Imogen, et al. ”Investigating the correlation and repeatability of radiomic features derived from Apparent Diffusion Coefficient maps of Soft-Tissue Sarcoma.” ISMRM Abstract (2019).
Figures