0033
Intraprocedural MRI-based dosimetry during transarterial radioembolization with holmium-166 microspheres: a pilot study1Department of Medical Imaging, Radboud University Medical Center, Nijmegen, Netherlands
Synopsis
Transarterial radioembolization (TARE) is a treatment for liver tumors based on injection of radioactive microspheres in the hepatic arteries under angiography guidance. Conventionally, there is no feedback on the dose distribution during treatment and dosimetry can only be evaluated after treatment. As holmium-166 microspheres used for TARE can be quantified with MRI, we investigated the feasibility and safety of performing TARE in a 3-T MRI in six patients. Multi-echo gradient echo imaging was performed at set time points during administration and provided intraprocedural insight into the microsphere distribution. Our findings may prove useful for providing a personalized approach to TARE.
Introduction
Transarterial radioembolization (TARE) is a treatment modality for liver tumors during which radioactive microspheres are injected into the hepatic arterial system. These microspheres distribute throughout the liver as a result of the blood flow until they are trapped in the arterioles because of their size. Holmium-166 (166Ho) loaded microspheres used for TARE can be visualized and quantified with MRI, as holmium is a paramagnetic metal and locally increases the transverse relaxation rate R2*. Typically, a multi-echo gradient echo (MGRE) sequence is used to estimate R2* in each voxel of the liver volume before and after treatment, and the ΔR2* as a result of holmium depositions is calculated based on these image series1,2. High-resolution, MRI-based dose maps can be derived through several post-processing steps3. In the present study, we investigated the feasibility and safety of performing TARE while the patient is positioned in the MRI-scanner, with the ultimate goal of applying MRI-based intraprocedural dosimetry to personalize TARE and increase treatment efficacy.Methods
Six patients provided written informed consent and were treated with 166Ho TARE in a hybrid operation suite equipped with a 3-T MRI system (MAGNETOM Skyra, Siemens Healthineers, Erlangen, Germany) in the adjacent room. Prior to catheter placement, a breath hold MGRE sequence (TE1: 1.06 ms, TE10: 13.48 ms, TR: 149 ms, flip angle: 33°, in-plane resolution: 2 × 2 mm2, slice thickness: 4 mm) was acquired as a pre-treatment reference. After prior in-house MR safety assessments4, a microcatheter (Progreat, Terumo, Toyko, Japan) was placed under angiography guidance as per usual, after which the patient was transported to the MRI. The unchanged catheter position was verified directly after transport using a T1-weighted FLASH sequence (TE: 3.7 ms, TR: 7.8 ms, flip angle: 10°, in plane resolution: 0.78 × 0.78 mm2, slice thickness: 2 mm). 166Ho microspheres were injected in four fractions per injection position, consisting of 10%, 30%, 30% and 30% of the planned activity per injection position. Directly after each injection, the same MGRE sequence as pre-treatment was acquired for assessment of the holmium microsphere distribution. MRI-based dose maps were calculated from each image series using a dedicated dosimetry package for 166Ho TARE (Q-Suite 2.0, Quirem Medical B.V., Deventer, The Netherlands). Resulting dose maps were evaluated through voxel-based dosimetry.Results
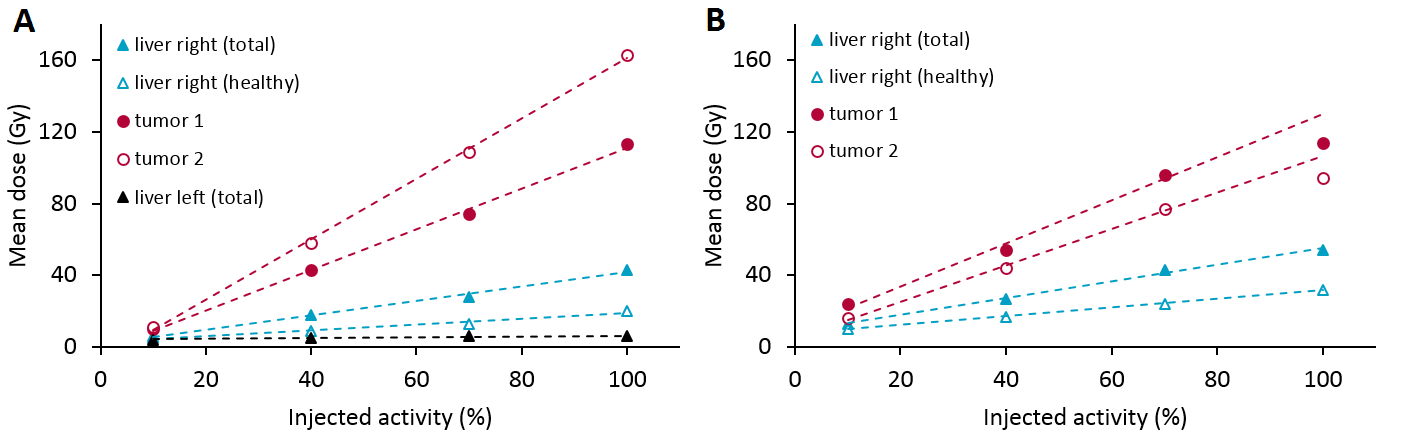
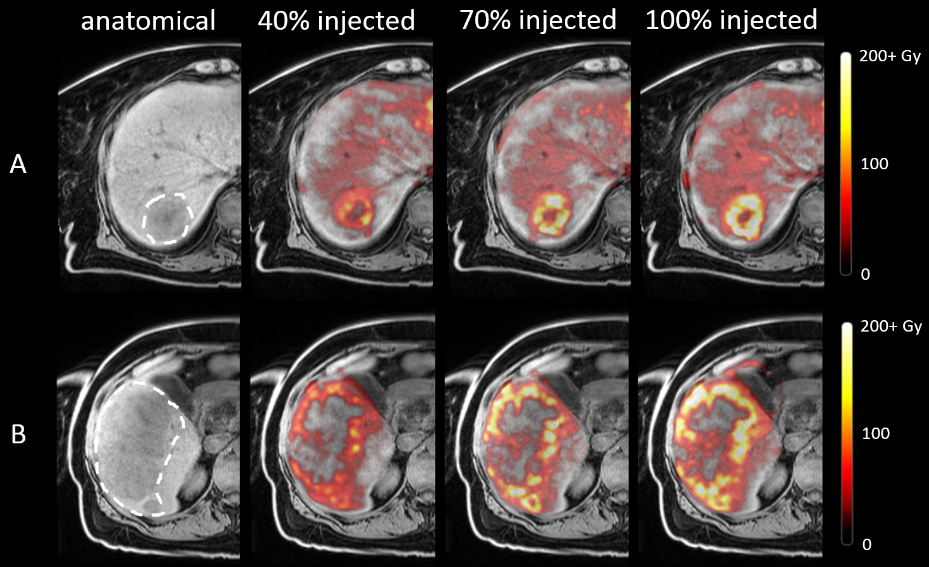
It was feasible to inject holmium microspheres at the MRI scanner in 9 of 11 injection positions (82%). One catheter position was not stable enough for transport towards the MRI-scanner, as the microcatheter repeatedly dislodged from the left hepatic artery into the right hepatic artery. No other (secondary) dislocations were observed. Another catheter position was treated under angiography as the patient was exhausted as a result of procedure length. Acquired MR-images were of sufficient quality for tumor dosimetry in 18 out of 19 tumors treated at the MRI-scanner (95%). In a single tumor close to the diaphragm, dosimetry could not be performed as a result of excessive artefacts in close proximity to the lungs. All six patients were included in the clinical safety analysis. Two CTCAE grade 3-4 toxicities were observed, and no adverse events could be attributed to treatment in the MRI. Tumor uptake patterns were analysed, resulting in two common patterns. The most common uptake pattern (Figure 1A) was a linear increase in mean tumor dose in all four fractions. The second pattern (Figure 1B) was an initial linear increase in mean tumor dose (first three fractions), with the fourth measurement deviating ≥10% from the expected linear trend. Dose distributions within tumors were not vastly different between different fractions, as determined through visual inspection. As illustrated in Figure 2, injection of more microspheres from the same catheter position did result in an increase in mean tumor dose, but generally not in a more complete tumor coverage.Discussion
We have demonstrated the feasibility and initial safety of intraprocedural dosimetry during TARE based on MRI. Previous studies have investigated the added value of MRI-guidance during external beam radiation therapy5 and personalizing activity prescription in TARE6. Our method offers a unique insight in the distribution of microspheres during TARE which may be useful in decision making, for instance on personalizing the injected activity or altering the catheter position if tumor coverage is found to be suboptimal. As we mostly found a linear relation between injected activity and mean tumor dose, it is expected that tumors tended not to be saturated with microspheres and subsequently, increasing the injected activity could lead to an increased mean tumor dose.Conclusion
Intraprocedural, MRI-based dosimetry is feasible and provides a unique insight in the microsphere distribution during TARE. This proof of concept yields possibilities to better understand microsphere dynamics during TARE and its use in personalizing TARE could potentially increase treatment efficacy.Acknowledgements
No acknowledgement found.References
1. van de Maat GH, Seevinck PR, Bos C, Bakker CJ. Quantification of holmium-166 loaded microspheres: estimating high local concentrations using a conventional multiple gradient echo sequence with S(0)-fitting. J Magn Reson Imaging 2012;35(6):1453-1461.
2. van de Maat GH, Seevinck PR, Elschot M, Smits ML, de Leeuw H, van Het Schip AD, Vente MA, Zonnenberg BA, de Jong HW, Lam MG, Viergever MA, van den Bosch MA, Nijsen JF, Bakker CJ. MRI-based biodistribution assessment of holmium-166 poly(L-lactic acid) microspheres after radioembolisation. Eur Radiol 2013;23(3):827-835.
3. Smits ML, Elschot M, van den Bosch MA, van de Maat GH, van het Schip AD, Zonnenberg BA, Seevinck PR, Verkooijen HM, Bakker CJ, de Jong HW, Lam MG, Nijsen JF. In vivo dosimetry based on SPECT and MR imaging of 166Ho-microspheres for treatment of liver malignancies. J Nucl Med 2013;54(12):2093-2100.
4. Roosen J, Arntz MJ, Janssen MJR, de Jong SF, Fütterer JJ, Overduin CG, Nijsen JFW. Development of an MRI-Guided Approach to Selective Internal Radiation Therapy Using Holmium-166 Microspheres. Cancers 2021;13(21):5462.
5. Witt JS, Rosenberg SA, Bassetti MF. MRI-guided adaptive radiotherapy for liver tumors: visualising the future. Lancet Oncol 2020;21(2):e74-e82.
6. Garin E, Tselikas L, Guiu B, Chalaye J, Edeline J, de Baere T, Assenat E, Tacher V, Robert C, Terroir-Cassou-Mounat M, Mariano-Goulart D, Amaddeo G, Palard X, Hollebecque A, Kafrouni M, Regnault H, Boudjema K, Grimaldi S, Fourcade M, Kobeiter H, Vibert E, Le Sourd S, Piron L, Sommacale D, Laffont S, Campillo-Gimenez B, Rolland Y, Group D-S. Personalised versus standard dosimetry approach of selective internal radiation therapy in patients with locally advanced hepatocellular carcinoma (DOSISPHERE-01): a randomised, multicentre, open-label phase 2 trial. Lancet Gastroenterol Hepatol 2020.
Figures