0031
In vivo measurement of bile metabolite concentrations at 3T by 1H STEAM MRS – breathing triggered navigation vs breath-hold acquisition.1High-Field MR Centre, Department of Biomedical Imaging and Image-Guided Therapy, Medical University of Vienna, Vienna, Austria, 2Department of Internal Medicine III, Medical University of Vienna, Vienna, Austria, 3High-Field MR Center, Center for Medical Physics and Biomedical Engineering, Medical University of Vienna, Vienna, Austria, 4CD laboratory for Clinical Molecular MR imaging (MOLIMA), Vienna, Austria, 5Institute for Clinical Molecular MRI in the Musculoskeletal System, Karl Landsteiner Society, St. Pölten, Austria
Synopsis
Detection of metabolites from human gallbladder poses some challenges due to its size and position. We compared breath-hold and respiratory triggered acquisition by 1H SVS STEAM sequence on patients in supine position at 3T. 14 peaks of bile components were detected using both acquisition setups. Quantification of metabolite concentrations, corrected with measured T2app relaxation times, showed results within the range of previously published data. STEAM sequence proved to be feasible for measurement of bile components at 3T in vivo, providing sufficient spectral quality for metabolite quantification in supine position with comparable results in both breath-hold and PACE navigated acquisition.
Introduction
Bile components of human gallbladder were detected previously at 3T by 1H MRS PRESS sequence with TE of 30-35ms1,2. As size and position of the gallbladder pose some measurement challenges, optimization of the protocol was suggested regarding patient position (supine vs prone) and respiratory gating or free breathing1,2,3. STEAM sequence provides shorter TE, resulting in less signal decay and larger range of possible TEs for T2 estimation. In this study, we measured and quantified biliary components in vivo by 1H MRS STEAM in supine position and compared breath-hold with respiratory triggered acquisition. Apparent T2 relaxation times (T2app) by STEAM were also measured on healthy volunteersMethods
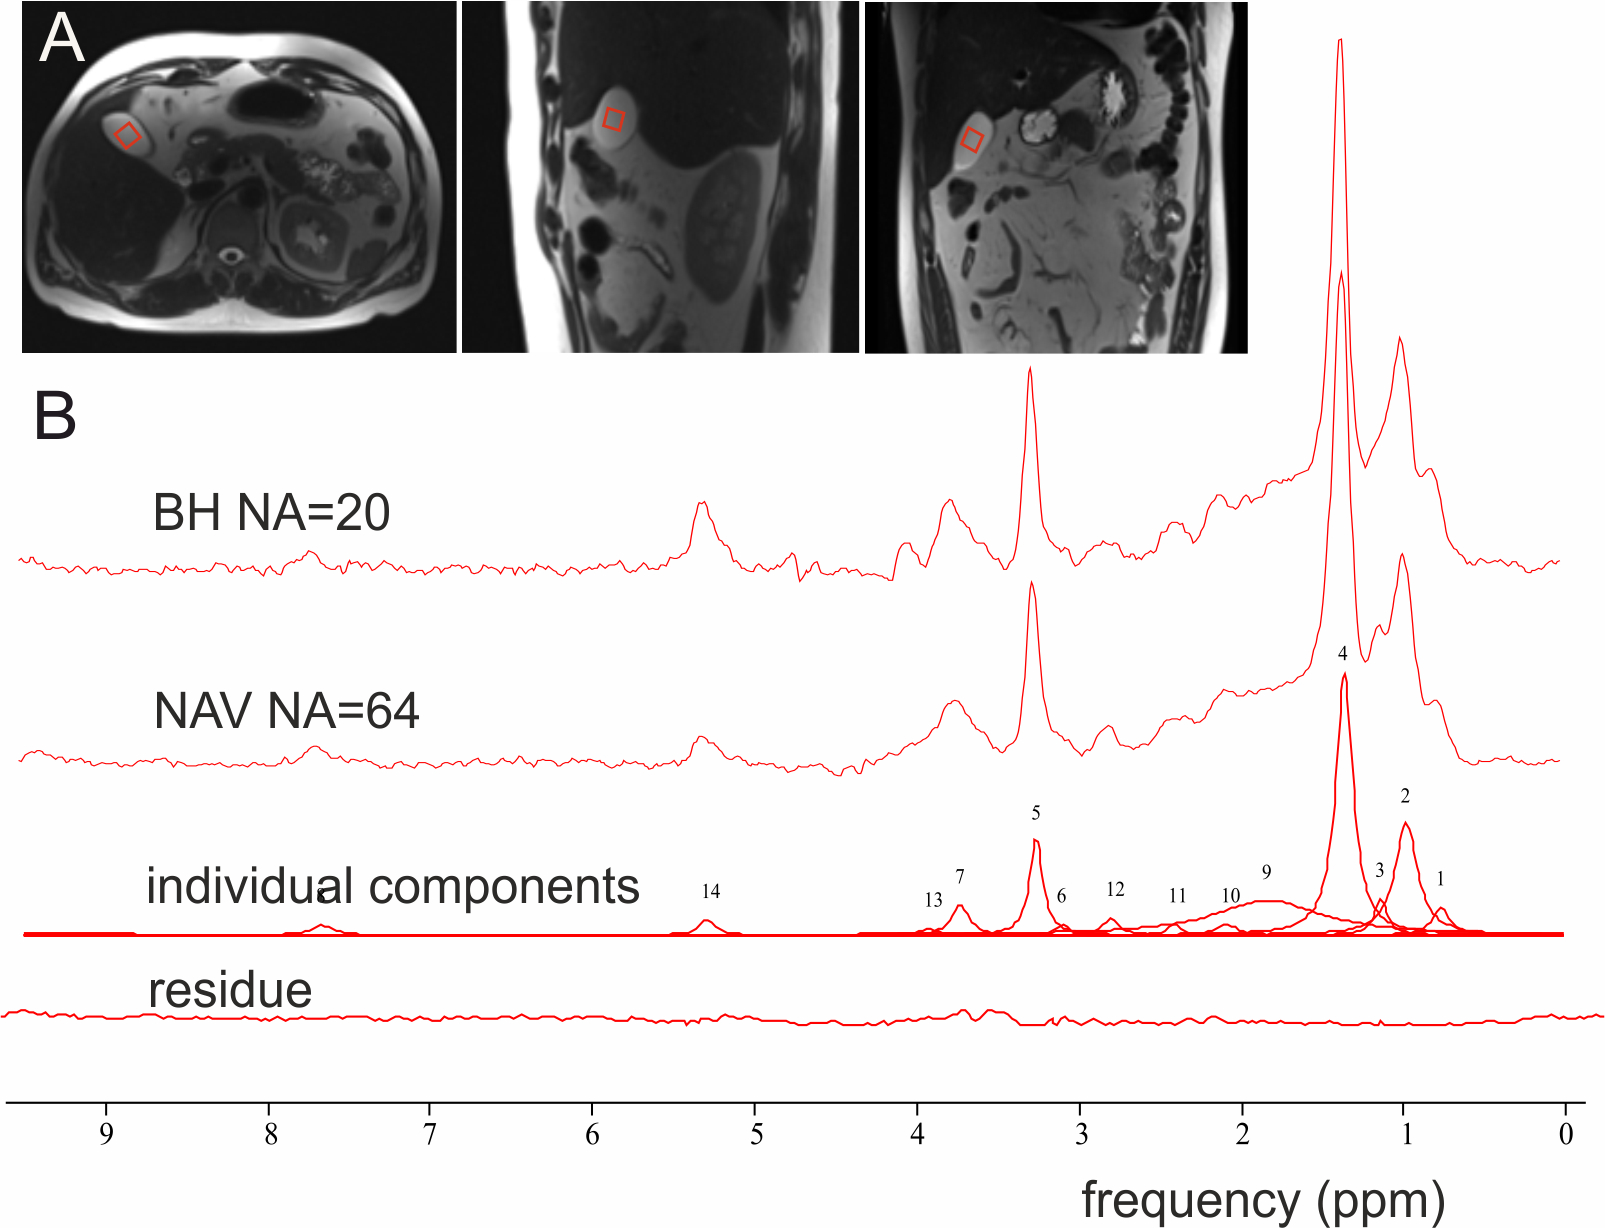
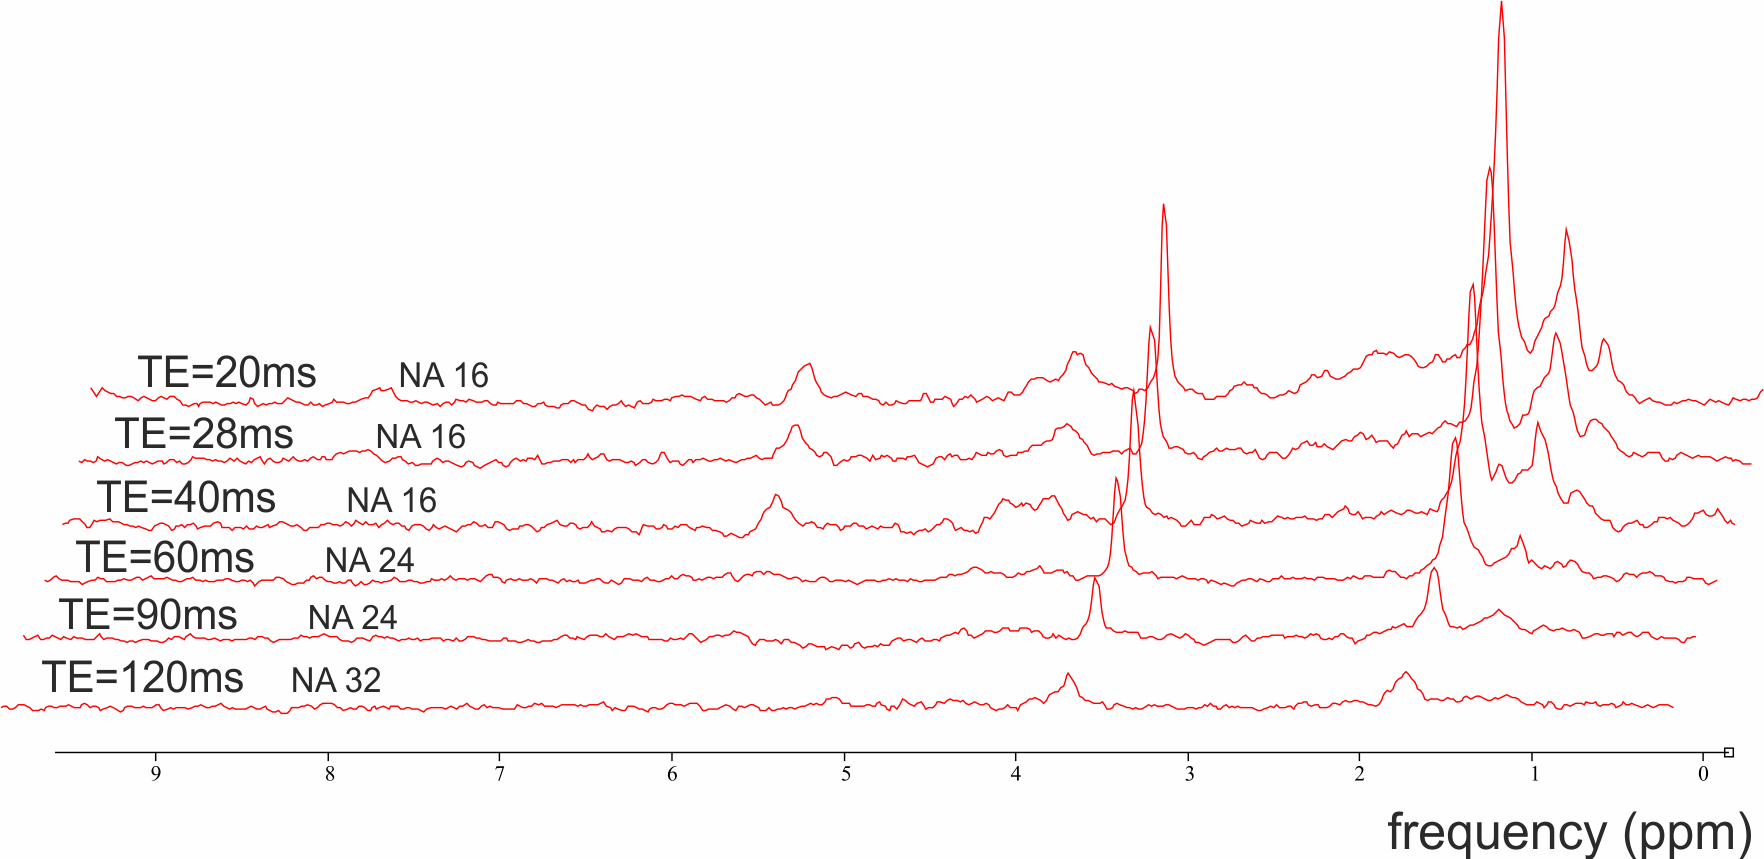
All subjects were measured in supine position at 3T Prisma Fit scanner (Siemens) after overnight fasting using combination of spine and body flex coil for signal reception. 14 patients (7 males and 7 females) with increased LDL cholesterol levels >130 mg/dl, mean age 57 ± 6.43 years and BMI of 26.15 ± 1.91 kgm-2 participated in this pilot study. MRS voxel (10x10x10mm) was placed into gallbladder using three orthogonal planes acquired by HASTE sequence (Fig.1). STEAM sequence with TE = 20 ms, TM = 10 ms, TR = 4 s and water suppression was used. In breath-hold setup (BH), 4 individual transients were acquired during one breath-hold, repeated 4 or 5 times, resulting in 16-20 individual spectra. Additional water unsuppressed spectrum with the same parameters was acquired. Afterwards, STEAM with PACE navigator was applied (NAV), with the same measurement parameters, detecting 64 individual transients, followed by 8 scans of water. Whole protocol took approximately 30 minutes. Additionally, 6 healthy volunteers (3 f & 3 m, mean age 33.7 years and BMI 23.4 kgm-2) were measured using the same setup for the estimation of T2app relaxation times (TEs of 20, 28, 40, 60, 90 and 120 ms, with 16, 24 or 32 averages for sufficient SNR) with acquisition during separate breath-holds. All spectra were post-processed in jMRUI, individual transients were frequency aligned and phased. Transients with linewidth of Chol_PL at 3.24 ppm bigger than 25 Hz, spectra with visceral or hepatic lipids contamination were discarded. Remaining spectra were averaged and 14 metabolic signals were fitted in AMARES with prior knowledge based on literature1. Concentrations of nine metabolites in mM were calculated1,2,3 using T2app correction based on the results of our measurements (fitted by monoexponentional two-parameter function in MATLAB). For water signal, T2 value of 172 ms was used2. Concentrations of metabolites were calculated also from 6 healthy volunteers participating in T2app measurements part of the study. Depending on the normality distribution, paired T-tests or Wilcoxon signed rank tests were applied to test the differences between two acquisition methods in SPSS. Within subject coefficient of variation was calculated to compare NAV and BH spectra.Results
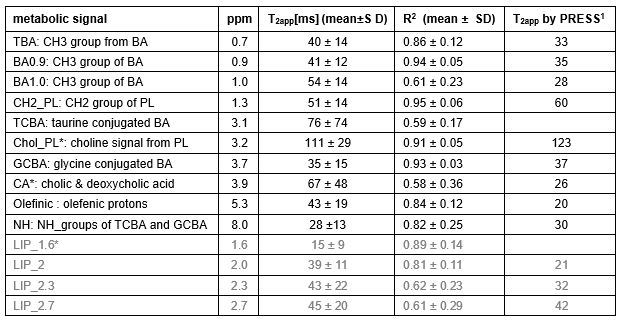
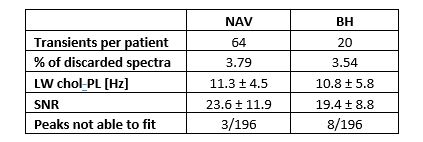
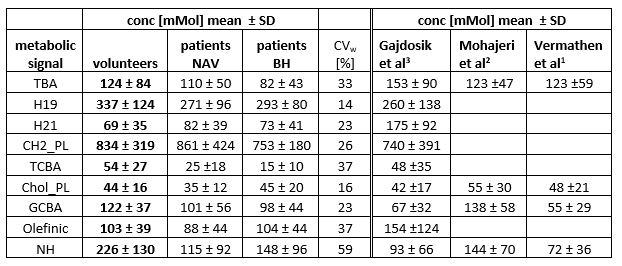
T2 relaxation times and concentrations. All T2app relaxation curves except from 2 from one volunteer could be fitted. We were able to detect and quantify 14 peaks in gallbladder spectrum (Fig.1). TE evolution of the spectra from one volunteer is displayed in Fig.2. Means of T2app relaxation times of all detected components of bile are listed in Table 1. Navigated (NAV) vs breath-hold (BH) acquisition. Due to contamination or low quality of individual transients we have discarded 3.79% spectra in NAV and 3.54% spectra in BH. Linewidth of the chol_PL peak of averaged spectra was 11.31 ± 4.49 Hz in NAV and 10.83 ± 4.96 Hz in BH. Details of quality checks are listed in Table 2. Statistical analysis of metabolite concentration showed no significant differences between NAV and BH acquisitions. Within subject coefficient of variation (CVw) ranged from 14% to 59%, depending on the signal of interest. Values of CVw together with concentrations of metabolites measured in patients as well as those from healthy volunteers and literature can be found in Table 3.Conclusion
STEAM sequence is feasible for measurement of bile in gallbladder at 3T in vivo, providing sufficient spectral quality allowing quantification of more than 9 components. Supine position is acceptable for both breath-hold and PACE navigated acquisition with free breathing with comparable results and within clinically acceptable measurement times.Acknowledgements
I would like to thank Veronika Janacova for valuable advices on statistical analysis.This study was supported by the Austrian Science Fund, KLI917.
References
1. Vermathen P, Diserens G, Kröll D et al. Determination of bile acids from human gallbladder by 1H-MRS – Protocol optimization and estimation of reproducibility. NMR in Biomedicine. 2019; 34:e4432.
2. Mohajeri S, Bezabeh T, Ijra OM et al. In Vivo 1H MRS of human gallbladder bile in understanding the pathophysiology of primary sclerosing cholangitis (PSC): immune – mediated disease versus bile acid-inudced injury. NMR in Biomedicine. 2018; 32:e4065.
3. Gajdosik M, Chmelik M, Halibasic E et al. In Vivo 1H MR Spectroscopy of Biliary Components of Human Gallbladder at 7T. J Magn Reson Imaging. 2020; 53:98-107.
Figures