0030
Confounder-Corrected T1 mapping in the Liver through Simultaneous Estimation of T1, PDFF, R2* and B1
Nathan Tibbitts Roberts1,2, Daiki Tamada, PhD1, Yavuz Muslu1,3, Diego Hernando, PhD1,3,4,5, and Scott B Reeder, MD, PhD1,3,4,6,7
1Radiology, University of Wisconsin - Madison, Madison, WI, United States, 2Electrical Engineering, University of Wisconsin - Madison, Madison, WI, United States, 3Medical Physics, University of Wisconsin - Madison, Madison, WI, United States, 4Biomedical Engineering, University of Wisconsin - Madison, Madison, WI, United States, 5Electrical and Computer Engineering, University of Wisconsin - Madison, Madison, WI, United States, 6Medicine, University of Wisconsin - Madison, Madison, WI, United States, 7Emergency Medicine, University of Wisconsin - Madison, Madison, WI, United States
1Radiology, University of Wisconsin - Madison, Madison, WI, United States, 2Electrical Engineering, University of Wisconsin - Madison, Madison, WI, United States, 3Medical Physics, University of Wisconsin - Madison, Madison, WI, United States, 4Biomedical Engineering, University of Wisconsin - Madison, Madison, WI, United States, 5Electrical and Computer Engineering, University of Wisconsin - Madison, Madison, WI, United States, 6Medicine, University of Wisconsin - Madison, Madison, WI, United States, 7Emergency Medicine, University of Wisconsin - Madison, Madison, WI, United States
Synopsis
T1 is emerging as a quantitative MR biomarker of liver fibrosis, the most important histological change predictive of progressing chronic liver disease. 3D spoiled gradient echo (SGRE)-based T1 mapping is preferable in the abdomen for its short acquisition time, volumetric coverage, and robustness to motion. However, SGRE-based T1 mapping is confounded by tissue fat and B1 inhomogeneity. In this work we present a novel SGRE-based T1 mapping method that corrects for both fat and B1 inhomogeneity. Phantom experiments show excellent agreement with reference T1 values (slope=1.01, R2=1.00) and minimal bias (~5±23ms). Early results from 5 healthy volunteers are promising.
Introduction
T1 is emerging as a quantitative biomarker of liver fibrosis1,2. Fibrosis is the histological change most predictive of chronic liver disease progression to cirrhosis and primary liver cancer3. Early detection and quantitative staging of liver fibrosis would allow for targeted interventions.T1 mapping using variable flip angle (VFA) spoiled gradient echo (SGRE) acquisitions is commonly used for applications where short acquisition times, volumetric coverage, and motion robustness are important4,5. However, VFA methods are confounded by fat and B1 inhomogeneities6. The effects of fat can be addressed through chemical-shift-encoded MRI (CSE-MRI)7,8; however, standard B1-correction requires separate B1-calibration9. The additional calibration increases scan time, risks inter-acquisition patient motion, and requires post-acquisition image registration. Therefore, the purpose of this work is to present a novel SGRE-based method for simultaneous B1- and fat-corrected T1 mapping for volumetric evaluation of the entire liver in a single breath-hold.
Theory
A previously presented B1 mapping method10 uses two consecutive non-selective RF pulses of equal magnitude, but orthogonal phase, to encode the transmitted flip angle into the phase of the MR signal. Our acquisition adapts this method for slab-selection using bipolar slab-select gradients and time-reversed RF waveforms, and combines it with multi-echo CSE-MRI and multi-pass VFA5 to jointly estimate PDFF, R2*, B1, and T1 in a single breath-hold (Figure 1).The signal model for the proposed acquisition was derived using Bloch equation simulations in MATLAB assuming instantaneous RF excitation, perfect spoiling of transverse magnetization at the end of each TR, and a 6-peak spectral model of fat11,12. In passes 2 and 3, an optimal RF spoiling increment13 was chosen as $$$116^{\circ}$$$ (Figure 2A).
After initialization with a graph-cut algorithm15, parameter estimations were performed by nonlinear least-squares14:\begin{equation}\pmb{\widehat{\theta}}=\text{arg}\min\limits_{\pmb{\theta}}\,[\sum_{p=1}^{3}\sum_{n=1}^{N_p}|s_{p,n}(\pmb{\theta})-s_{meas,p,n}|^2]\\for\,\pmb{\theta}=\{\beta_W,\beta_F,T1_W,T1_F,M_0,\phi_1,\phi_{2,W},\phi_{2,F},PDFF,R_{2,W}^*,R_{2,F}^*,\psi\}\tag{1}\end{equation}where $$$s_{p,n}$$$ is the derived signal and $$$s_{meas,p,n}$$$ is the acquired/measured signal. In this notation, $$$p$$$ is the pass index, $$$n$$$ the echo index, and $$$N_p$$$ the number of echoes acquired in pass $$$p$$$. Unknown parameters ($$$\pmb{\theta}$$$) include B1 transmission efficiency ($$$\beta$$$), T1, signal amplitude ($$$M_0$$$), an initial phase in pass 1 ($$$\phi_1$$$), an initial phase common between passes 2 and 3 ($$$\phi_{2}$$$), PDFF, R2*, and B0 off-resonance ($$$\psi$$$). Subscripts W/F denote that the term is modeled and estimated independently for water/fat, respectively (Figure 2B).
Methods
We evaluated the proposed method at 1.5T (Signa Artist, GE Healthcare). Two protocols were used in this study (Figure 1). Protocol 1 was designed for phantom experiments performed without parallel imaging acceleration. Protocol 2 was designed for in vivo liver imaging, with total scan time reduced to a 19-second breath-hold using parallel imaging acceleration and partial Fourier acquisition.Phantom Experiments
An agar gel phantom was fabricated using peanut oil and NiCl2⁻ to modulate PDFF and T1W, respectively. The 15-vial phantom consisted of 3 sets (PDFF=0,10,20%) of 5 vials (T1W=200,400,600,800,1000ms). 2D spin-echo inversion-recovery (IR-SE) data (TR=4000ms,TI=50,103,212,436,897,1846,3800ms) were acquired to determine reference T1 values.
Bias and precision were determined with linear regression and Bland-Altman analysis from independent repeated measurements in the constructed phantom. Protocol 1 was acquired 40 times, Protocol 2 was acquired 10 times, and a product 2D single-slice T1 mapping application (SMART1MAP, GE Healthcare) was acquired 10 times.
In Vivo Evaluations
The proposed method was tested in 5 healthy volunteers using Protocol 2. SMART1MAP was acquired as an in vivo reference for T1 and multi-TE-TR MR Spectroscopy (STEAM)16 was acquired as a reference for PDFF.
Results
Phantom ExperimentsThe proposed T1W shows excellent agreement with the IR-SE T1W reference (slope=1.01, R2=1.00, RMSE=22ms) with an average bias of -5.2±23ms using Protocol 1 in the agar gel phantom (Figure 3B). In a comparison of in vivo protocols in phantom data, Protocol 2 exhibited improved repeatability with an 11.2% reduction in coefficient of variation (CV) compared to SMART1MAP (Figure 4).
In Vivo Evaluations
Figure 5 shows that T1W maps in 5 healthy volunteers showed good agreement with the vendor provided SMART1MAP. Measured PDFF was in close agreement with MRS-STEAM results.
Discussion
In this work we have presented a novel method for simultaneous B1- and fat-corrected T1W estimation that can provide full liver coverage in a single breath-hold. Accuracy was demonstrated in phantoms and in vivo feasibility in healthy volunteers.Currently, this method has only been evaluated at 1.5T. While B1 inhomogeneity is a confounder at 1.5T, the magnitude of B1 errors increases with field strength17. Future work is needed to optimize the method for 3.0T acquisitions.
B1 inhomogeneity and fat are known confounders of T1 estimation. Our proposed method accounts for both confounders through simultaneous estimation of T1, B1, PDFF and R2*. The proposed method demonstrates good linear agreement with reference T1 measurements, with both low bias and high precision, and can achieve full-volume liver coverage in a single breath-hold.
Acknowledgements
We wish to acknowledge support from the NIH (R01 DK088925, UL1TR002373), UW Department of Radiology, UW Institute for Clinical and Translational Research, and the Clinical and Translational Science Award of the NCATS/NIH. Further, we wish to acknowledge GE Healthcare who provides research support to the University of Wisconsin. Finally, Dr. Reeder is a Romnes Faculty Fellow, and has received an award provided by the University of Wisconsin-Madison Office of the Vice Chancellor for Research and Graduate Education with funding from the Wisconsin Alumni Research Foundation.References
1. Banerjee R, Pavlides M, Tunnicliffe EM, et al. Multiparametric magnetic resonance for the non-invasive diagnosis of liver disease. Journal of hepatology 2014;60:69–77 doi: 10.1016/j.jhep.2013.09.002.2. Haaf P, Garg P, Messroghli DR, Broadbent DA, Greenwood JP, Plein S. Cardiac T1 Mapping and Extracellular Volume (ECV) in clinical practice: a comprehensive review. Journal of Cardiovascular Magnetic Resonance 2016;18:89 doi: 10.1186/s12968-016-0308-4.
3. Ginès P, Graupera I, Lammert F, et al. Screening for liver fibrosis in the general population: a call for action. The Lancet Gastroenterology & Hepatology 2016;1:256–260 doi: 10.1016/S2468-1253(16)30081-4.
4. Brookes JA, Redpath TW, Gilbert FJ, Murray AD, Staff RT. Accuracy of T1 measurement in dynamic contrast-enhanced breast MRI using two- and three-dimensional variable flip angle fast low-angle shot. Journal of Magnetic Resonance Imaging 1999;9:163–171 doi: 10.1002/(SICI)1522-2586(199902)9:2<163::AID-JMRI3>3.0.CO;2-L.
5. Deoni SC, Rutt BK, Peters TM. Rapid combined T1 and T2 mapping using gradient recalled acquisition in the steady state. Magn Reson Med 2003;49:515–26 doi: 10.1002/mrm.10407.
6. Deoni SC. Correction of main and transmit magnetic field (B0 and B1) inhomogeneity effects in multicomponent-driven equilibrium single-pulse observation of T1 and T2. Magn Reson Med 2011;65:1021–35 doi: 10.1002/mrm.22685.
7. Liu CY, McKenzie CA, Yu H, Brittain JH, Reeder SB. Fat quantification with IDEAL gradient echo imaging: correction of bias from T(1) and noise. Magn Reson Med 2007;58:354–64 doi: 10.1002/mrm.21301.
8. Wang X, Hernando D, Wiens C, Reeder S. Fast T1 Correction for Fat Quantification Using a Dual-TR Chemical Shift Encoded MRI Acquisition. In: ; 2017.
9. Cheng H-LM, Wright GA. Rapid high-resolution T1 mapping by variable flip angles: Accurate and precise measurements in the presence of radiofrequency field inhomogeneity. Magnetic Resonance in Medicine 2006;55:566–574 doi: 10.1002/mrm.20791.
10. Chang YV. Rapid B1 mapping using orthogonal, equal-amplitude radio-frequency pulses. Magn Reson Med 2012;67:718–723 doi: 10.1002/mrm.23051.
11. Hamilton G, Yokoo T, Bydder M, et al. In vivo characterization of the liver fat (1)H MR spectrum. NMR Biomed 2011;24:784–90 doi: 10.1002/nbm.1622.
12. Yu H, Shimakawa A, McKenzie CA, Brodsky E, Brittain JH, Reeder SB. Multiecho water-fat separation and simultaneous R2* estimation with multifrequency fat spectrum modeling. Magn Reson Med 2008;60:1122–34 doi: 10.1002/mrm.21737.
13. Crawley AP, Wood ML, Henkelman RM. Elimination of transverse coherences in FLASH MRI. Magnetic Resonance in Medicine 1988;8:248–60.
14. Johnson SG. The NLopt nonlinear-optimization package.
15. Hernando D, Kellman P, Haldar JP, Liang Z-P. Robust water/fat separation in the presence of large field inhomogeneities using a graph cut algorithm. Magnetic Resonance in Medicine 2010;63:79–90 doi: https://doi.org/10.1002/mrm.22177.
16. Hamilton G, Middleton MS, Hooker JC, et al. In vivo breath-hold (1) H MRS simultaneous estimation of liver proton density fat fraction, and T1 and T2 of water and fat, with a multi-TR, multi-TE sequence. J Magn Reson Imaging 2015;42:1538–43 doi: 10.1002/jmri.24946.
17. Roberts NT, Hinshaw LA, Colgan TJ, Ii T, Hernando D, Reeder SB. B0 and B1 inhomogeneities in the liver at 1.5 T and 3.0 T. Magnetic Resonance in Medicine 2021;85:2212–2220 doi: https://doi.org/10.1002/mrm.28549.
Figures
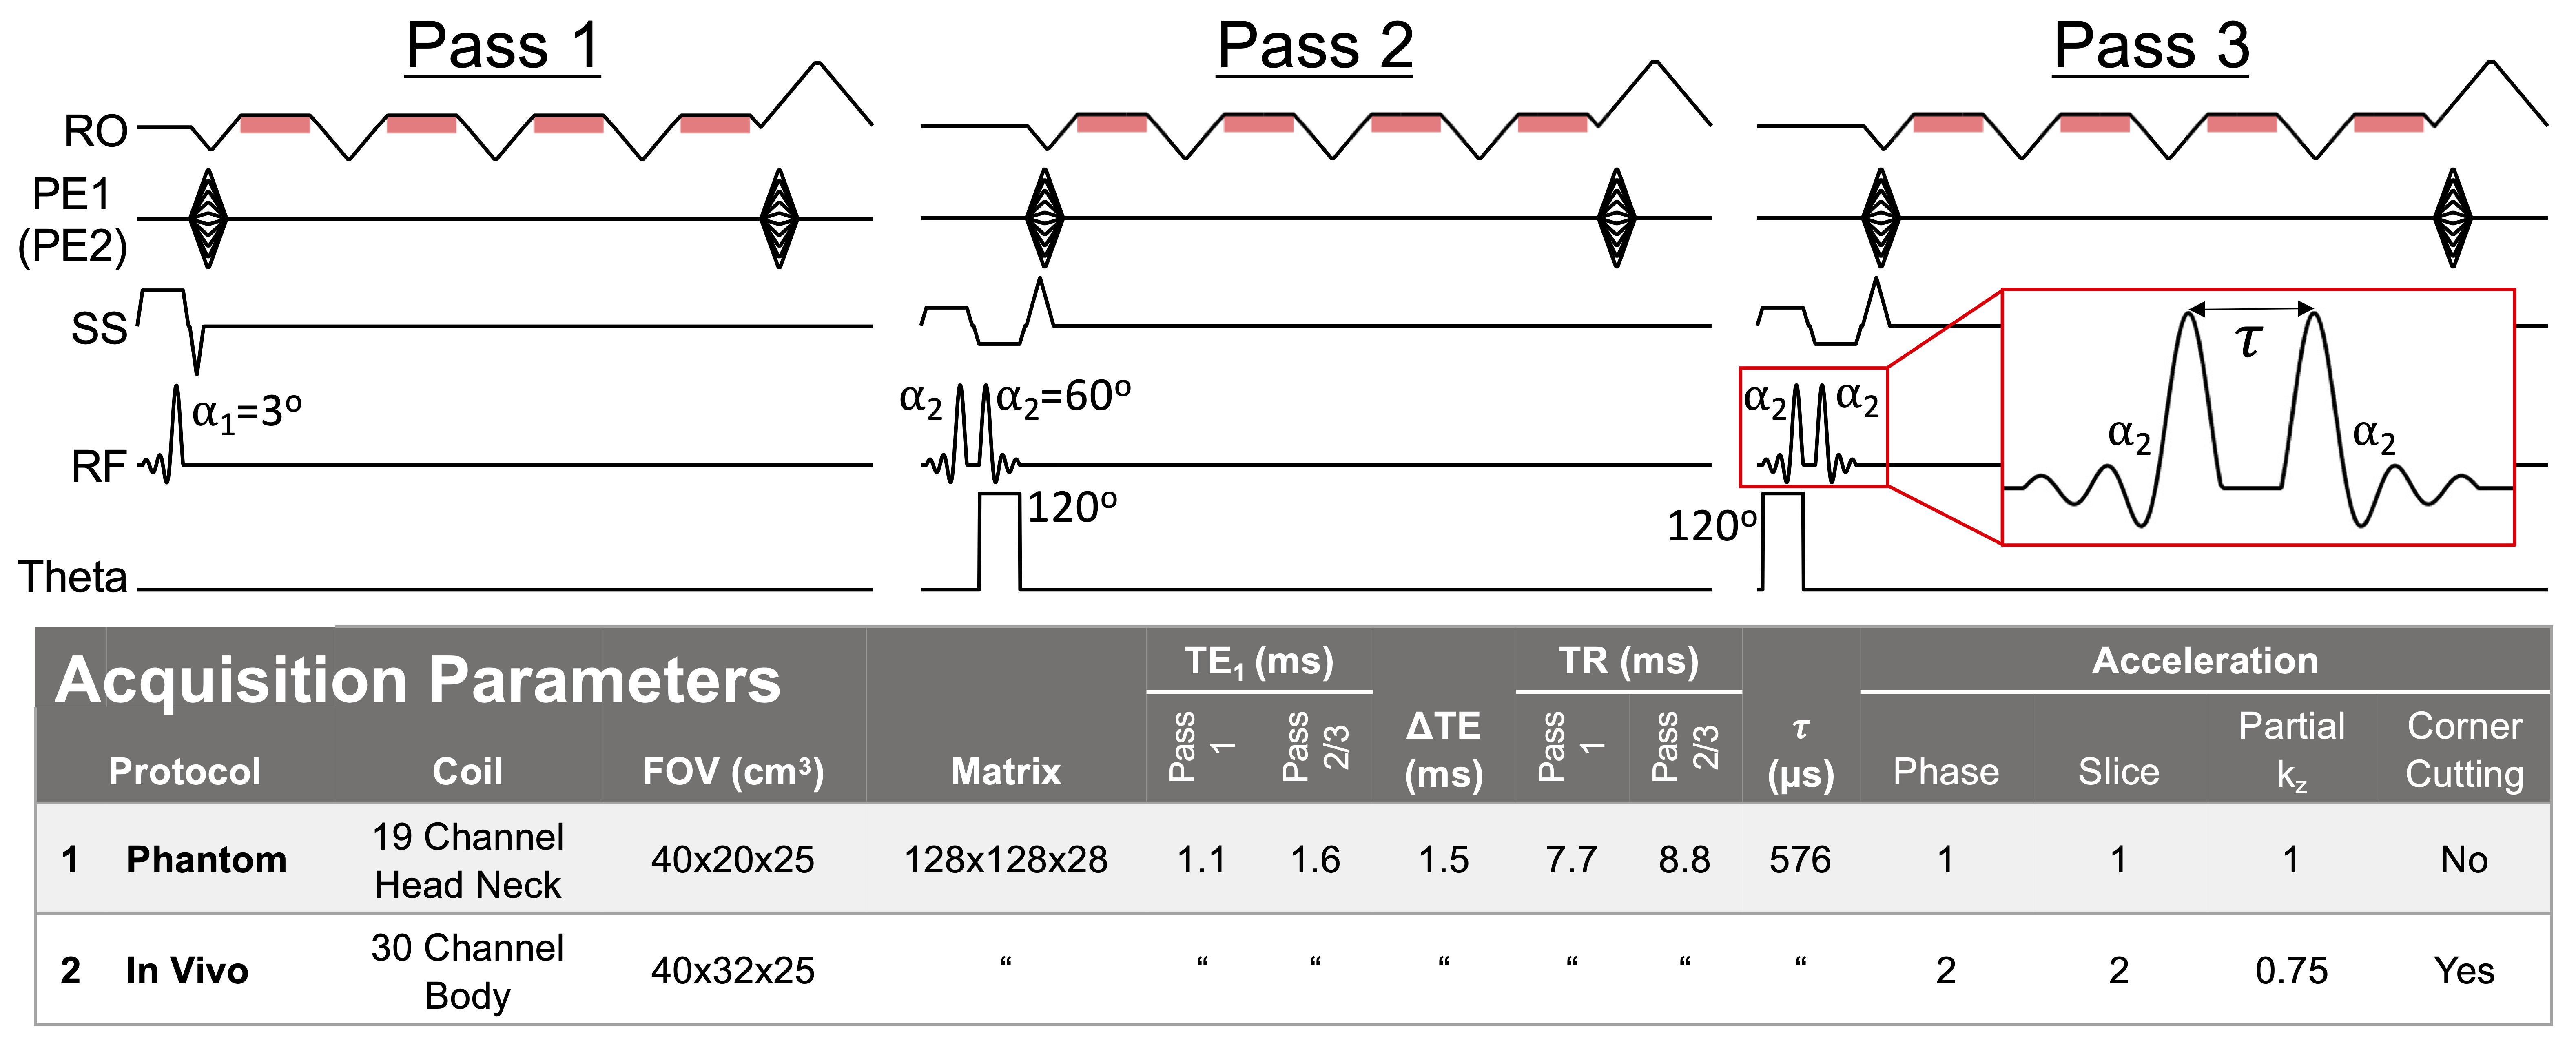
Figure 1. The proposed method acquires data in three passes. Pass 1 is a standard multi-echo SGRE acquisition that acquires data after a single slab-selective excitation. Passes 2 and 3 are modified SGRE acquisitions that employ a composite excitation to allow phase-based B1 estimation. The schematic displays the readout, phase encode, slab select, RF, and excitation phase (theta) boards of the proposed pulse sequence. Cramér-Rao lower bound analysis (excluded for brevity) showed that a $$$120^\circ$$$ phase difference between consecutive RF pulses improved noise performance.
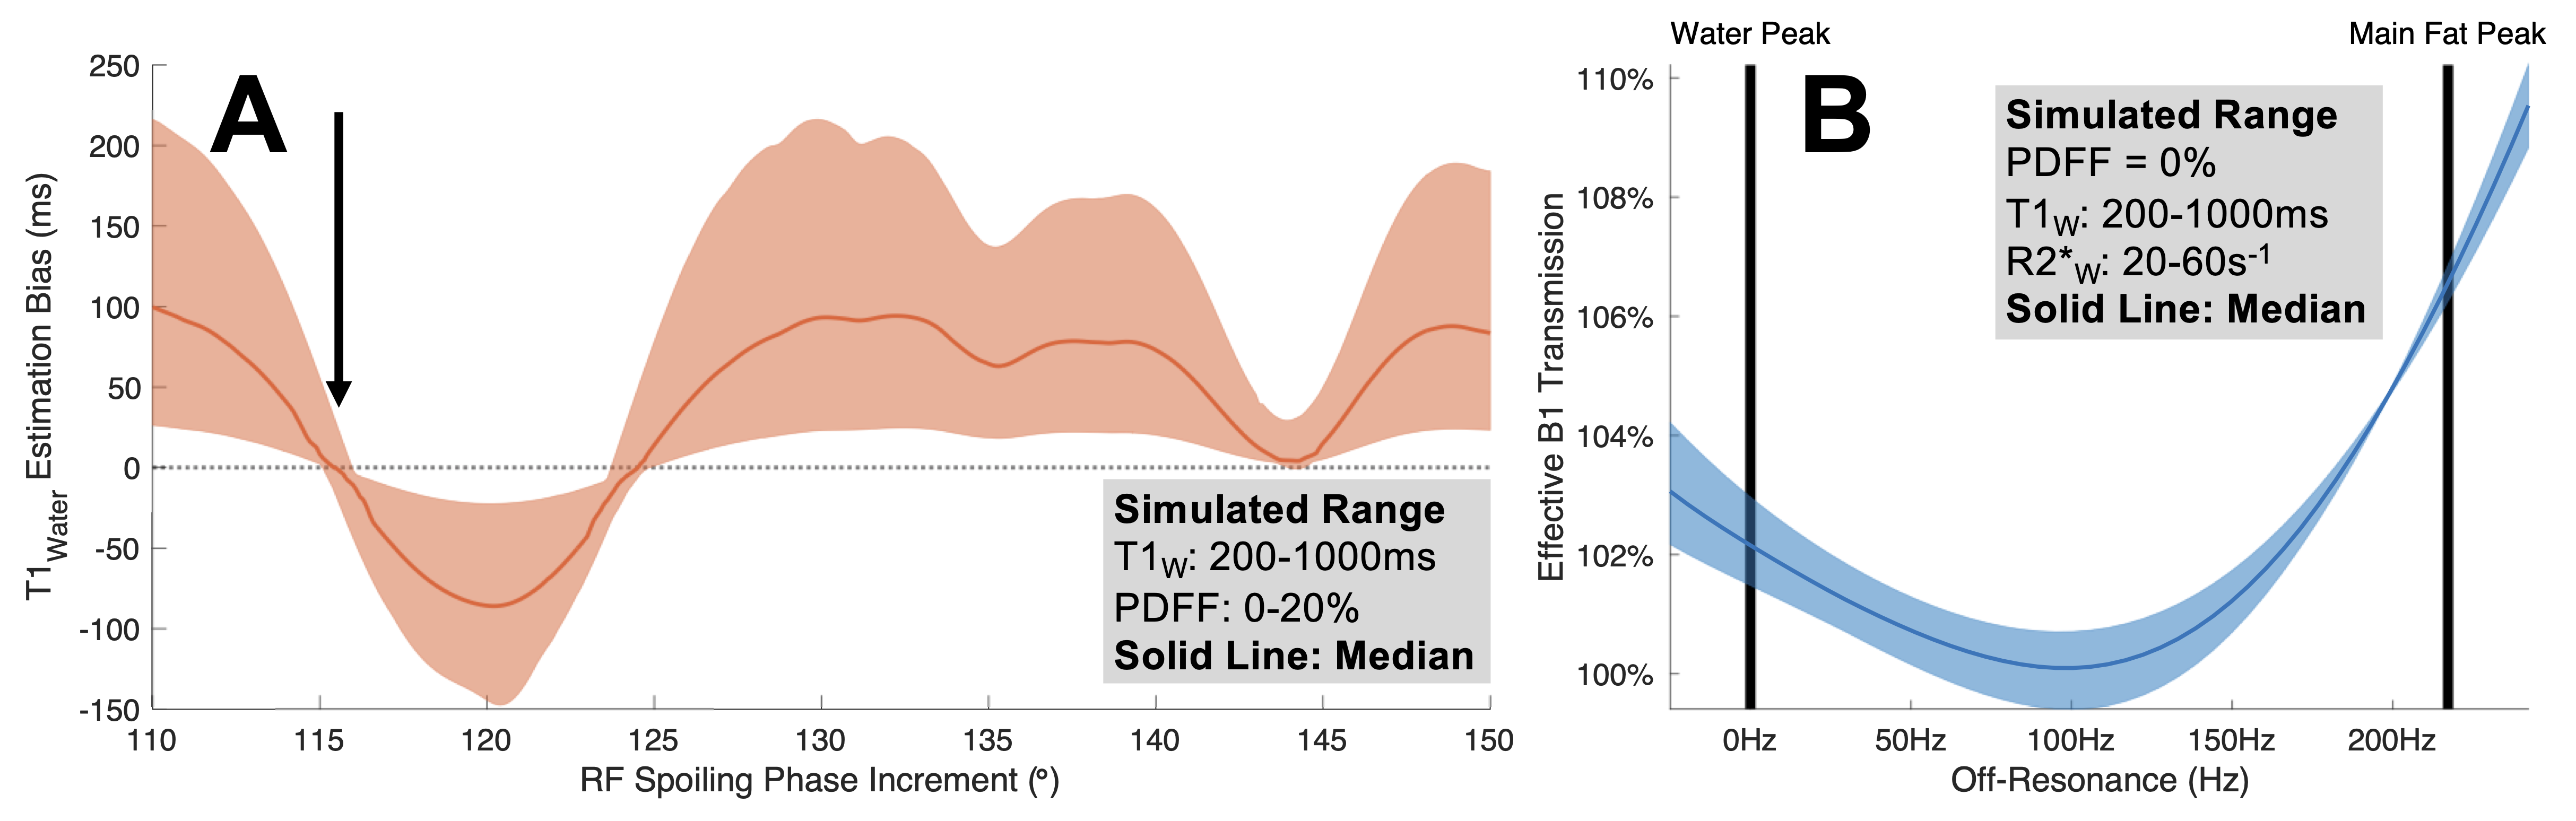
Figure 2. (A) $$$116^\circ$$$ is an optimal RF spoiling phase increment for passes 2&3. The figure shows simulated T1W estimation bias over a range of RF spoiling phase increments. (B) Simulations showing effective B1 transmission as a function of off-resonance for non-instantaneous RF excitation suggest that B1 of fat and water should be modeled separately. Although instantaneous excitation is assumed when deriving the SGRE signal model, in practice off-resonance during RF excitation affects B1 transmission.
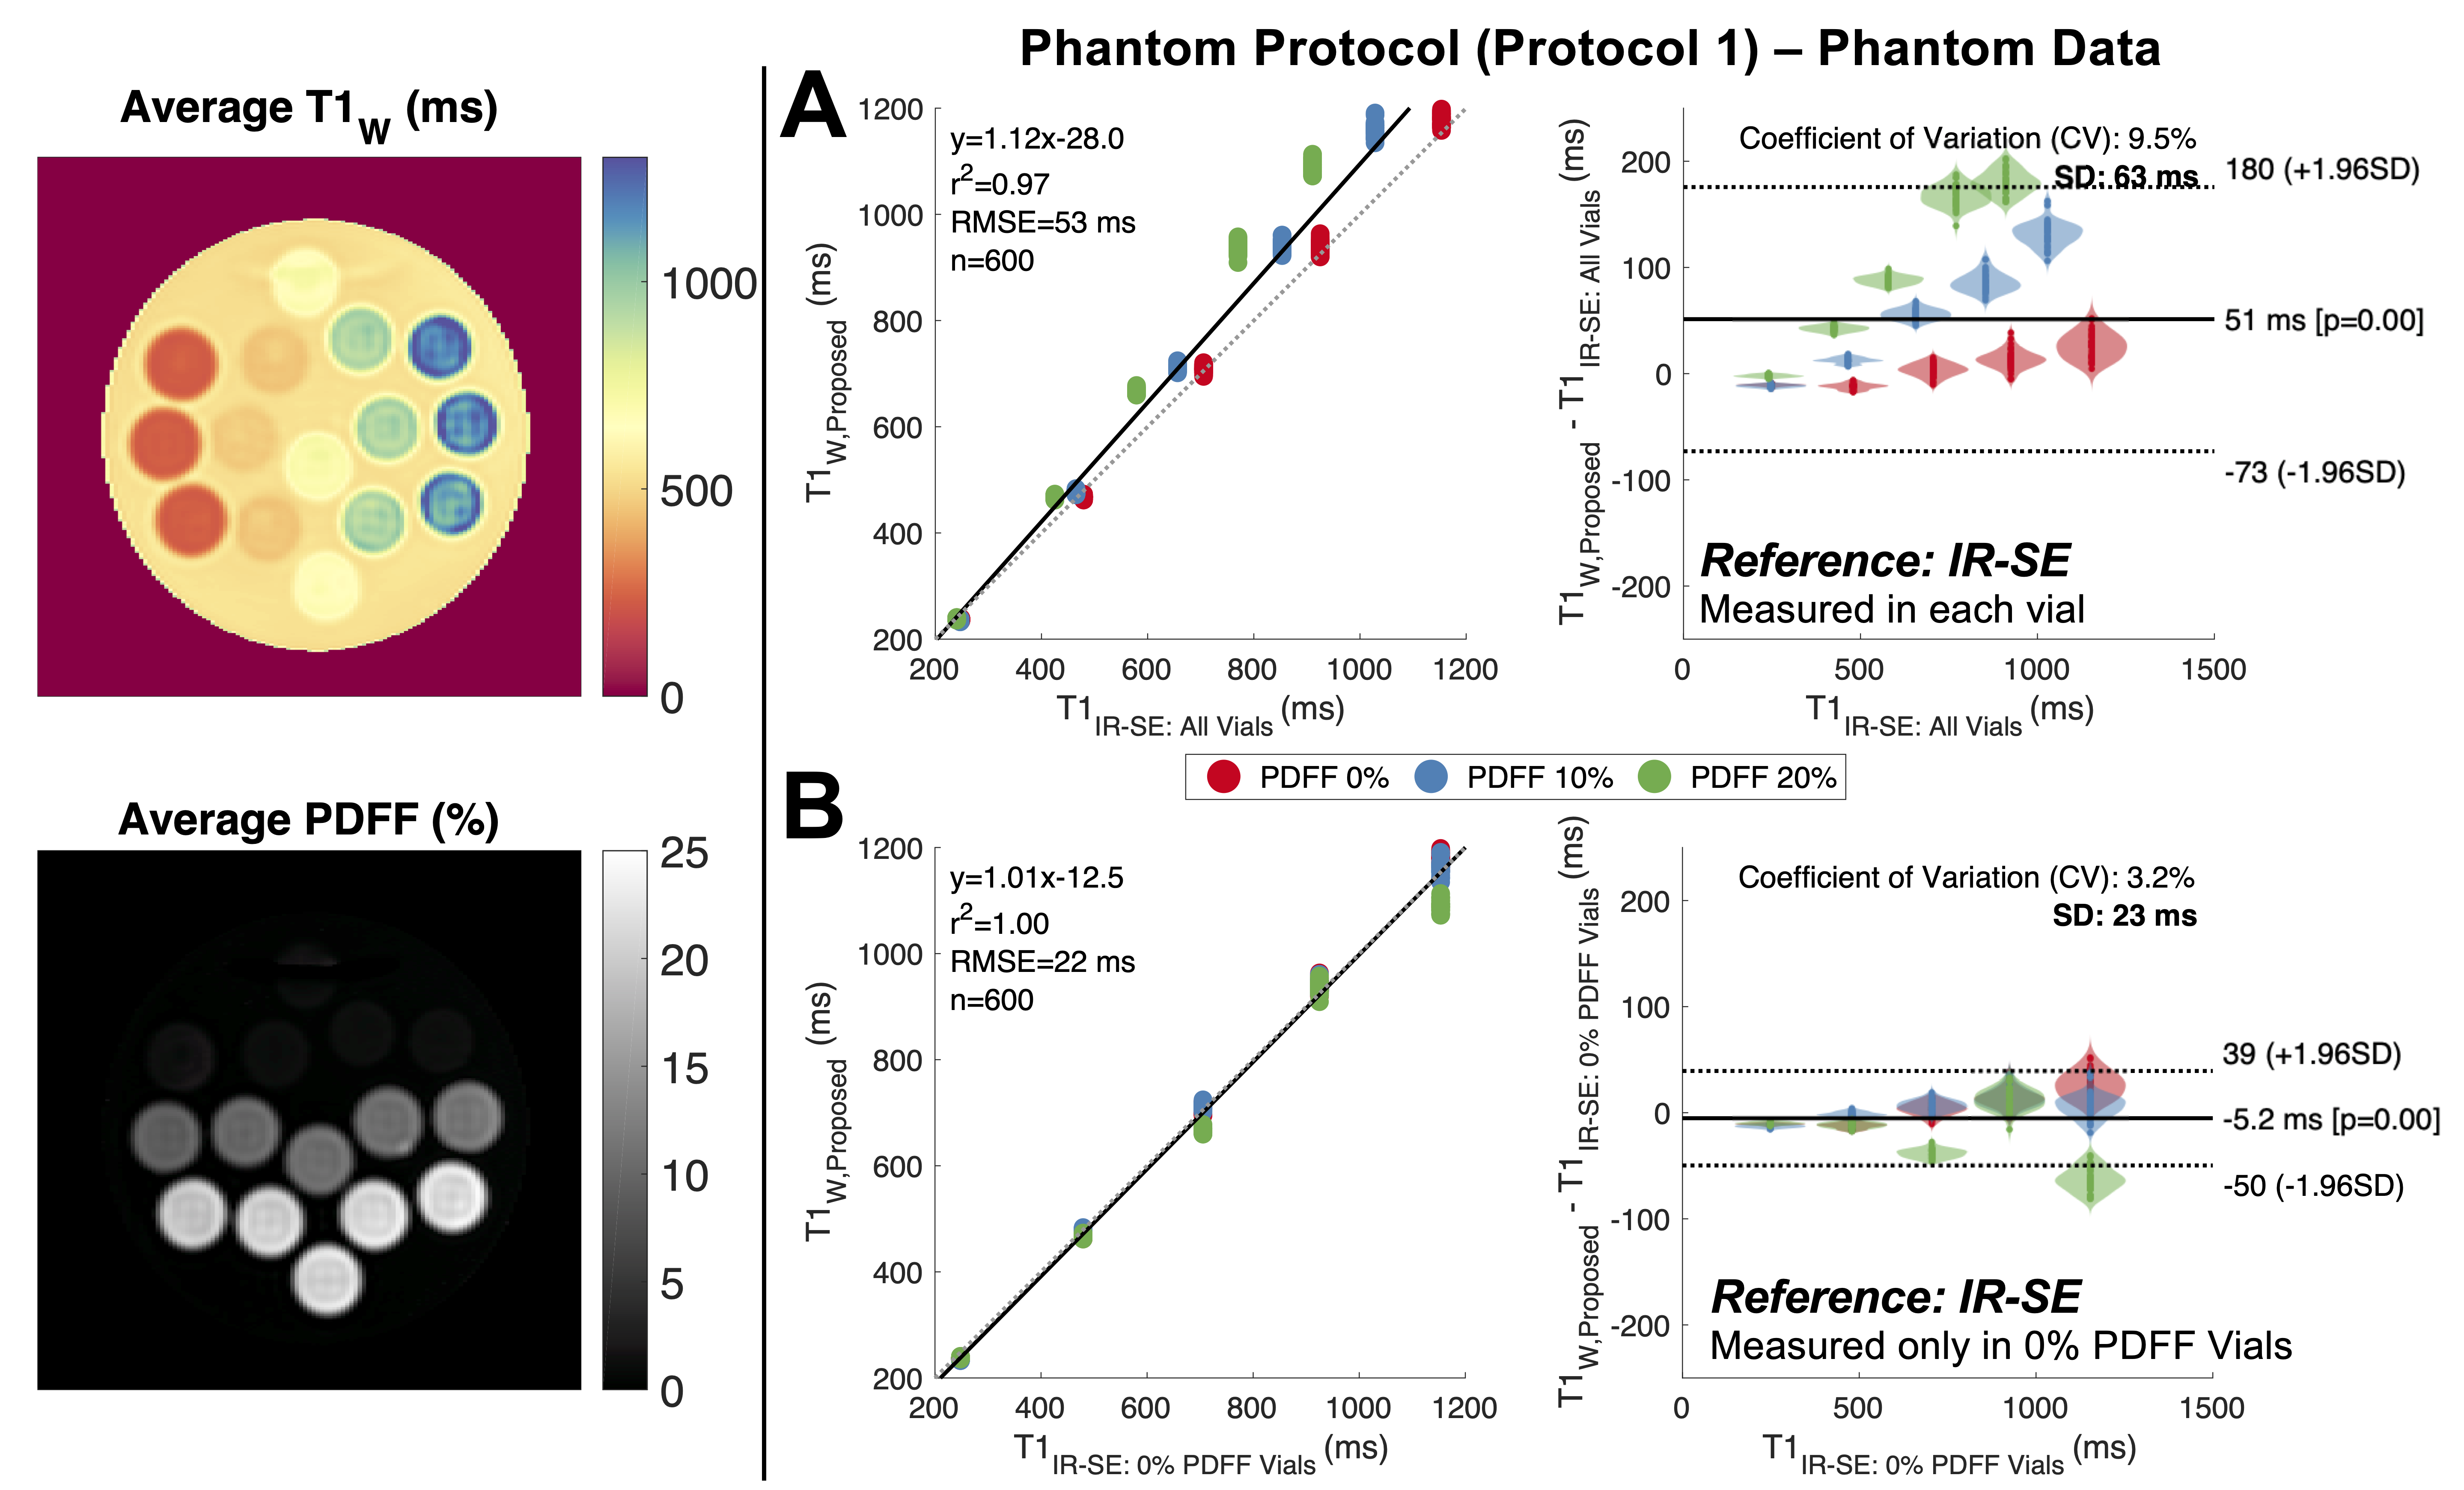
Figure 3. The proposed B1- and fat- corrected T1W measurements showed excellent linear agreement with Inversion Recovery Spin-Echo (IR-SE) T1 measurements (B). IR-SE T1 is biased by the presence of fat (A). However, by assuming true T1W is dependent on NiCl2- concentration and independent of fat, then IR-SE T1 can be measured in vials without added peanut oil (0% PDFF) and used as a reference in all vials (B). Average T1W and PDFF maps across the 40 repeated measurements are shown on the left.
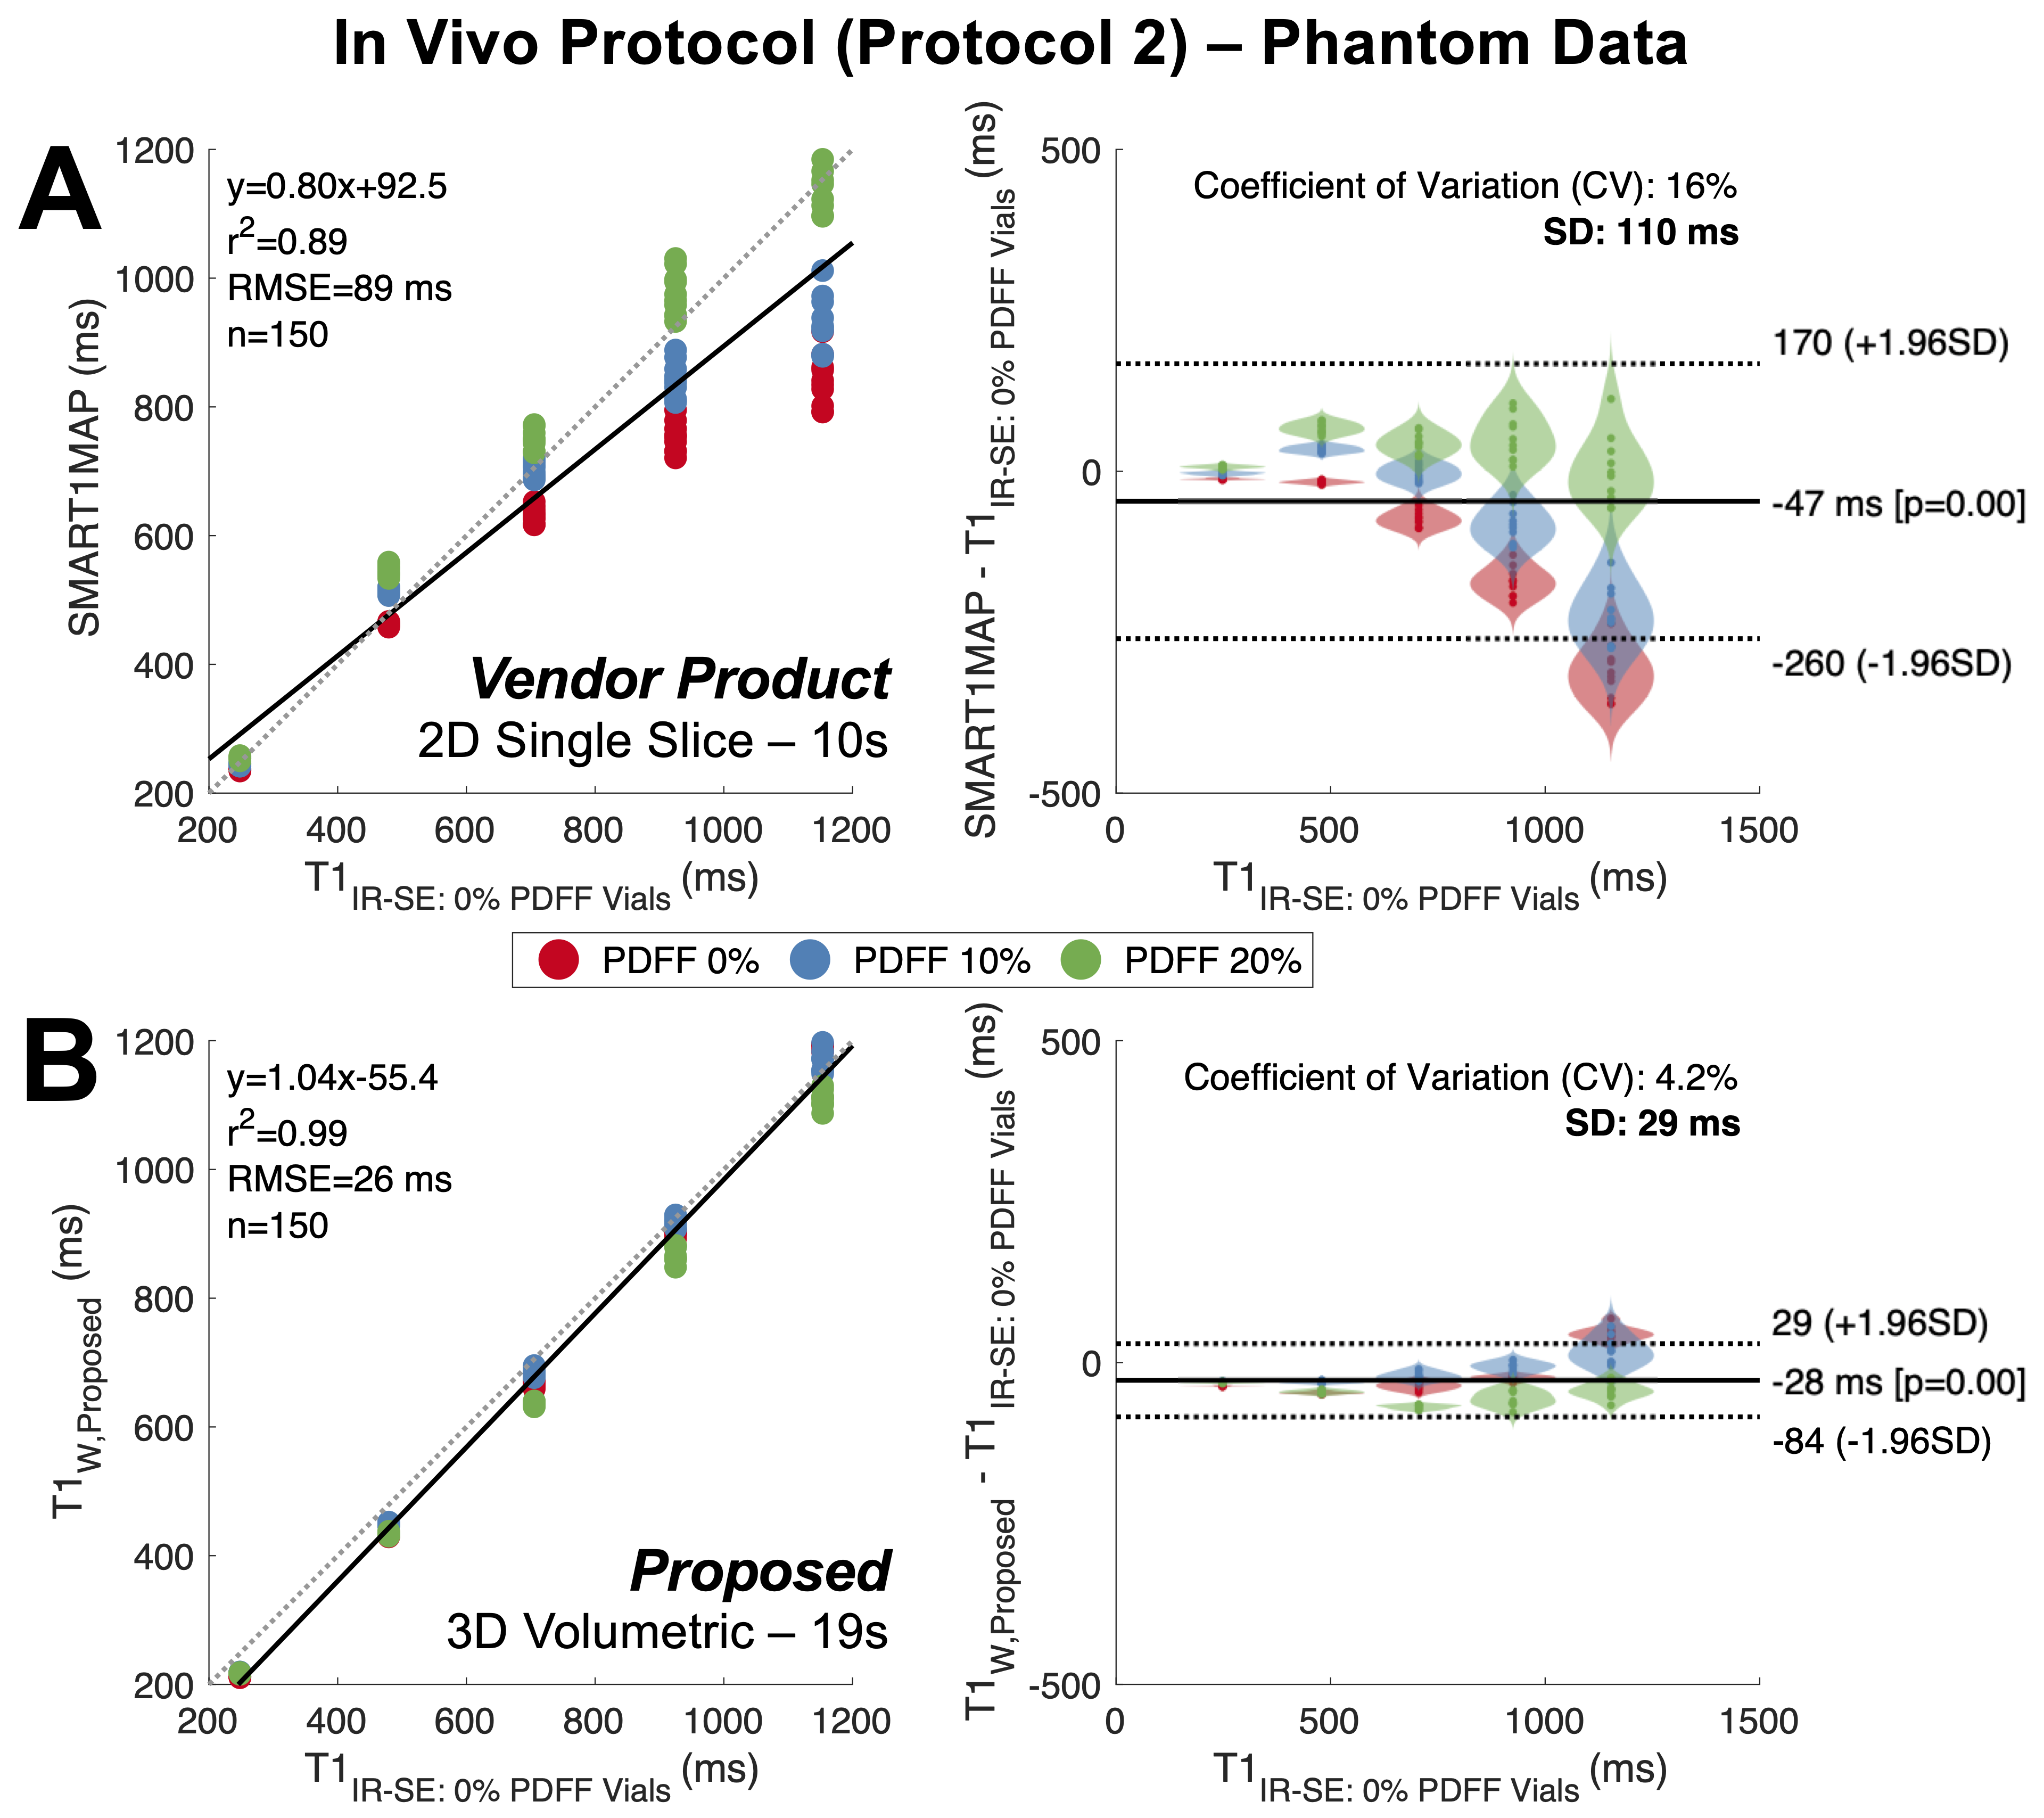
Figure 4. The proposed method (accelerated for a 19 second acquisition) shows both reduced bias and improved precision compared to the vendor provided T1 mapping application (10 second acquisition). Plots show both linear regression and Bland-Altman analysis for both the vendor provided SMART1MAP (GE Healthcare) (A) and proposed (B) T1 mapping methods with IR-SE T1 as a reference (as measured in the phantom vials without fat). Data were acquired in the constructed agar gel phantom using the accelerated in vivo protocol.
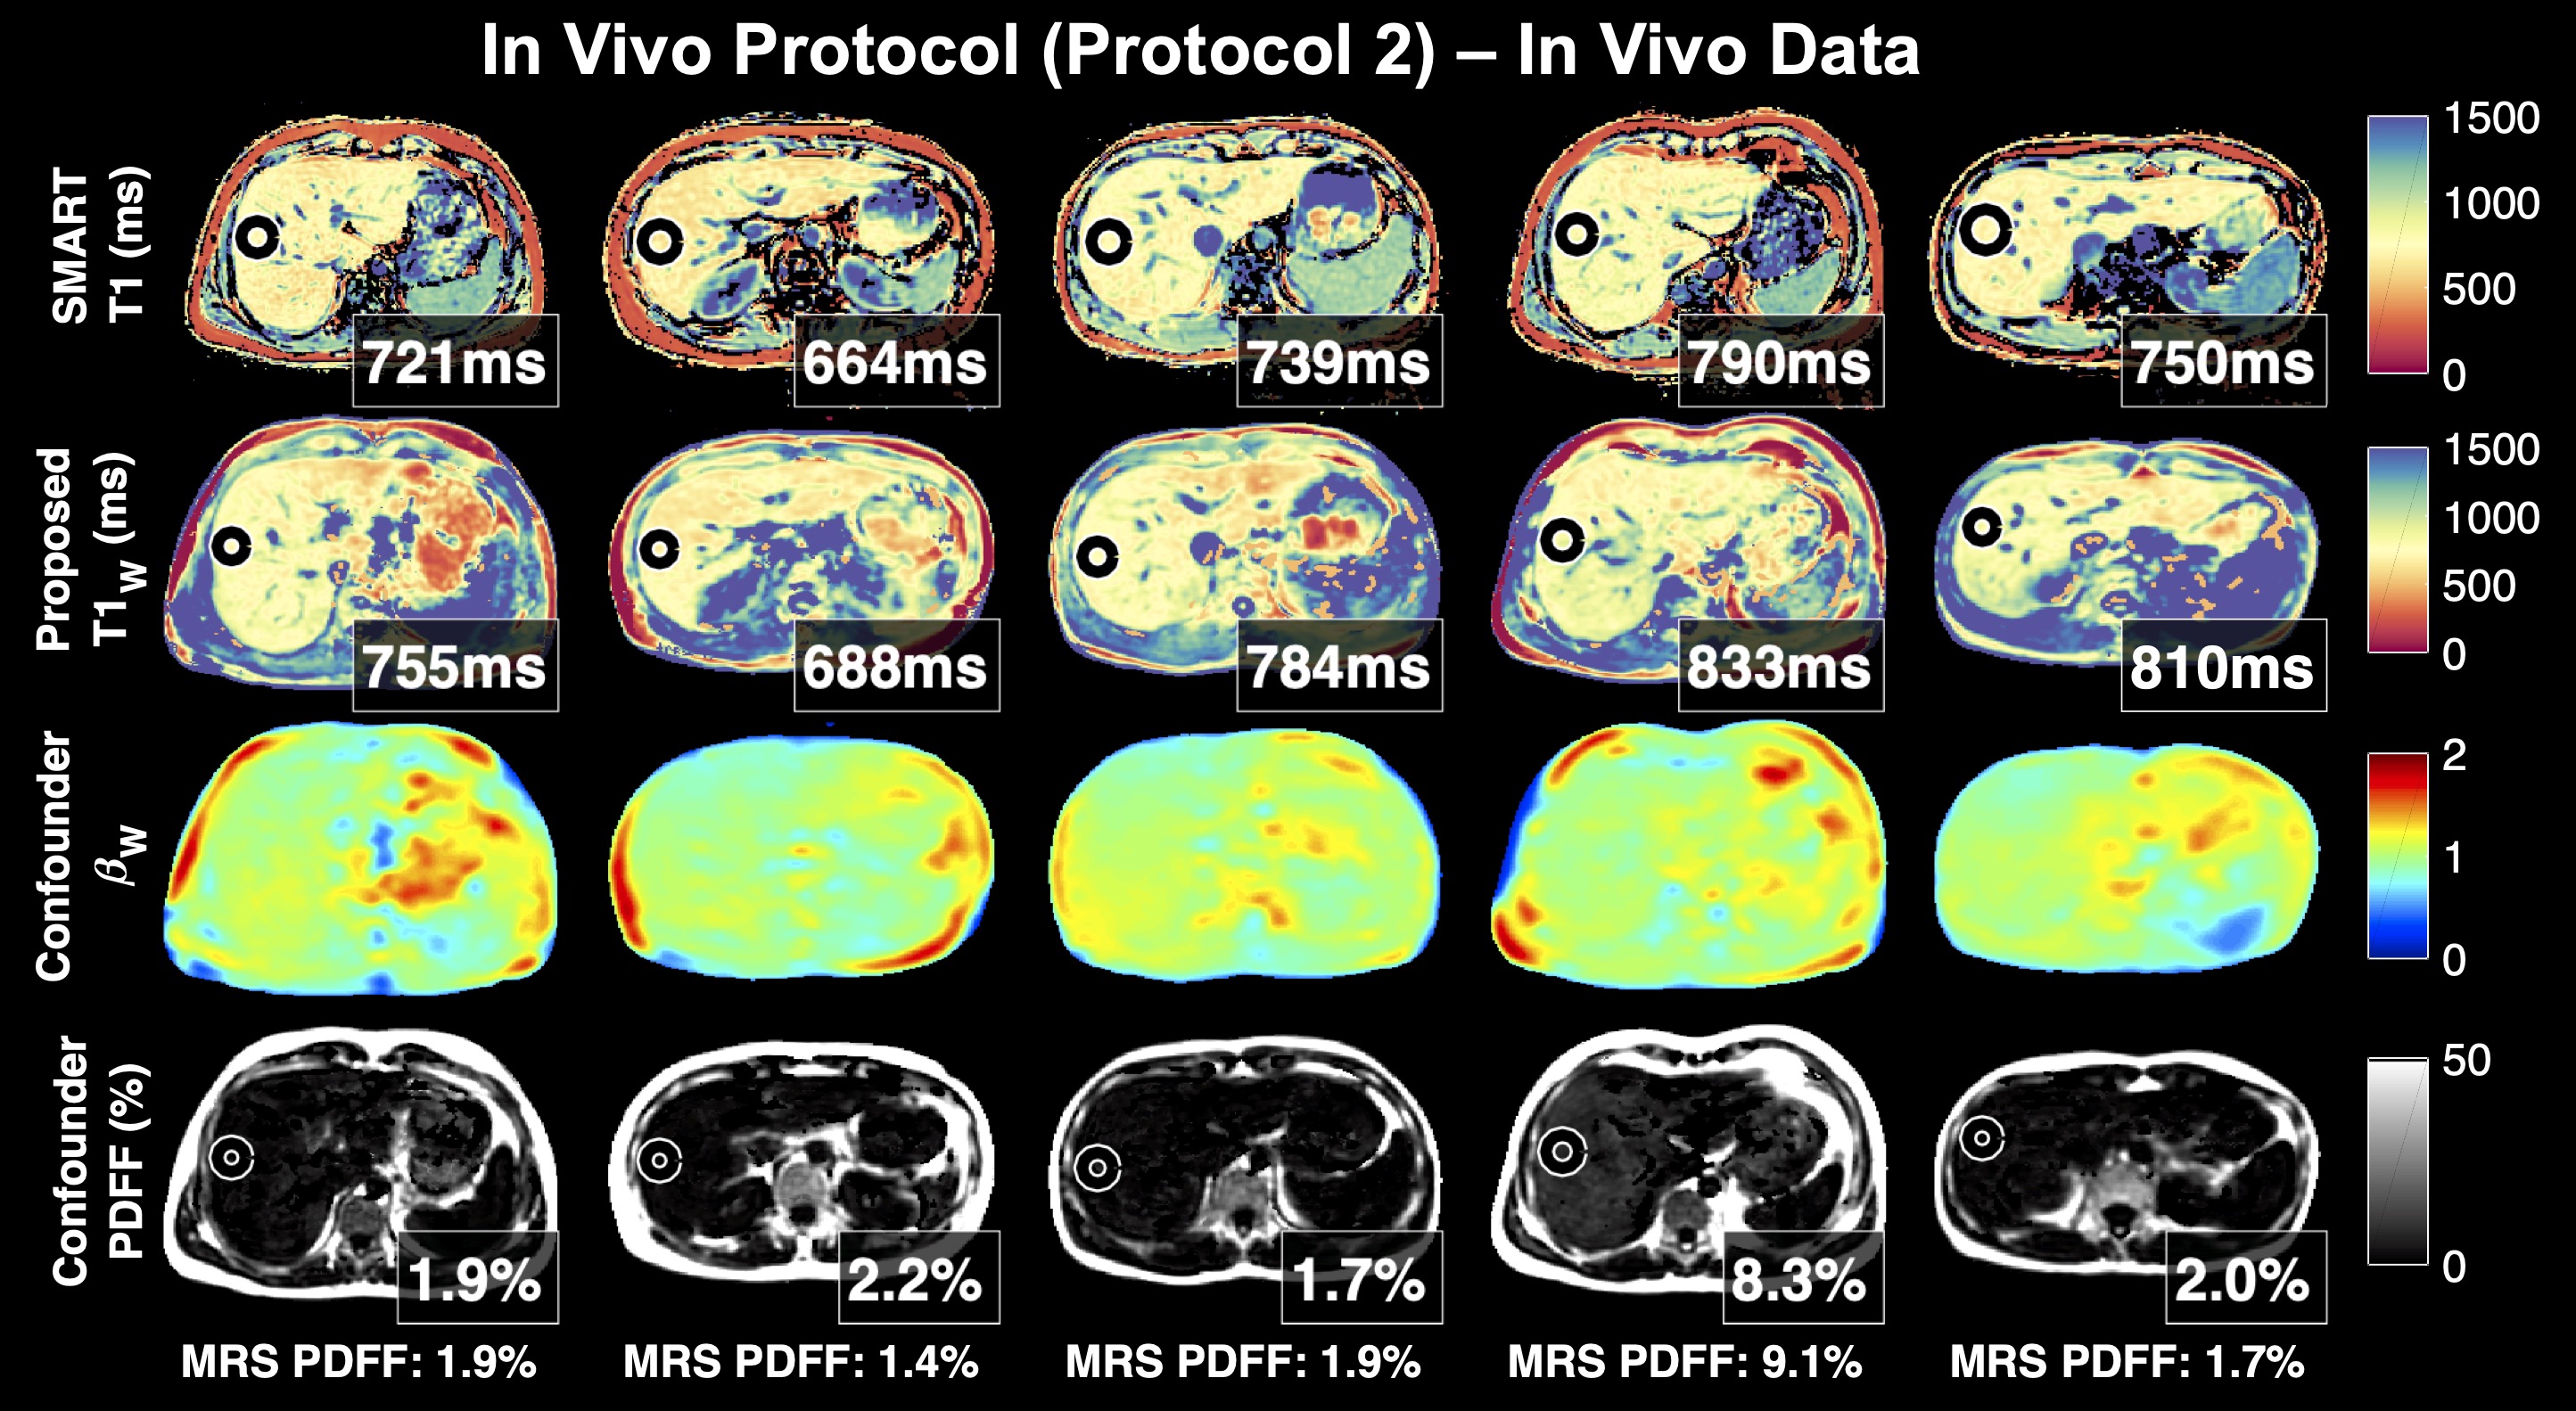
Figure 5. Proposed T1W values (row 2) are generally in agreement with the product SMART T1 mapping sequence (row 1) in reconstructed maps of the liver in 5 healthy volunteers. Multi-TE-TR MR spectroscopy (STEAM) PDFF values are also shown. For in vivo estimation, B0 off-resonance was estimated from the data acquired in pass 1 and fixed in the subsequent joint estimation. After joint estimation, the estimated B1 map was smoothed (as shown) and held constant in a final joint estimation.
DOI: https://doi.org/10.58530/2022/0030