0027
Simultaneous gauging of liver fibrosis and inflammation using 3D single breath-hold Intenso MRE with the gravitational transducer.1King's College London, London, United Kingdom, 2INSERM U1148, LVTS, University Paris Diderot, Paris, France, 3MR Research Collaborations, Siemens Healthcare Limited, Frimley, United Kingdom, 4National Institute of Diabetes and Digestive and Kidney Diseases, Bethesda, MD, United States, 5National Cancer Institute, Bethesda, MD, United States, 6MR Research Collaborations, Siemens Healthcare Limited, Melbourne, Australia, 7MR Application Predevelopment, Siemens Healthcare GmbH, Erlangen, Germany
Synopsis
Successful deployment of 3D liver MRE in the clinical assessment of fibrosis and inflammation requires a single breath-hold sequence to avoid geometric misalignment between different breath-holds and a phase-stable and efficient vibration for adequate wave penetration. We show initial data of Intenso MRE estimating the shear wave speed (Cs [m/s]) and the loss modulus (G’’ [kPa]). Both Cs and G’’ reflect a dependency on Ishak fibrosis and inflammation scores, respectively, in patients with chronic liver disease. In addition, we compare the magnitude of the shear modulus (|G*|) measured with Intenso and to the commonly utilized SE-EPI in such patients.
Introduction
There is a clear need for non-invasive imaging methods to simultaneously stage liver fibrosis and inflammation. Unlike fibrosis the inflammatory process is not as difficult to reverse. Since repetitive inflammatory insults to the liver parenchyma lead to fibrosis –i.e. inflammation precedes fibrosis– clinical course is truly impacted if inflammatory processes are assessed at early timepoints and optimally monitored throughout therapy.Initial results using 3D liver Magnetic Resonance Elastography (MRE) have already shown promises for the staging of liver fibrosis and inflammation using viscoelastic parameters derived from the 3D displacement field1,2, namely, the shear wave speed (Cs [m/s]) for fibrosis and the loss modulus (G’’ [kPa]) for inflammation1.
However, a key aspect to a successful deployment of 3D liver MRE within the clinical workflow is to reduce scan time, preferably to one single breath-hold that can be easily managed and reproduced by patients. Current 3D liver MRE approaches3,4 necessitate several (typically four) breath-holds for one single 3D MRE dataset. This compromises not only patient comfort, but also data quality due to inevitable geometrical misalignments between consecutive breath-holds.
Here, we present initial results from the clinical validation of our previously introduced single breath-hold 3D volumetric SMS-based liver MRE sequence (Intenso5) in patients with chronic liver disease (CLD). We compare the magnitude of the complex shear modulus (|G*|= sqrt((G’)2 + (G’’)2) [kPa]) to the current commercially available 1D SE-EPI6 solution and show the added diagnostic value for staging fibrosis and inflammation when investigating the complex nature of G* in terms of Cs[m/s] and G’’[kPa]. We also investigate the phase angle (Y) dependency on inflammation, with Y=2/π*atan(G’’/G’).
Methods
The Intenso5 sequence was implemented on a 1.5T system (MAGNETOM Aera, Siemens Healthcare, Erlangen, Germany). A total of ten patients with CLD were included in this prospective study that was approved by the local institutional review board. After signing informed consent all patients were imaged at 60Hz mechanical excitation (using the gravitational transducer7) with four wave-phase offsets and 20 mT/m motion-encoding gradients using Hadamard8 encoding. Imaging parameters were 8 slices, 4mm isotropic resolution, a 96 X 66 acquisition matrix acquired with a total GRAPPA acceleration factor of 5 (including in-plane and SMS acceleration) resulting in an FOV of 386 X 264 X 32 mm3, TR= 9.38ms, TE=6.2ms. This resulted in a breath-hold of only 17 seconds.The viscoelastic parameters were reconstructed using the curl-operator reconstruction method9 (3D Gaussian filter of width σ=1 pixels with 3X3X3 pixels support), and the derivatives were calculated in the Fourier space, providing |G*|, Cs, and G’’ and Y.
In addition, all ten CLD patients were scanned in the same session with the pneumatic transducer10 at 60Hz and a single breath-hold SE-EPI sequence6 (13 seconds) that measures the 1D through-plane displacement field within four adjacent slices, providing |G*|.
Finally, liver biopsies from six of the ten patients were available for clinical correlation with histopathology scores of hepatic fibrosis and inflammation (Ishak scores).
Results and Discussion
All ten patients successfully completed the MRI scans, 8 were females, average age was 46.7 years old and average BMI was 32.4kg/m2 (obese range). Six of the patients were suspected of having NASH, two had chronic hepatitis C and two had lipodystrophy.There was a statistically significant linear relationship for the estimated |G*| between the Intenso sequence and the SE-EPI sequence in the ten liver patients (R2=0.97 and p<0.001) (Fig1A). The Bland-Altman plot (Fig1B) of both methods reveals the bias to be of approximately +0.17 kPa in Intenso with a maximum difference of 0.51 kPa between both methods. This positive bias can be explained by the differences between a 3D versus a 1D reconstruction approach. In general, utilizing just one single component of the 3D wavelength vector will always underestimate the true wavelength leading consequently to a lower stiffness estimate. All bias measurements lied within the ±1.96 standard deviation from the mean bias, demonstrating good agreement between the two methods.
The SE-EPI MRE sequence showed an increase in |G*| as a function of Ishak fibrosis score (Fig2A). However, 3D acquisitions allow for a full complex-valued biomechanical expression in terms of Cs and G’’. A clear differentiation between the different Ishak fibrosis scores is visible using Cs (Fig2B), especially for the lower scores of fibrosis (0 and 1). This differentiation is particularly valuable for the detection of early stages of fibrosis.
Excitingly, G’’ increases with Ishak inflammation score (Fig3), allowing Intenso to measure hepatic inflammation. Concomitantly, we do not observe any dependence of the phase angle Y on inflammation (mean Y = 0.2). This matches our previous observations that Y is a generic measurement1 and does not well agree with other studies2. Certainly, the sample size is too low to draw any final conclusions.
Fig4 showcases a patient A) with intermediate inflammation and advanced fibrosis scanned with Intenso. B) demonstrates efficient penetration of the mechanical waves at 60Hz within the liver, C) and D) reflect high |G*| and Cs respectively, indicating advanced fibrosis, E) shows elevated G’’ representing inflammation and finally F) displays homogenous Y in the liver.
Conclusion
We have shown initial results of the single breath-hold 3D MRE sequence, Intenso, simultaneously gauging inflammation and fibrosis in CLD patients.Acknowledgements
No acknowledgement found.References
- Sinkus, R, Lambert, S, Abd-Elmoniem, KZ, et al. Rheological determinants for simultaneous staging of hepatic fibrosis and inflammation in patients with chronic liver disease. NMR in Biomedicine. 2018; 31:e3956.
- Shi Y, Qi YF, Lan GY, Wu Q, Ma B, Zhang XY, Ji RY, Ma YJ, Hong Y. Three-dimensional MR Elastography Depicts Liver Inflammation, Fibrosis, and Portal Hypertension in Chronic Hepatitis B or C. Radiology. 2021 Oct;301(1):154-162. doi: 10.1148/radiol.2021202804. Epub 2021 Aug 10. PMID: 34374594; PMCID: PMC8475654.
- Garteiser P, Sahebjavaher RS, Ter Beek LC, Salcudean S, Vilgrain V, Van Beers BE, Sinkus R. Rapid acquisition of multifrequency, multislice and multidirectional MR elastography data with a fractionally encoded gradient echo sequence. NMR Biomed. 2013 Oct;26(10):1326-35. doi: 10.1002/nbm.2958. Epub 2013 May 28. PMID: 23712852.
- Guenthner C, Sethi S, Troelstra M, Dokumaci AS, Sinkus R, Kozerke S. Ristretto MRE: A generalized multi-shot GRE-MRE sequence. NMR Biomed. 2019 May;32(5):e4049. doi: 10.1002/nbm.4049. Epub 2019 Jan 29. PMID: 30697827; PMCID: PMC6590281.
- Darwish O et al. Intenso MRE: 3D Volumetric GRE-MRE of the liver in a single breathhold, ISMRM 2021, Abstract #1879
- Glaser KJ, Manduca A, Ehman RL. Review of MR elastography applications and recent developments. J Magn Reson Imaging. 2012 Oct;36(4):757-74. doi: 10.1002/jmri.23597. PMID: 22987755; PMCID: PMC3462370.
- Runge JH, Hoelzl SH, Sudakova J, Dokumaci AS, Nelissen JL, Guenthner C, Lee J, Troelstra M, Fovargue D, Stoker J, Nederveen AJ, Nordsletten D, Sinkus R. A novel magnetic resonance elastography transducer concept based on a rotational eccentric mass: preliminary experiences with the gravitational transducer. Phys Med Biol. 2019 Feb 6;64(4):045007. doi: 10.1088/1361-6560/aaf9f8. PMID: 30566925.
- Guenthner C, Runge JH, Sinkus R, Kozerke S. Analysis and improvement of motion encoding in magnetic resonance elastography. NMR Biomed. 2018 May;31(5):e3908. doi: 10.1002/nbm.3908. Epub 2018 Mar 30. PMID: 29601114; PMCID: PMC6585970.
- Sinkus R, Tanter M, Xydeas T, Catheline S, Bercoff J, Fink M. Viscoelastic shear properties of in vivo breast lesions measured by MR elastography. Magn Reson Imaging. 2005 Feb;23(2):159-65. doi: 10.1016/j.mri.2004.11.060. PMID: 15833607.
- Yin M, Talwalkar JA, Glaser KJ, Manduca A, Grimm RC, Rossman PJ, Fidler JL, Ehman RL. Assessment of hepatic fibrosis with magnetic resonance elastography. Clin Gastroenterol Hepatol. 2007 Oct;5(10):1207-1213.e2. doi: 10.1016/j.cgh.2007.06.012. PMID: 17916548; PMCID: PMC2276978.
Figures
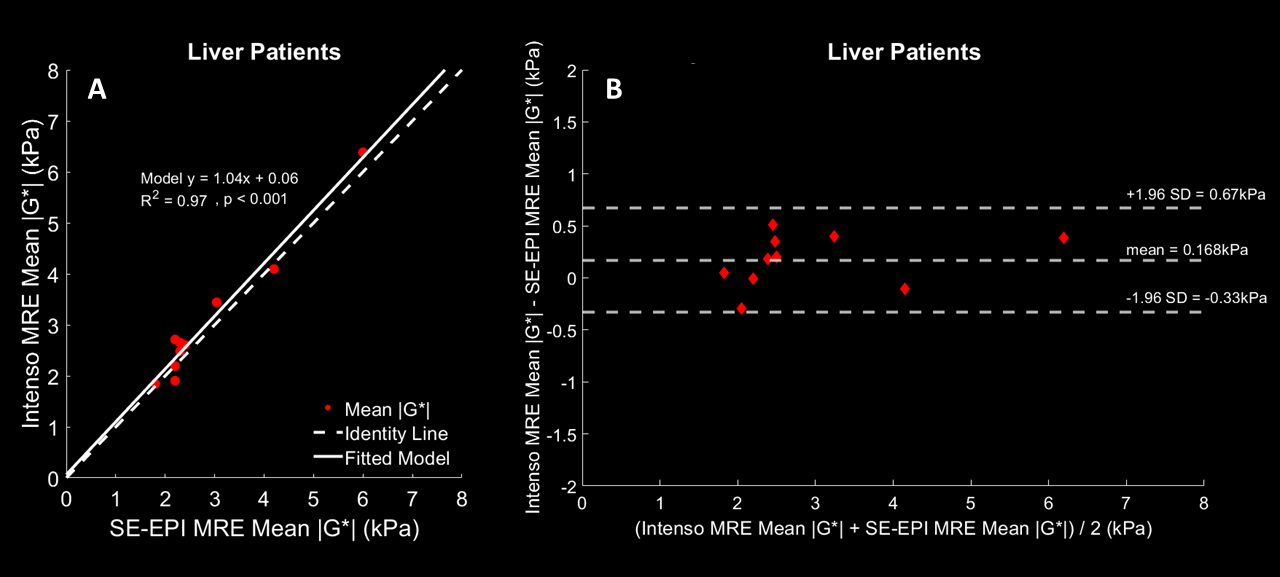
Fig1: Plots between Intenso and SE-EPI estimated mean |G*| [kPa] values. |G*| is averaged over the four inner-most slices for Intenso. A) A simple linear regression analysis is displayed with the slope and intercept next to the data points. B) Bland-Altman plot of the estimated mean |G*| in the liver using Intenso and SE-EPI sequences in the ten liver patients with the mean bias and the confidence intervals highlighted.
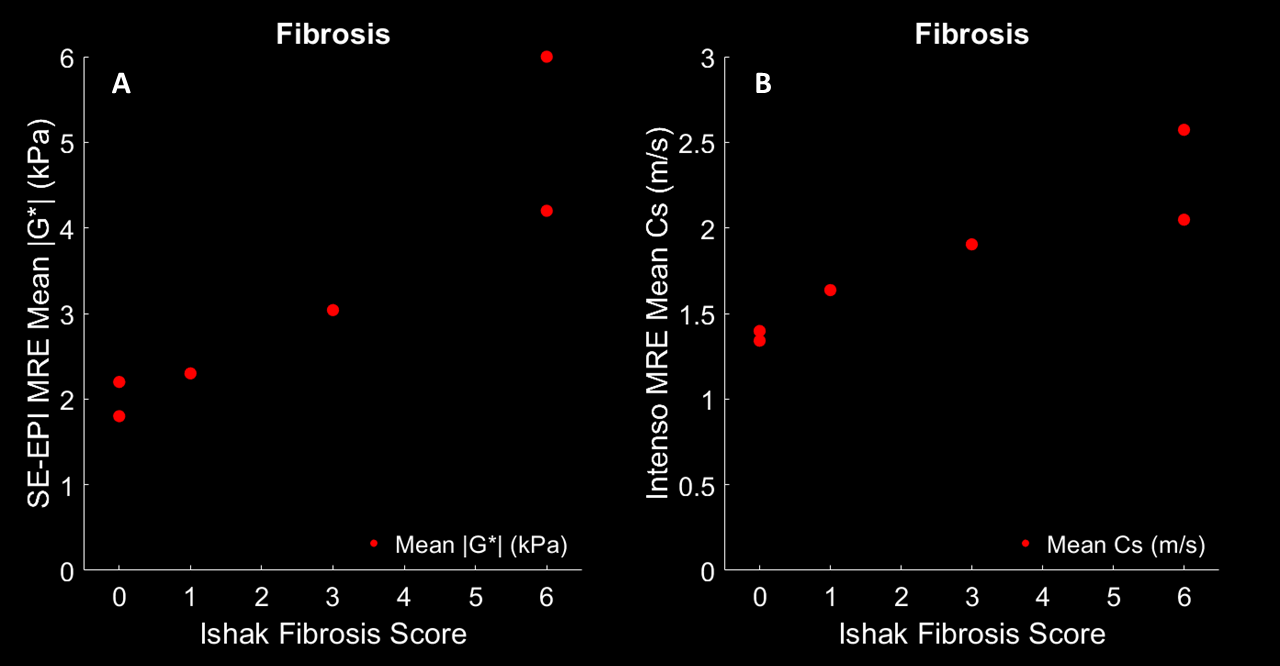
Fig2: Dependence of mean |G*| [kPa] and mean Cs [m/s] estimated by SE-EPI and Intenso respectively on the Ishak fibrosis scores. Cs [m/s] is averaged over the four inner-most slices for Intenso.
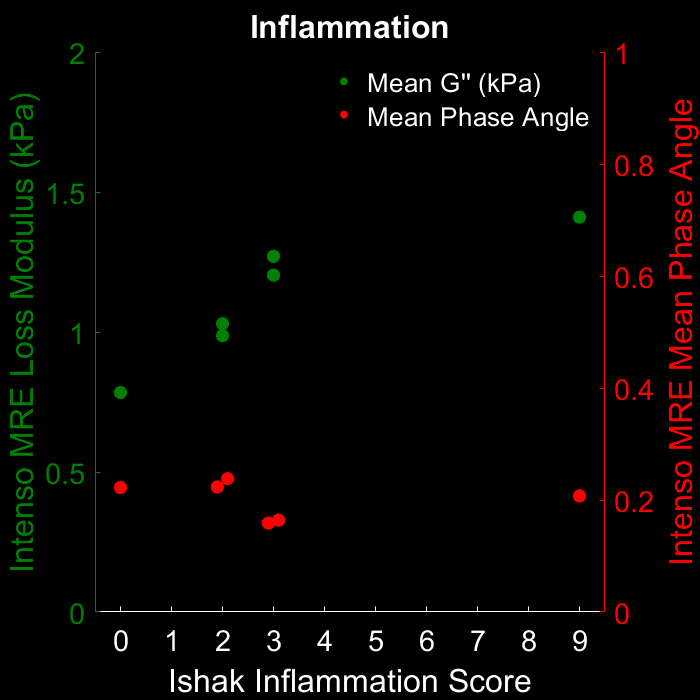
Fig3: The distribution of G’’ [kPa] and Y of Intenso MRE versus the Ishak inflammation scores. Both G’’ [kPa] and Y are averaged over the four inner-most slices. G’’ increases with inflammation, whereas Y is independent of inflammation.
Fig4: Results for a patient with fibrosis and inflammation: A) High-quality magnitude, B) wave image (curl), demonstrating efficient wave penetration within the liver, (C, D, E, F) reconstructed images of |G*|, Cs, G’’, Y. All viscoelastic maps are averaged in the four inner-most slices for Intenso.