0026
Multi-Center, Multi-Vendor Calibration and Validation of Liver Iron Quantification using R2*-MRI at 1.5T and 3T1University of Wisconsin-Madison, Madison, WI, United States, 2University of Texas Southwestern Medical Center, Dallas, TX, United States, 3The Johns Hopkins University, Baltimore, MD, United States, 4Technical University of Munich, Munich, Germany, 5Stanford University, Palo Alto, CA, United States
Synopsis
We report the final results of an NIH funded study of MRI-based quantification of liver iron. R2* MRI enables quantification of liver iron concentration (LIC), but the cross-vendor differences of R2*-based LIC estimation remain unknown. Therefore, we evaluated the performance of R2*-based LIC via a single-breath-hold, confounder-corrected R2*-MRI at both 1.5T and 3T, through a multi-center, multi-vendor study. We confirmed a linear relationship between R2* and LIC, with highly similar calibrations across centers and vendors. Calibrations for 1.5T and 3T were generated. The data generated in this study provide the necessary multi-center calibrations for broad dissemination of R2*-based LIC quantification.
Introduction
Liver R2* quantification enables measurement of liver iron concentration (LIC) for the diagnosis, staging, and treatment monitoring of iron overload1–5. However, R2* is affected by various confounding factors, including the presence of fat and noise floor effects6–8. For these reasons, the center-to-center variability of R2*-based iron quantification remains unknown.Complex “confounder-corrected” R2* mapping8, corrected for the effects of fat and noise, may enable reproducible quantification of LIC. However, only a single-center R2*-LIC calibration has been published for complex confounder-corrected R2*4. Therefore, the purpose of this work is to evaluate the center-to-center differences of complex confounder-corrected R2*-based LIC calibration at both 1.5T and 3T, through a prospective multi-center, multi-vendor study.
Methods
Centers and MRI Vendors: Four centers with 1.5T and 3T clinical MRI systems from three vendors (GE Healthcare, Philips, and Siemens) participated in this study (see Table 1).Patients: In this prospective, IRB-approved study, patients with known or suspected iron overload were recruited after obtaining informed consent.
Study Visit: Each participant underwent MRI at both 1.5T and 3T in a single visit. Serum ferritin concentration from a blood draw was also measured. The reference LIC measurement was obtained at 1.5T using a commercial FDA-approved R2-based method for quantification of LIC (FerriScan, Resonance Health)9. R2* mapping data were acquired at 1.5T and 3T (either 3.0T or 2.89T) in a single breath-hold using a multi-echo spoiled gradient echo (SGRE) acquistion10–12, with field strength-specific parameters standardized across centers and vendors (Table 1).
R2* Mapping:
Complex-valued multi-echo SGRE images were transferred from each of the centers to the data processing center for R2* mapping, measurement, and analysis. R2* maps were generated using a centralized, confounder-corrected algorithm8 including correction for multi-peak fat signals (no fat correction at high R2* to avoid instabilities)4, and avoiding noise bias through the use of non-linear least-squares fitting to the complex-valued data.
Image analysis:
For each subject and field strength, R2* measurements were performed in each of the Couinaud segments (5, 6, 7, 8) within the right liver lobe.
R2*-LIC multi-center calibration: For 1.5T and 3.0T data separately, calibration curves were generated for each center by linear regression:
$$LIC = a + b R2^*$$
To evaluate the differences in calibration across centers, we built a master model using pooled data from all centers with center ID as covariates. The intercepts and slopes were compared for each pair of centers by F-tests on their interactions with the center ID. An overall calibration was determined for R2* to predict LIC using the pooled data. For 2.89T data, the empirical calibration was evaluated by interpolating the 1.5T and 3.0T calibrations to obtain a predicted 2.89T calibration, which was compared to the empirical measured 2.89T calibration using a chi-square test.
Additional analysis: The ability of R2* to detect relevant clinical thresholds (1.8 mg/g13,14, 3.2 mg/g9,15, 7.0 mg/g9,15, and 15.0 mg/g9,15) was evaluated using ROC analysis. The correlation of R2* across field strengths was evaluated using linear regression. The performance of serum ferritin to predict LIC was evaluated using linear regression and ROC analysis.
Results
This study recruited 207 patients, with mean LIC of 6.3 ± 7.7 (range: 0.3-42.5, median: 3.1) mg/g.Figure 1A-B shows the calibrations between R2* and LIC at both 1.5T (four centers) and 3.0T (three centers). No significant differences were observed between any pair of centers at either field strength (p>0.412 across all comparisons).
From these pooled calibrations at 1.5T and 3.0T, a predicted (interpolated) calibration at 2.89T was calculated (Figure 1C), and compared to the empirical 2.89T calibration (no significant difference, chi-square statistic=2.8, p=0.25).
The calibrations measured in this work at 1.5T, 2.89T, and 3.0T are shown in Figure 1.
The diagnostic performance of R2* at 1.5T and 3T to detect LIC thresholds is depicted in the ROC curves in Figure 2. In all cases, AUCs of 0.98 or higher were observed.
The relationship between 1.5T and 3T R2* measurements is shown in Figure 3. Overall, a regression slope of 1.94 (CI: [1.91, 1.97]) between 1.5T and 3.0T measurements was observed, with R2=0.99.
Finally, the relationship between serum ferritin concentration and LIC is shown in Figure 4, including regression analysis (Figure 4A) and ROC analysis (Figure 4B).
Discussion
This NIH-funded multi-center, multi-vendor study determined the R2*-LIC calibration for complex confounder-corrected R2* MRI at both 1.5T and 3T. Our final results demonstrate high cross-vendor similarity across calibrations, providing a common calibration relationship across vendors. Importantly, this work also provides R2*-LIC calibration at both 1.5T and 3T.Our work has several limitations, including the lack of biopsy for LIC calibration (biopsy is no longer standard of care to quantify LIC at most institutions), and the use of Cartesian acquisitions, which may limit the dynamic range of measurable R2* due to the lack of ultra-short TEs. However, reliable R2* measurements were obtained in this study for LIC values well above 15 mg/g, the accepted threshold for severe iron overload15.
In conclusion, the reported multi-center R2*-LIC calibrations were highly similar across centers and vendors, and enable accurate detection of clinically meaningful LIC thresholds. These data provide the necessary calibrations for broad dissemination of R2*-based LIC quantification on most clinically available MRI systems used in modern imaging centers.
Acknowledgements
The authors would like to acknowledge Nikolaos Panagiotopoulos, MD, for assistance with data analysis. We wish to acknowledge support from the NIH (R01 DK100651, R01 DK117354, R01 DK083380, and K24 DK102595). We also acknowledge GE Healthcare who provides research support to the University of Wisconsin-Madison and Stanford University, Philips Healthcare who provides research support to the University of Texas-Southwestern, and Siemens Healthineers who provides research support to Johns Hopkins University. Finally, Dr. Reeder is a Romnes Faculty Fellow, and has received an award provided by the University of Wisconsin-Madison Office of the Vice Chancellor for Research and Graduate Education with funding from the Wisconsin Alumni Research Foundation.
References
1. Anderson LJ, Holden S, Davis B, et al. Cardiovascular T2-star (T2*) magnetic resonance for the early diagnosis of myocardial iron overload. Eur. Heart J. 2001;22(23):2171–2179.
2. Wood JC, Enriquez C, Ghugre N, et al. MRI R2 and R2* mapping accurately estimates hepatic iron concentration in transfusion-dependent thalassemia and sickle cell disease patients. Blood. 2005;106(4):1460–1465.
3. Hankins JS, McCarville MB, Loeffler RB, et al. R2* magnetic resonance imaging of the liver in patients with iron overload. Blood. 2009;113(20):4853–4855.
4. Hernando D, Cook RJ, Qazi N, et al. Complex confounder-corrected R2* mapping for liver iron quantification with MRI. Eur. Radiol. 2021;31(1):264–275.
5. Jhaveri KS, Kannengiesser SAR, Ward R, Kuo K, Sussman MS. Prospective Evaluation of an R2* Method for Assessing Liver Iron Concentration (LIC) Against FerriScan: Derivation of the Calibration Curve and Characterization of the Nature and Source of Uncertainty in the Relationship. J. Magn. Reson. Imaging JMRI. 2019;49(5):1467–1474.
6. Kühn J-P, Hernando D, Muñoz del Rio A, et al. Effect of multipeak spectral modeling of fat for liver iron and fat quantification: correlation of biopsy with MR imaging results. Radiology. 2012;265(1):133–142.
7. Hernando D, Kühn J-P, Mensel B, et al. R2* estimation using “in-phase” echoes in the presence of fat: the effects of complex spectrum of fat. J. Magn. Reson. Imaging JMRI. 2013;37(3):717–726.
8. Hernando D, Kramer JH, Reeder SB. Multipeak fat-corrected complex R2* relaxometry: theory, optimization, and clinical validation. Magn. Reson. Med. 2013;70(5):1319–1331.
9. St Pierre TG, Clark PR, Chua-anusorn W, et al. Noninvasive measurement and imaging of liver iron concentrations using proton magnetic resonance. Blood. 2005;105(2):855–861.
10. Meisamy S, Hines CDG, Hamilton G, et al. Quantification of hepatic steatosis with T1-independent, T2-corrected MR imaging with spectral modeling of fat: blinded comparison with MR spectroscopy. Radiology. 2011;258(3):767–775.
11. Zhong X, Nickel MD, Kannengiesser SAR, et al. Liver fat quantification using a multi-step adaptive fitting approach with multi-echo GRE imaging. Magn. Reson. Med. 2014;72(5):1353–1365.
12. Ruschke S, Eggers H, Kooijman H, et al. Correction of phase errors in quantitative water-fat imaging using a monopolar time-interleaved multi-echo gradient echo sequence. Magn. Reson. Med. 2017;78(3):984–996.
13. Bassett ML, Halliday JW, Powell LW. Value of hepatic iron measurements in early hemochromatosis and determination of the critical iron level associated with fibrosis. Hepatol. Baltim. Md. 1986;6(1):24–29.
14. Nuttall KL, Palaty J, Lockitch G. Reference limits for copper and iron in liver biopsies. Ann. Clin. Lab. Sci.2003;33(4):443–450.
15. Olivieri NF, Brittenham GM. Iron-chelating therapy and the treatment of thalassemia. Blood. 1997;89(3):739–761.
Figures
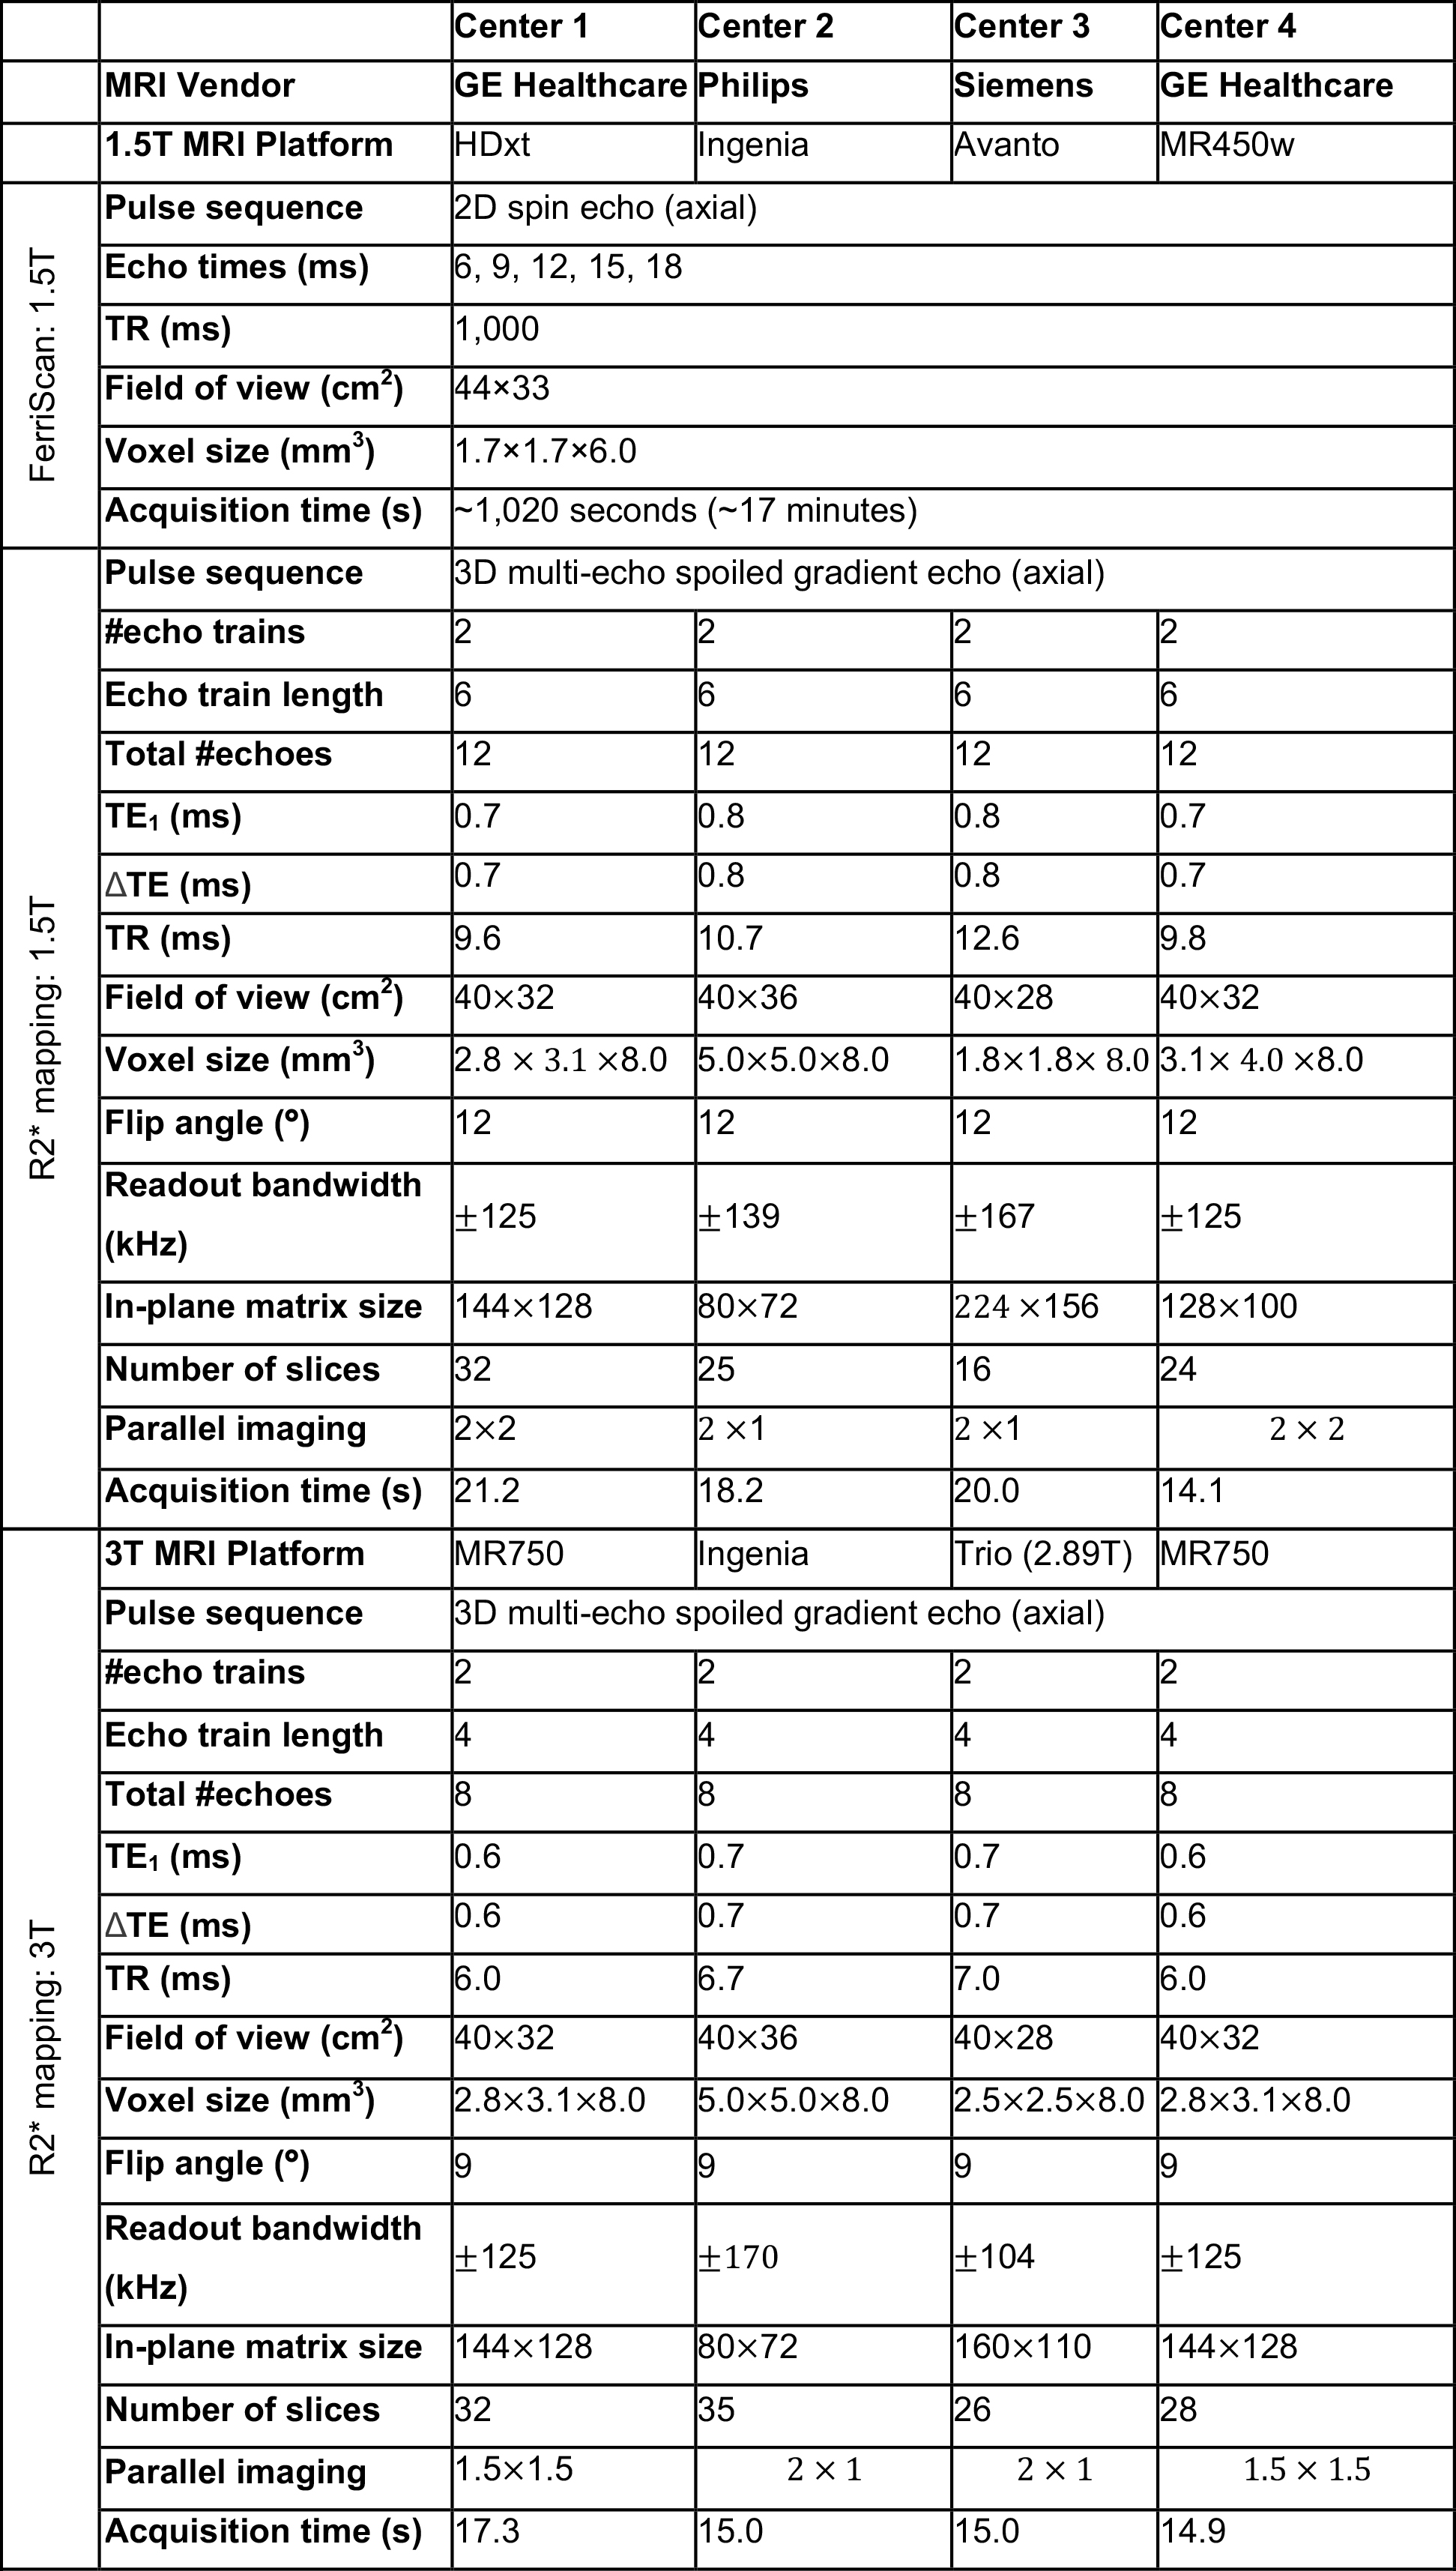
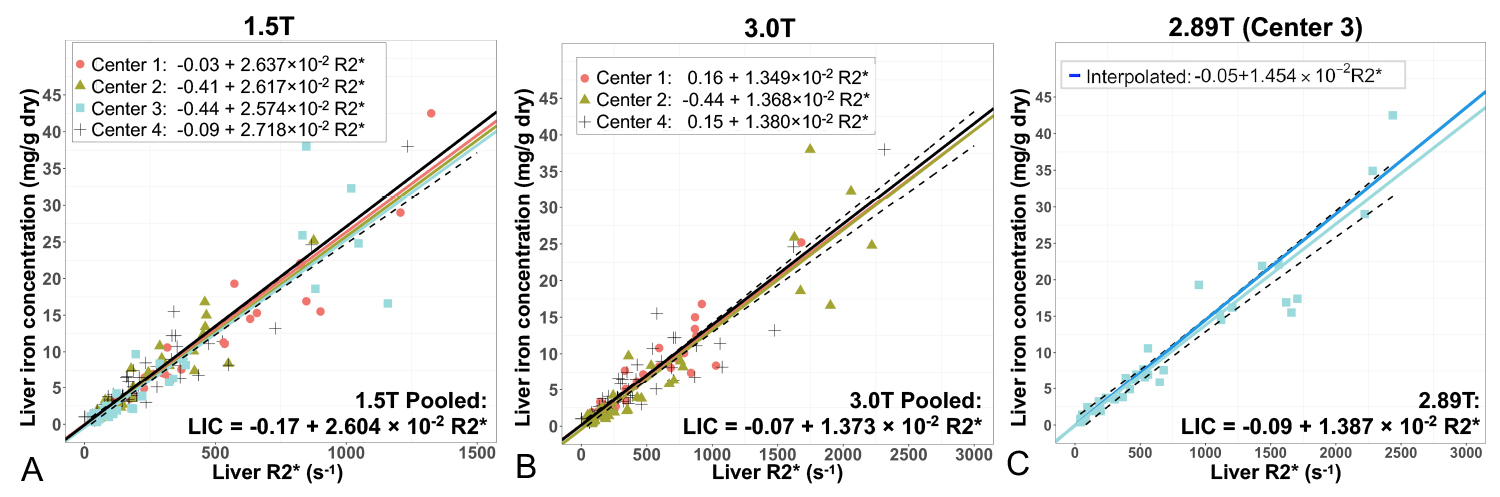
Figure 1. R2*-LIC calibration for each of the four 1.5T centers (A), each of the three 3.0T centers (B), as well as the 2.89T center (C). The dashed lines show the confidence intervals for the pooled calibration at 1.5T and 3.0T.
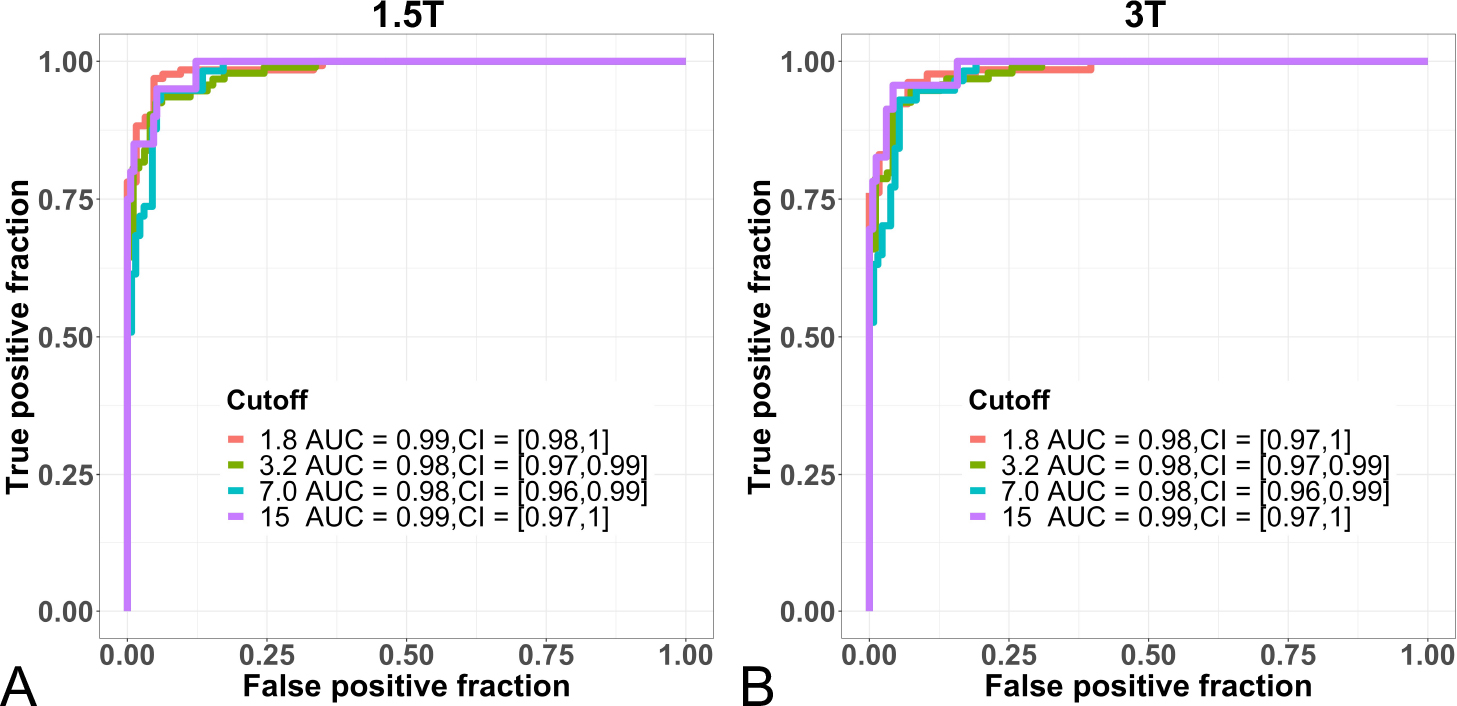
Figure 2: Receiver operating characteristic curves for R2*-based LIC to detect several LIC thresholds. Results are shown pooled across all four centers for each of the two clinical field strengths, 1.5T (A) and 3T (including both 2.89T and 3.0T) (B).
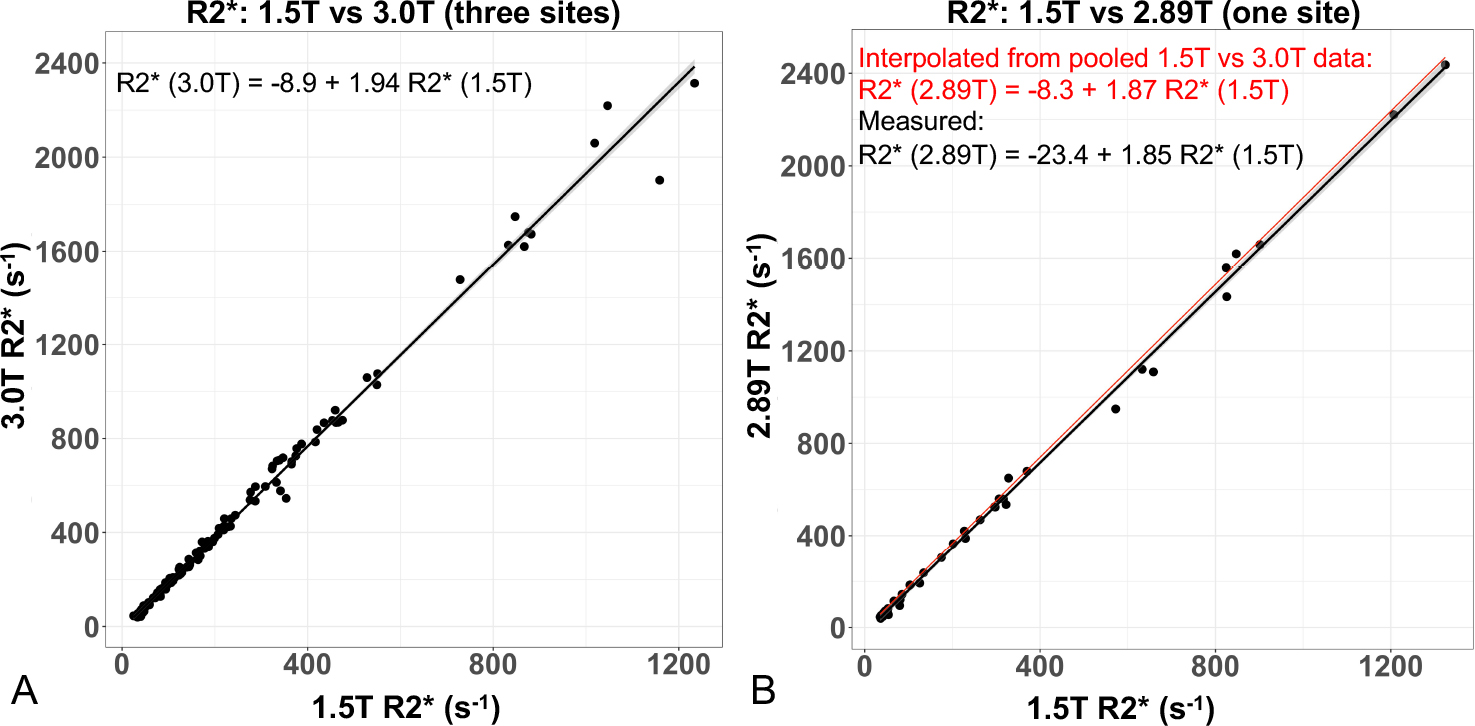
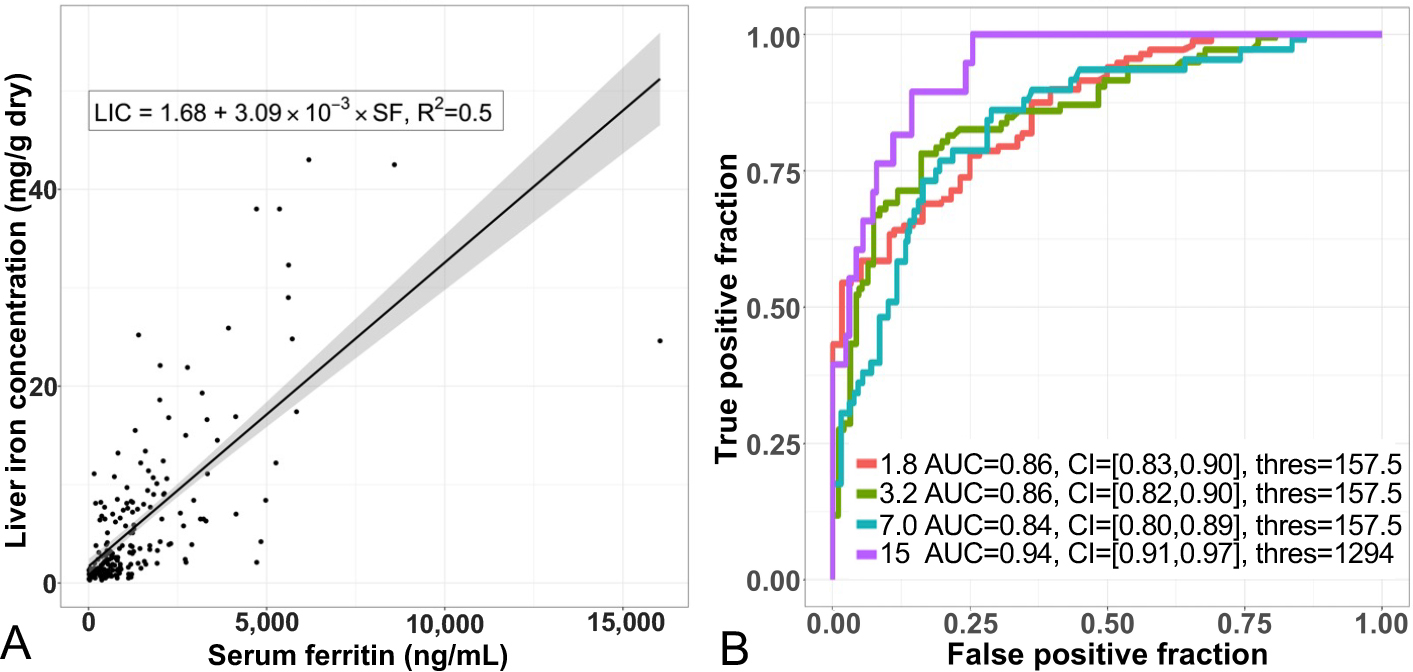
Figure 4: Performance of serum ferritin concentration for the evaluation of liver iron concentration (LIC), including (A) scatter plot with linear regression, and (B) received operating characteristic curves for several LIC thresholds.