0025
Online FIRE Reconstruction of Cardiac MRF T1, T2 and ECV maps with Neural Network Dictionary Generation and Low-Rank Subspace Reconstruction
Alexander Fyrdahl1, Nicole Seiberlich1, and Jesse Hamilton1
1Radiology, University of Michigan, Ann Arbor, MI, United States
1Radiology, University of Michigan, Ann Arbor, MI, United States
Synopsis
The ability to reconstruct research images online may facilitate clinical translation and dissemination of new methods. Online implementations of cardiac MRF have been described previously, although they required long reconstruction times due to the need to perform online Bloch equation simulations. In this work, an efficient online 2D cardiac MRF reconstruction pipeline is introduced, capable of displaying myocardial tissue property maps in less than a minute.
Introduction
The goal of this abstract is to introduce a clinically feasible image reconstruction pipeline for T1, T2 and extracellular volume (ECV) maps using cardiac Magnetic Resonance Fingerprinting (MRF). Cardiac MRF is an emerging method for multiparametric myocardial tissue property mapping. Unlike other applications of MRF, such as in the brain, cardiac MRF with prospective ECG triggering requires scan-specific dictionary generation to model the effects of the patient’s cardiac rhythm on the MRF timecourses (1). Online implementations of cardiac MRF have been described previously, although they required long reconstruction times (~35 minutes per slice) due to the need to perform online Bloch equation simulations, including time-consuming corrections for preparation pulse efficiency (2). In this work, an efficient online 2D cardiac MRF reconstruction pipeline is introduced using the FIRE framework (Siemens, Erlangen, Germany) to display tissue property maps in only 42 seconds, combining a pre-trained neural network for rapid generation of heart rate specific dictionaries and a low-rank subspace reconstruction to reduce aliasing artifacts and noise.Methods
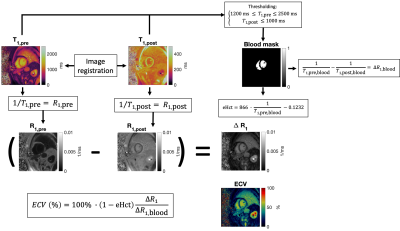
Data collection was performed at 1.5 T (MAGNETOM Sola, Siemens, Erlangen, Germany) in two volunteers and four patients using FISP-based cardiac MRF sequence, with scan parameters similar to previous work (1). The data were collected during a 15-heartbeat breathhold with diastolic ECG triggering (254 ms scan window) at a mid-ventricular short-axis slice, both before and 10-15 minutes after intravenous injection of gadolinium contrast agent. Data were reconstructed offline in MATLAB and online using a reconstruction workflow implemented in the FIRE framework and the Berkeley Advanced Reconstruction Toolbox (3). The offline reconstruction used a Bloch equation simulation for scan-specific dictionary generation implemented in complied MATLAB-Mex code, whereas the online reconstruction used a fully-connected neural network (which rapidly outputs MRF timecourses when given T1, T2, and cardiac RR intervals) implemented in TensorFlow with Keras, as previously described (4). For both online and offline pipelines, a low-rank subspace reconstruction with locally low-rank regularization (6x6 image patches) (5) was used to reconstruct images that were later matched to the scan-specific dictionary to yield T1 and T2 maps. Reconstruction of extracellular volume fraction (ECV) maps was enabled in the online workflow by temporarily storing the native T1 map and its corresponding low-rank subspace images along with appropriate metadata so that the corresponding native and post-contrast maps could be paired without user input. The native and post-contrast T1 maps were registered and the blood pool was automatically masked using thresholding (using native T1 between 1200-2500 ms and post-contrast T1 less than or equal to 1000 ms), and hematocrit values were estimated using an empirical relationship to calculate a synthetic ECV measurement (6). In vivo T1, T2, and ECV values were measured in mid-ventricular myocardial segments, as defined by the American Heart Association.Results
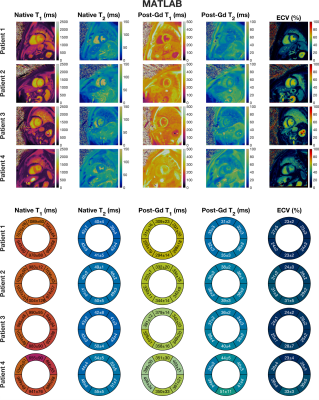
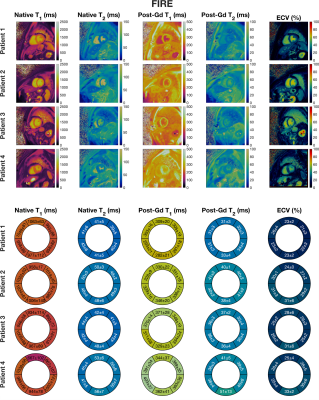
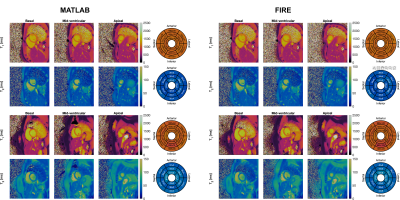
The average total reconstruction time—including dictionary generation, low-rank reconstruction, and pattern matching—was 6 minutes and 20 seconds for the offline (MATLAB) implementation and 42 seconds for the online (FIRE) implementation. The ECV calculation added a trivial amount of time to the post-contrast workflow; 0.3 seconds for the MATLAB implementation and 0.1 seconds for the FIRE implementation. A schematic overview of the ECV reconstruction is described in Figure 1. Similar image quality and quantitative values were observed from the offline and online implementations, with slightly increased standard deviations for the online reconstruction (Figures 2–4).Discussion
This work has introduced an efficient online pipeline using the FIRE framework for reconstructing 2D cardiac MRF native and post-contrast maps, including ECV. The pipeline uses several strategies to reduce computation time, including using a neural network for rapid dictionary calculation, and a low-rank MRF reconstruction implemented in BART. Native and post-contrast tissue property values using the online pipeline agreed well with images reconstructed offline using the conventional Bloch equation-based approach. The calculation of ECV maps was presented here as a proof-of-concept since ideally the patient’s hematocrit should be measured close to the time of the image acquisition to yield accurate results (7). As hematocrit values from a blood sample were not available, empirical estimation of the hematocrit was used. However, the relationship between hematocrit and the longitudinal relaxivity of blood measured by cMRF has yet to be established, so the corresponding formula for MOLLI was used.Conclusion
An online reconstruction pipeline for 2D cardiac MRF using the FIRE framework is demonstrated, capable of reconstructing T1, T2, and ECV maps at the scanner in only 42 seconds per slice.Acknowledgements
No acknowledgement found.References
- Hamilton JI, Jiang Y, Chen Y, Ma D, Lo WC, Griswold M, Seiberlich N. MR fingerprinting for rapid quantification of myocardial T1, T2, and proton spin density. Magn. Reson. Med. 2017;77:1446–1458.
- Ahad J, Lo W-C, Hamilton JI, Franson D, Jiang Y, Seiberlich N. Implementation of Cardiac MRF in Gadgetron for Online Reconstruction. In: Proc. 26th Annu. Meet. ISMRM. Paris, France; 2018. p. 4789.
- Uecker M, Tamir JI, Bahri D, Virtue P, Cheng J, Zhang T, Lustig M. Berkeley advanced reconstruction toolbox. In: Proc. 23rd Annu. Meet. ISMRM. Toronto, Canada; 2015. p. 2486.
- Hamilton JI, Seiberlich N. Machine Learning for Rapid Magnetic Resonance Fingerprinting Tissue Property Quantification. Proc. IEEE 2020;108:69–85.
- Lima da Cruz G, Bustin A, Jaubert O, Schneider T, Botnar RM, Prieto C. Sparsity and locally low rank regularization for MR fingerprinting. Magn. Reson. Med. 2019;81:3530–3543.
- Treibel TA, Fontana M, Maestrini V, et al. Automatic Measurement of the Myocardial Interstitium: Synthetic Extracellular Volume Quantification Without Hematocrit Sampling. JACC Cardiovasc. Imaging 2016;9:54–63.
- Engblom H, Kanski M, Kopic S, Nordlund D, Xanthis CG, Jablonowski R, Heiberg E, Aletras AH, Carlsson M, Arheden H. Importance of standardizing timing of hematocrit measurement when using cardiovascular magnetic resonance to calculate myocardial extracellular volume (ECV) based on pre- and post-contrast T1 mapping. J. Cardiovasc. Magn. Reson. 2018;20:46.
Figures

Figure 1. Overview of the extracellular volume (ECV) calculation. T1 maps were acquired before and after intravenous injection of a Gadolinium-based contrast agent. Native and post-contrast T1 maps were co-registered and a blood mask was calculated by thresholding the T1-values. Using the blood mask, the change in T1 relaxivity of the blood (∆R1,blood) was calculated. Estimated hematocrit (eHct) was obtained from an empirical formula (6). Finally, ECV was calculated as the voxel-wise change in T1 relaxivity divided by the change in T1 relaxivity of blood, multiplied by 1-eHct.

Figure 2. Upper-panel: Mid-ventricular slices from all 4 patients displaying native (pre-contrast) T1, native (pre-contrast) T2, post-contrast T1, post-contrast T2, and ECV, reconstructed using MATLAB with an average reconstruction time of 6 minutes and 20 seconds per slice. Lower-panel: Quantitative values measured in the 6 mid-ventricular segments from the American Heart Association’s 16-segment model.

Figure 3. Upper-panel: Mid-ventricular slices from all 4 patients displaying native (pre-contrast) T1, native (pre-contrast) T2, post-contrast T1, post-contrast T2, and ECV, reconstructed using FIRE with an average reconstruction time of 42 seconds per slice. Lower-panel: Quantitative values measured in the 6 mid-ventricular segments from the American Heart Association’s 16-segment model.

Figure 4. Native T1 maps in basal, mid-ventricular, and apical slices in two healthy volunteers, reconstructed by the offline and online reconstruction pipelines. Bullseye plots show the quantitative T1 and T2 values in the segments defined by the American Heart Association.
DOI: https://doi.org/10.58530/2022/0025