0023
Metabolite-Cycled Echo-Planar Spectroscopic Imaging of the Human Heart1Institute for Biomedical Engineering, University and ETH Zurich, Zurich, Switzerland
Synopsis
Spectroscopic imaging could provide insights into regional cardiac triglyceride variations, but scan times are relatively long. In this work metabolite-cycled echo-planar spectroscopic imaging with motion-adapted gating and weighted acquisition is proposed to assess triglyceride-to-water ratios in different regions of the human heart. Results are compared to metabolite-cycled EPSI with conventional acquisition and to single voxel measurements in the interventricular septum. It is shown that scan time can be reduced by more than half to less than 10 minutes as compared to conventional acquisition, while keeping the quality of triglyceride fitting constant.
Introduction
Proton MRS has been shown to be a valuable tool to study cardiac triglyceride (TG) levels1. While single voxel spectroscopy only provides information from a single volume in the interventricular septum and is therefore mainly relevant when global alterations are studied, spectroscopic imaging could provide insights into regional TG variations. Although proton spectroscopic imaging has been performed in the heart before2, relatively long scan times hamper clinical applications. A reduction in scan time can be obtained by using motion-adapted gating3, weighted acquisition4 and metabolite cycling5.The objective of the present work was to implement metabolite-cycled echo-planar spectroscopic imaging with motion-adapted gating and weighted acquisition and compare the method to metabolite-cycled EPSI with conventional acquisition and to single voxel measurements for assessing triglyceride-to-water ratios in the human heart.
Methods
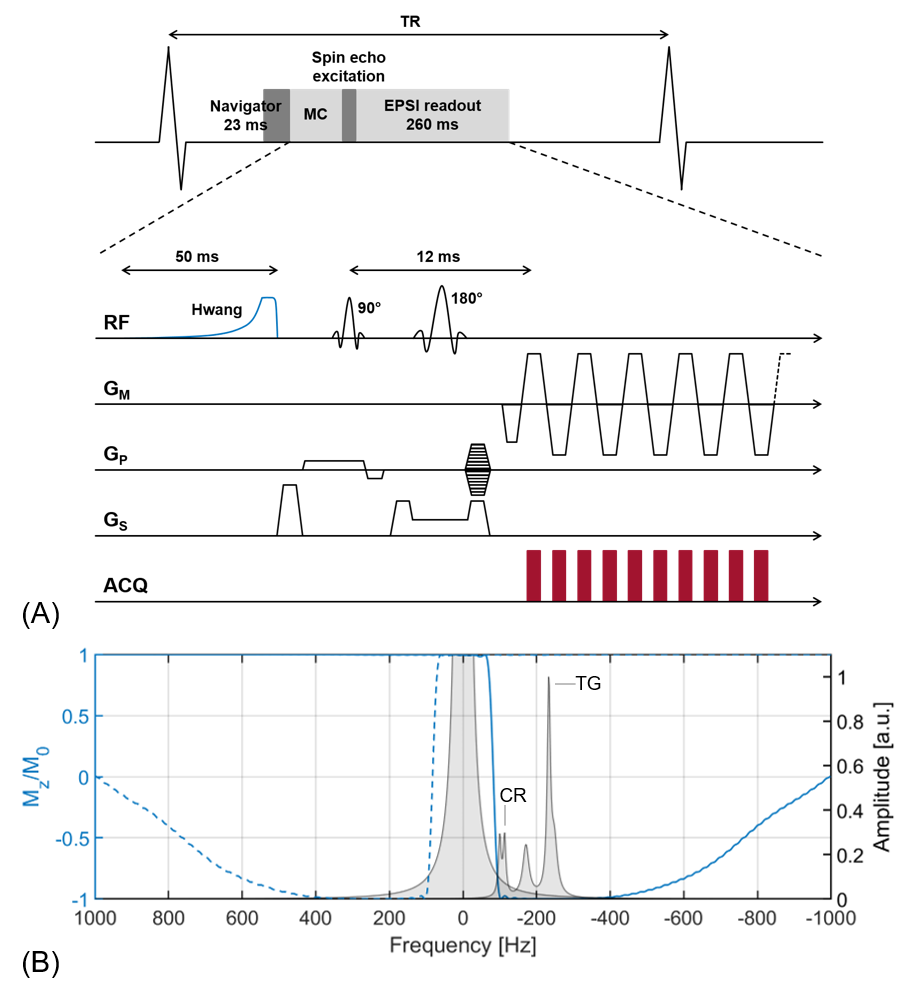
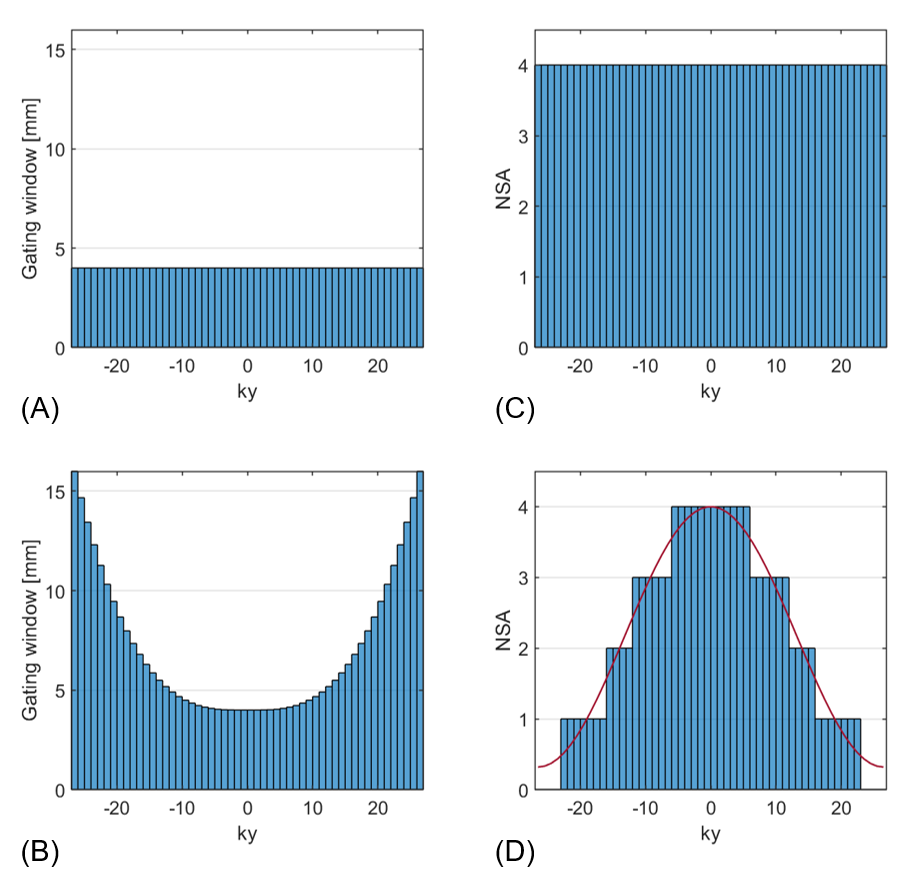
Measurements were performed on ten healthy volunteers (age = 28.37 ± 4.66 years, 5 male) using a 1.5T scanner (Philips Healthcare, Best, the Netherlands) and a five-channel cardiac receiver array. Metabolite-cycled EPSI was implemented by adding an optimized Hwang pulse6-9 prior to a local-look EPSI sequence10 (Figure 1). For motion-adapted gating, the actual displacement of the diaphragm was monitored using a respiratory navigator positioned on the lung-liver interface and a cubic weighting function was used to control which line in k-space had to be measured accordingly. Motion-adapted gating was combined with weighted acquisition, where a Hamming function determined the number of signal averages acquired per line in k-space (Figure 2). Metabolite-cycled EPSI data was acquired both without and with motion-adapted gating in combination with weighted acquisition in an equatorial slice in short-axis view. A total number of 8 averages was acquired, of which half were inverted upfield and half were inverted downfield of the water resonance11. Parameters for EPSI were as follows: FOV = 300×150 mm2, voxel size = 3×3×15 mm3, TR = 1 heartbeat, TE = 12 ms, spectral BW = 1064 Hz, spectral resolution = 4.2 Hz.For comparison, single voxel spectra were acquired in the interventricular septum using a PRESS sequence with reduced spoiler areas12 and the following sequence parameters: NSA = 96 (water-suppressed) + 16 (water), voxel size = 10×20×40 mm3, minimum TR = 2 s, TE = 22 ms and CHESS-based water suppression (BW = 100 Hz). The navigator was employed for respiratory gating (window = 4 mm). Both EPSI and PRESS measurements were ECG-triggered to end systole.
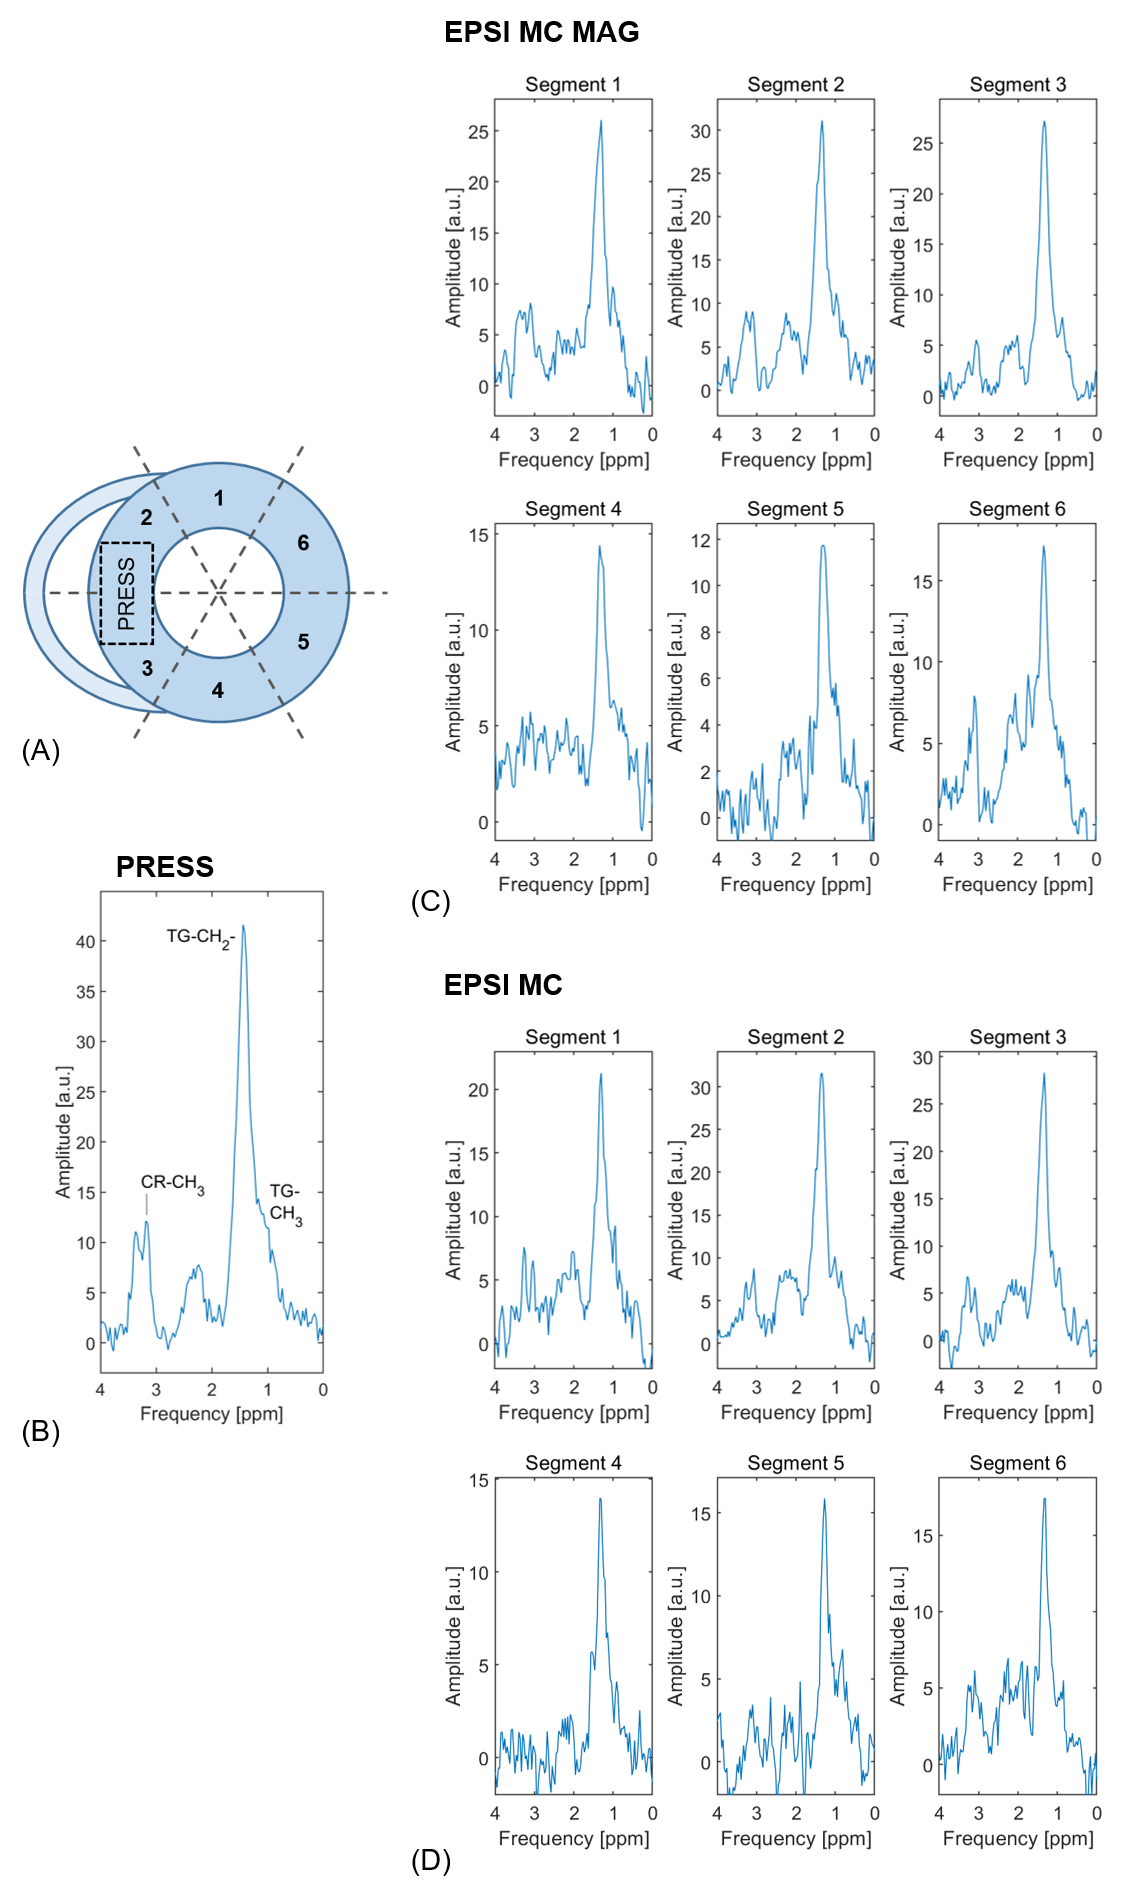
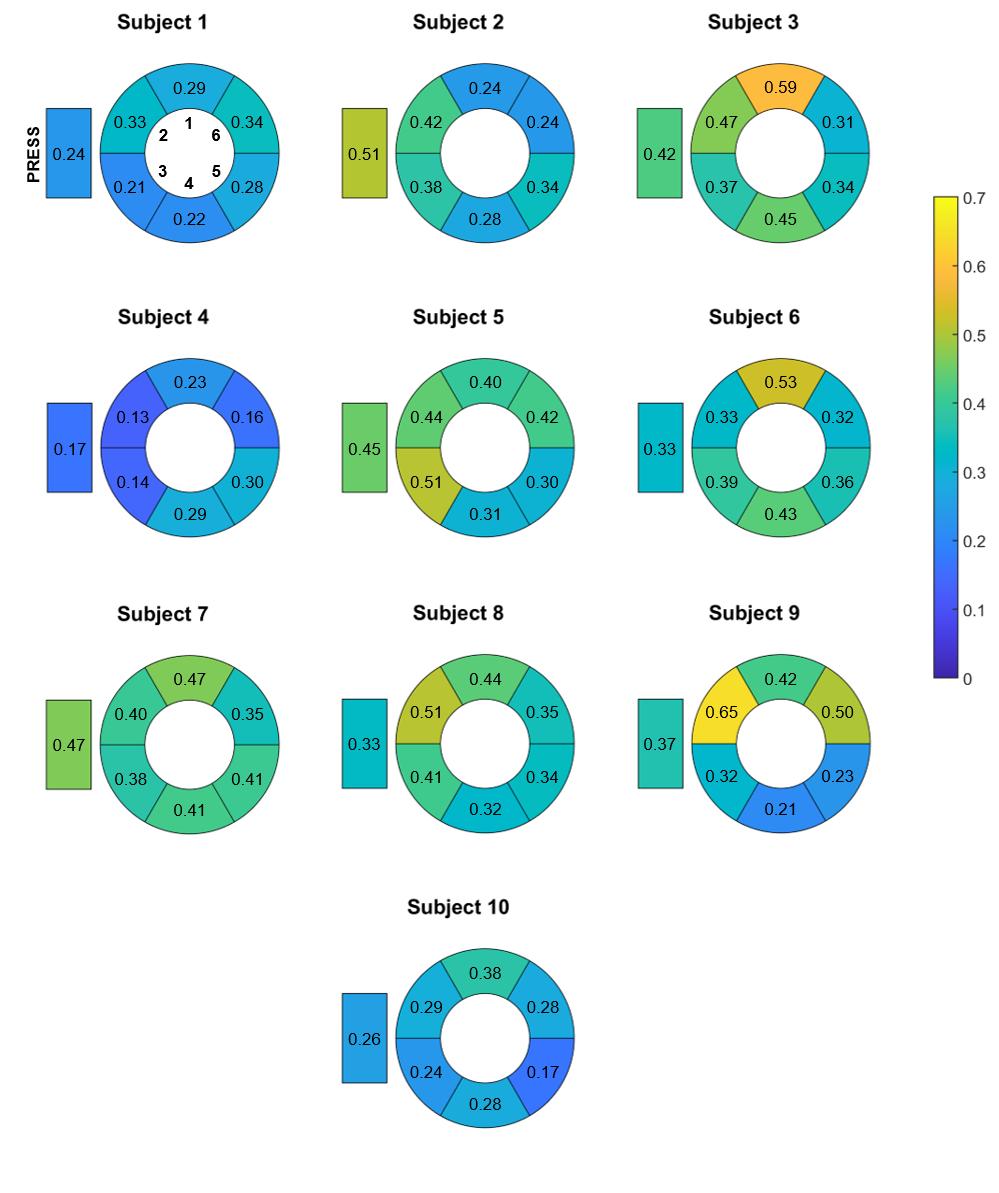
Data was reconstructed in MATLAB using customized reconstruction pipelines implemented in ReconFrame (GyroTools LLC, Winterthur, Switzerland). For analysis of EPSI data, the heart was divided into six segments. Care was taken not to include epicardial fat when drawing the epicardial contours.
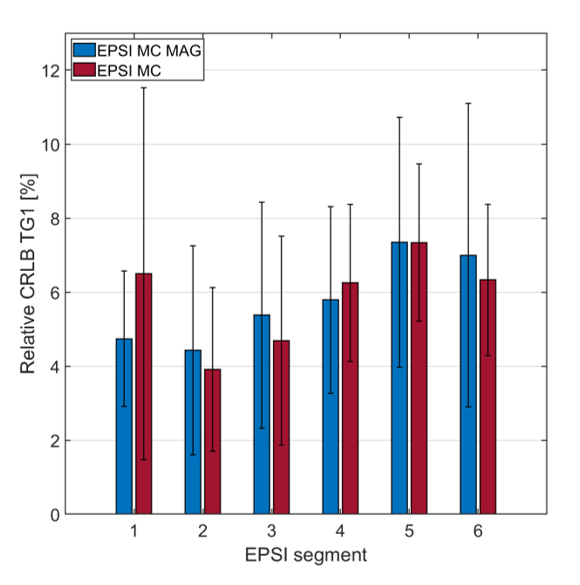
All spectra were fitted in the time-domain using AMARES13 (jMRUI14) using five resonances: triglycerides at 0.88, 1.28 and 2.1 ppm, creatine (CR) at 3.03 ppm and trimethylammonium (TMA) at 3.2 ppm. TG/W ratios were calculated and T1 and T2 correction applied. Relative Cramér-Rao lower bounds were calculated for the triglyceride signal at 1.28 ppm for all segments of both conventional metabolite-cycled EPSI and metabolite-cycled EPSI with motion-adapted gating and weighted acquisition.
Results
Scan time was 8.05 ± 2.06 min for metabolite-cycled EPSI with and 17.91 ± 3.93 min for metabolite-cycled EPSI without motion-adapted gating and weighted acquisition. Figure 3 compares the relative Cramér-Rao Lower Bounds of the main triglyceride peak at 1.28 ppm (TG1) between metabolite-cycled EPSI with and without motion-adapted gating and weighted acquisition for all cardiac segments. No significant differences were found between the two EPSI methods for any of the segments. Exemplary spectra of all six EPSI segments for both EPSI methods together with the PRESS spectrum of the same subject are shown in Figure 4 for comparison. Although SNR is lower for EPSI compared to PRESS, myocardial TG can be detected in all EPSI regions. Figure 5 shows the distribution of the TG/W ratios acquired using EPSI with motion-adapted gating and weighted acquisition over the cardiac segments for all subjects, together with the ratios acquired using PRESS. No specific trend regarding TG/W distribution over the different segments is being observed.Discussion
Metabolite-cycled EPSI has a number of advantages over water-suppressed EPSI. First, the total exam time is shorter as no additional reference scan is required. In water-suppressed EPSI a B0-map is calculated based on the reference water scan and a B0 correction based on this map is applied to all water-suppressed averages. Using metabolite-cycled EPSI, the B0 shift can be calculated for every single average individually, which leads to improved B0 correction. Finally, phasing in metabolite-cycled EPSI can be performed on the high-SNR water signal as opposed to the low-SNR TG signal in water-suppressed EPSI.A limitation of cardiac EPSI in general is the potential contamination of target segments with adjacent epicardial fat. Accordingly, segments were chosen carefully to avoid tissue interfaces and partial volume voxels. While TG/W could be detected using the proposed method, SNR remains limited and resonances other than TG could not be reliably assigned.
Conclusion
Metabolite-cycled EPSI with motion-adapted gating and weighted acquisition allows detecting triglyceride-to-water ratios in different regions of the in-vivo human heart with a scan time of less than 10 minutes.Acknowledgements
No acknowledgement found.References
1. van Ewijk PA, Schrauwen-Hinderling VB, Bekkers SCAM, Glatz JFC, Wildberger JE, Kooi ME. MRS: a noninvasive window into cardiac metabolism. NMR Biomed. 2015;28:747–766.
2. den Hollander JA, Evanochko WT, Pohost GM. Observation of Cardiac Lipids in Humans by Localized 1H Magnetic Resonance Spectroscopic Imaging. Magn. Reson. Med. 1994;32:175–180.
3. Weiger M, Börnert P, Proksa R, Schäffter T, Haase A. Motion-Adapted Gating Based on k-Space Weighting for Reduction of Respiratory Motion Artifacts. Magn. Reson. Med. 1997;38:322–333.
4. Pohmann R, Von Kienlin M. Accurate Phosphorus Metabolite Images of the Human Heart by 3D Acquisition-Weighted CSI. Magn. Reson. Med. 2001;45:817–826.
5. Dreher W, Leibfritz D. New Method for the Simultaneous Detection of Metabolites and Water in Localized in vivo 1H Nuclear Magnetic Resonance Spectroscopy. Magn. Reson. Med. 2005;54:190–195.
6. Hwang T-L, van Zijl PCM, Garwood M. Asymmetric Adiabatic Pulses for NH Selection. J. Magn. Reson. 1999;138:173–177.
7. MacMillan EL, Chong DGQ, Dreher W, Henning A, Boesch C, Kreis R. Magnetization Exchange With Water and T1 Relaxation of the Downfield Resonances in Human Brain Spectra at 3.0 T. Magn. Reson. Med. 2011;65:1239–1246.
8. Fillmer A, Hock A, Cameron D, Henning A. Non-Water-Suppressed 1H MR Spectroscopy With Orientational Prior Knowledge Shows Potential for Separating Intra- and Extramyocellular Lipid Signals in Human Myocardium. Sci. Rep. 2017;7:16898.
9. Peereboom SM, Gastl M, Fuetterer M, Kozerke S. Navigator‐free metabolite‐cycled proton spectroscopy of the heart. Magn. Reson. Med. 2020;83:795–805.
10. Weiss K, Martini N, Boesiger P, Kozerke S. Metabolic MR Imaging of Regional Triglyceride and Creatine Content in the Human Heart. Magn. Reson. Med. 2012;68:1696–1704.
11. de Graaf RA, Sacolick LI, Rothman DL. Water and Metabolite-Modulated MR Spectroscopy and Spectroscopic Imaging. In: Proceedings of the 14th Annual Meeting of ISMRM. Seattle, Washington, USA; 2006. p. 3063.
12. Weiss K, Summermatter S, Stoeck CT, Kozerke S. Compensation of Signal Loss Due to Cardiac Motion in Point-Resolved Spectroscopy of the Heart. Magn. Reson. Med. 2014;72:1201–1207.
13. Vanhamme L, van den Boogaart A, Van Huffel S. Improved Method for Accurate and Efficient Quantification of MRS Data with Use of Prior Knowledge. J. Magn. Reson. 1997;129:35–43.
14. Naressi A, Couturier C, Devos JM, et al. Java-based graphical user interface for the MRUI quantitation package. Magn. Reson. Mater. Physics, Biol. Med. 2001;12:141–152.
Figures