0022
Non-ECG-triggered, free-breathing simultaneous T1, T2, T2*, and fat-fraction quantification in the myocardium with MR Multitasking1Cedars Sinai Medical Center, Los Angeles, CA, United States, 2University of California, Los Angeles, Los Angeles, CA, United States, 3Radiology Department, Stanford University, Stanford, CA, United States, 4Department of Imaging and Cardiology, Cedars Sinai Medical Center, Los Angeles, CA, United States
Synopsis
Myocardium tissue characterization with multi-parametric mapping has gained increased clinical interest. Conventional methods require multiple breath-holding, ECG-triggered scans, which may result in potential image misregistration and patient fatigue. In this work, a free-breathing, non-ECG-triggered approach for simultaneous myocardial T1/T2/T2*/FF (fat-fraction) mapping is presented. Quantitative measurements from the proposed technique agreed with those from single-parameter references.
Introduction
Myocardial tissue characterization using T1, T2, and T2* mapping is used in the diagnosis and prognostication of myocardial infarction (MI), myocarditis, and thalassemia major1-3. Myocardial fat has been associated with chronic MI and heart failure and is implicated in cardiac arrhythmia4-6. Conventional protocols for tissue characterization require serial ECG-triggered, breath-holding scans, potentially leading to misaligned maps and patient discomfort.MR Multitasking has provided a free-breathing, non-ECG triggered alternative to simultaneous myocardial T1/T2 mapping7, 8, and the framework has been further extended to T2* mapping in brain and liver9, 10. However, a direct translation of previous T1/T2/T2* techniques to the heart has been hindered by insufficient temporal resolution and imaging efficiency, leading to potential motion artifacts and prolonged scan time. To overcome these limitations, we propose a variable $$$T_R$$$ (VTR) approach for free-breathing, non-ECG-triggered myocardial T1/T2/T2*/FF (fat-fraction) mapping.
Methods
Sequence diagramThe sequence diagram is shown in Fig. 1A. Different T2prep/IR (T2IR) modules were interleaved and followed by multi-echo FLASH readouts. Two datasets were collected: training data were repeatedly acquired at 0° radial spoke for temporal information; radial imaging data acquisition was incremented by the golden angle for spatial information. Fig. 1B shows the multi-echo readout module used previously for Multitasking T2* mapping9, 10, where a constant $$$T_R$$$ (CTR) was used for both training and imaging data. The VTR approach used in this work is shown in Fig. 1C, where training data only collected a single-echo readout to improve temporal resolution and imaging efficiency.
Imaging model
The underlying image series can be modeled as a low-rank tensor with one combined spatial dimension, and five temporal dimensions encoding different combinations of T2IR preparation duration, inversion time, echo time, respiratory motion state, and cardiac motion state. The image can be effectively reconstructed by exploiting the spatial-temporal correlations11 as described previously7.
MR experiments
Twelve healthy volunteers were scanned on a 3T scanner with an 18-channel body coil. VTR Multitasking parameters include FA=5°, FOV=270x270mm2, slice thickness=8mm, spatial resolution=1.7x1.7mm2, TR/TE1/ΔTE=16.6ms/1.6ms/1.3ms for imaging data (11 echoes), TR/TE=3.6ms/1.6ms for training data, 3 short-axis slices, scan time=2.5 min/slice. Reference 2D T1 maps with MOLLI, T2 maps with T2-prep FLASH, T2* maps with multi-echo GRE (FA=20°), and FF maps with 6-point Dixon GRE (FA=5°) were acquired at diastolic phase and end-expiration breath-hold. Parametric maps were also acquired using CTR Multitasking (with identical scan time and parameters as VTR, except that TR/TE1/ΔTE=16.6ms/1.6ms/1.3ms was used for both imaging and training data) at the mid-ventricular slice for comparison against VTR Multitasking.
Image analysis
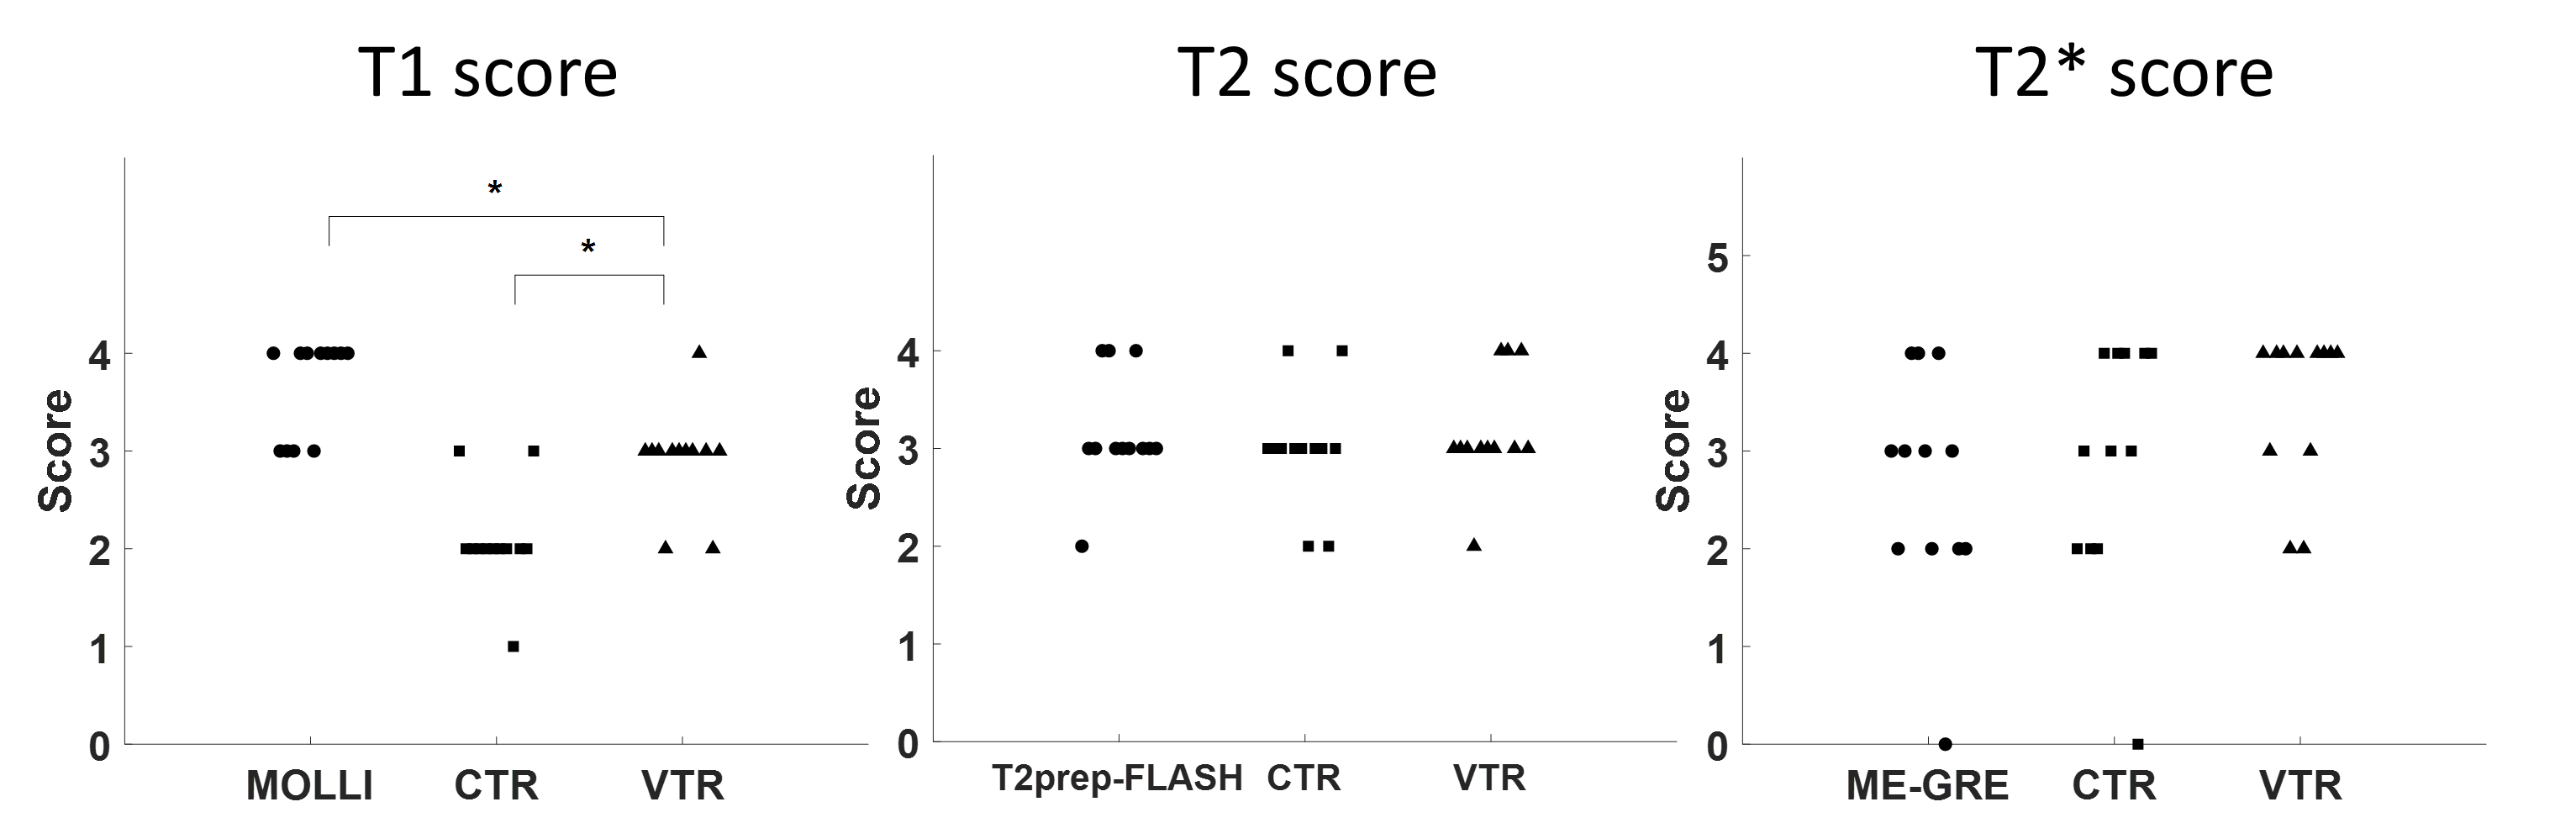
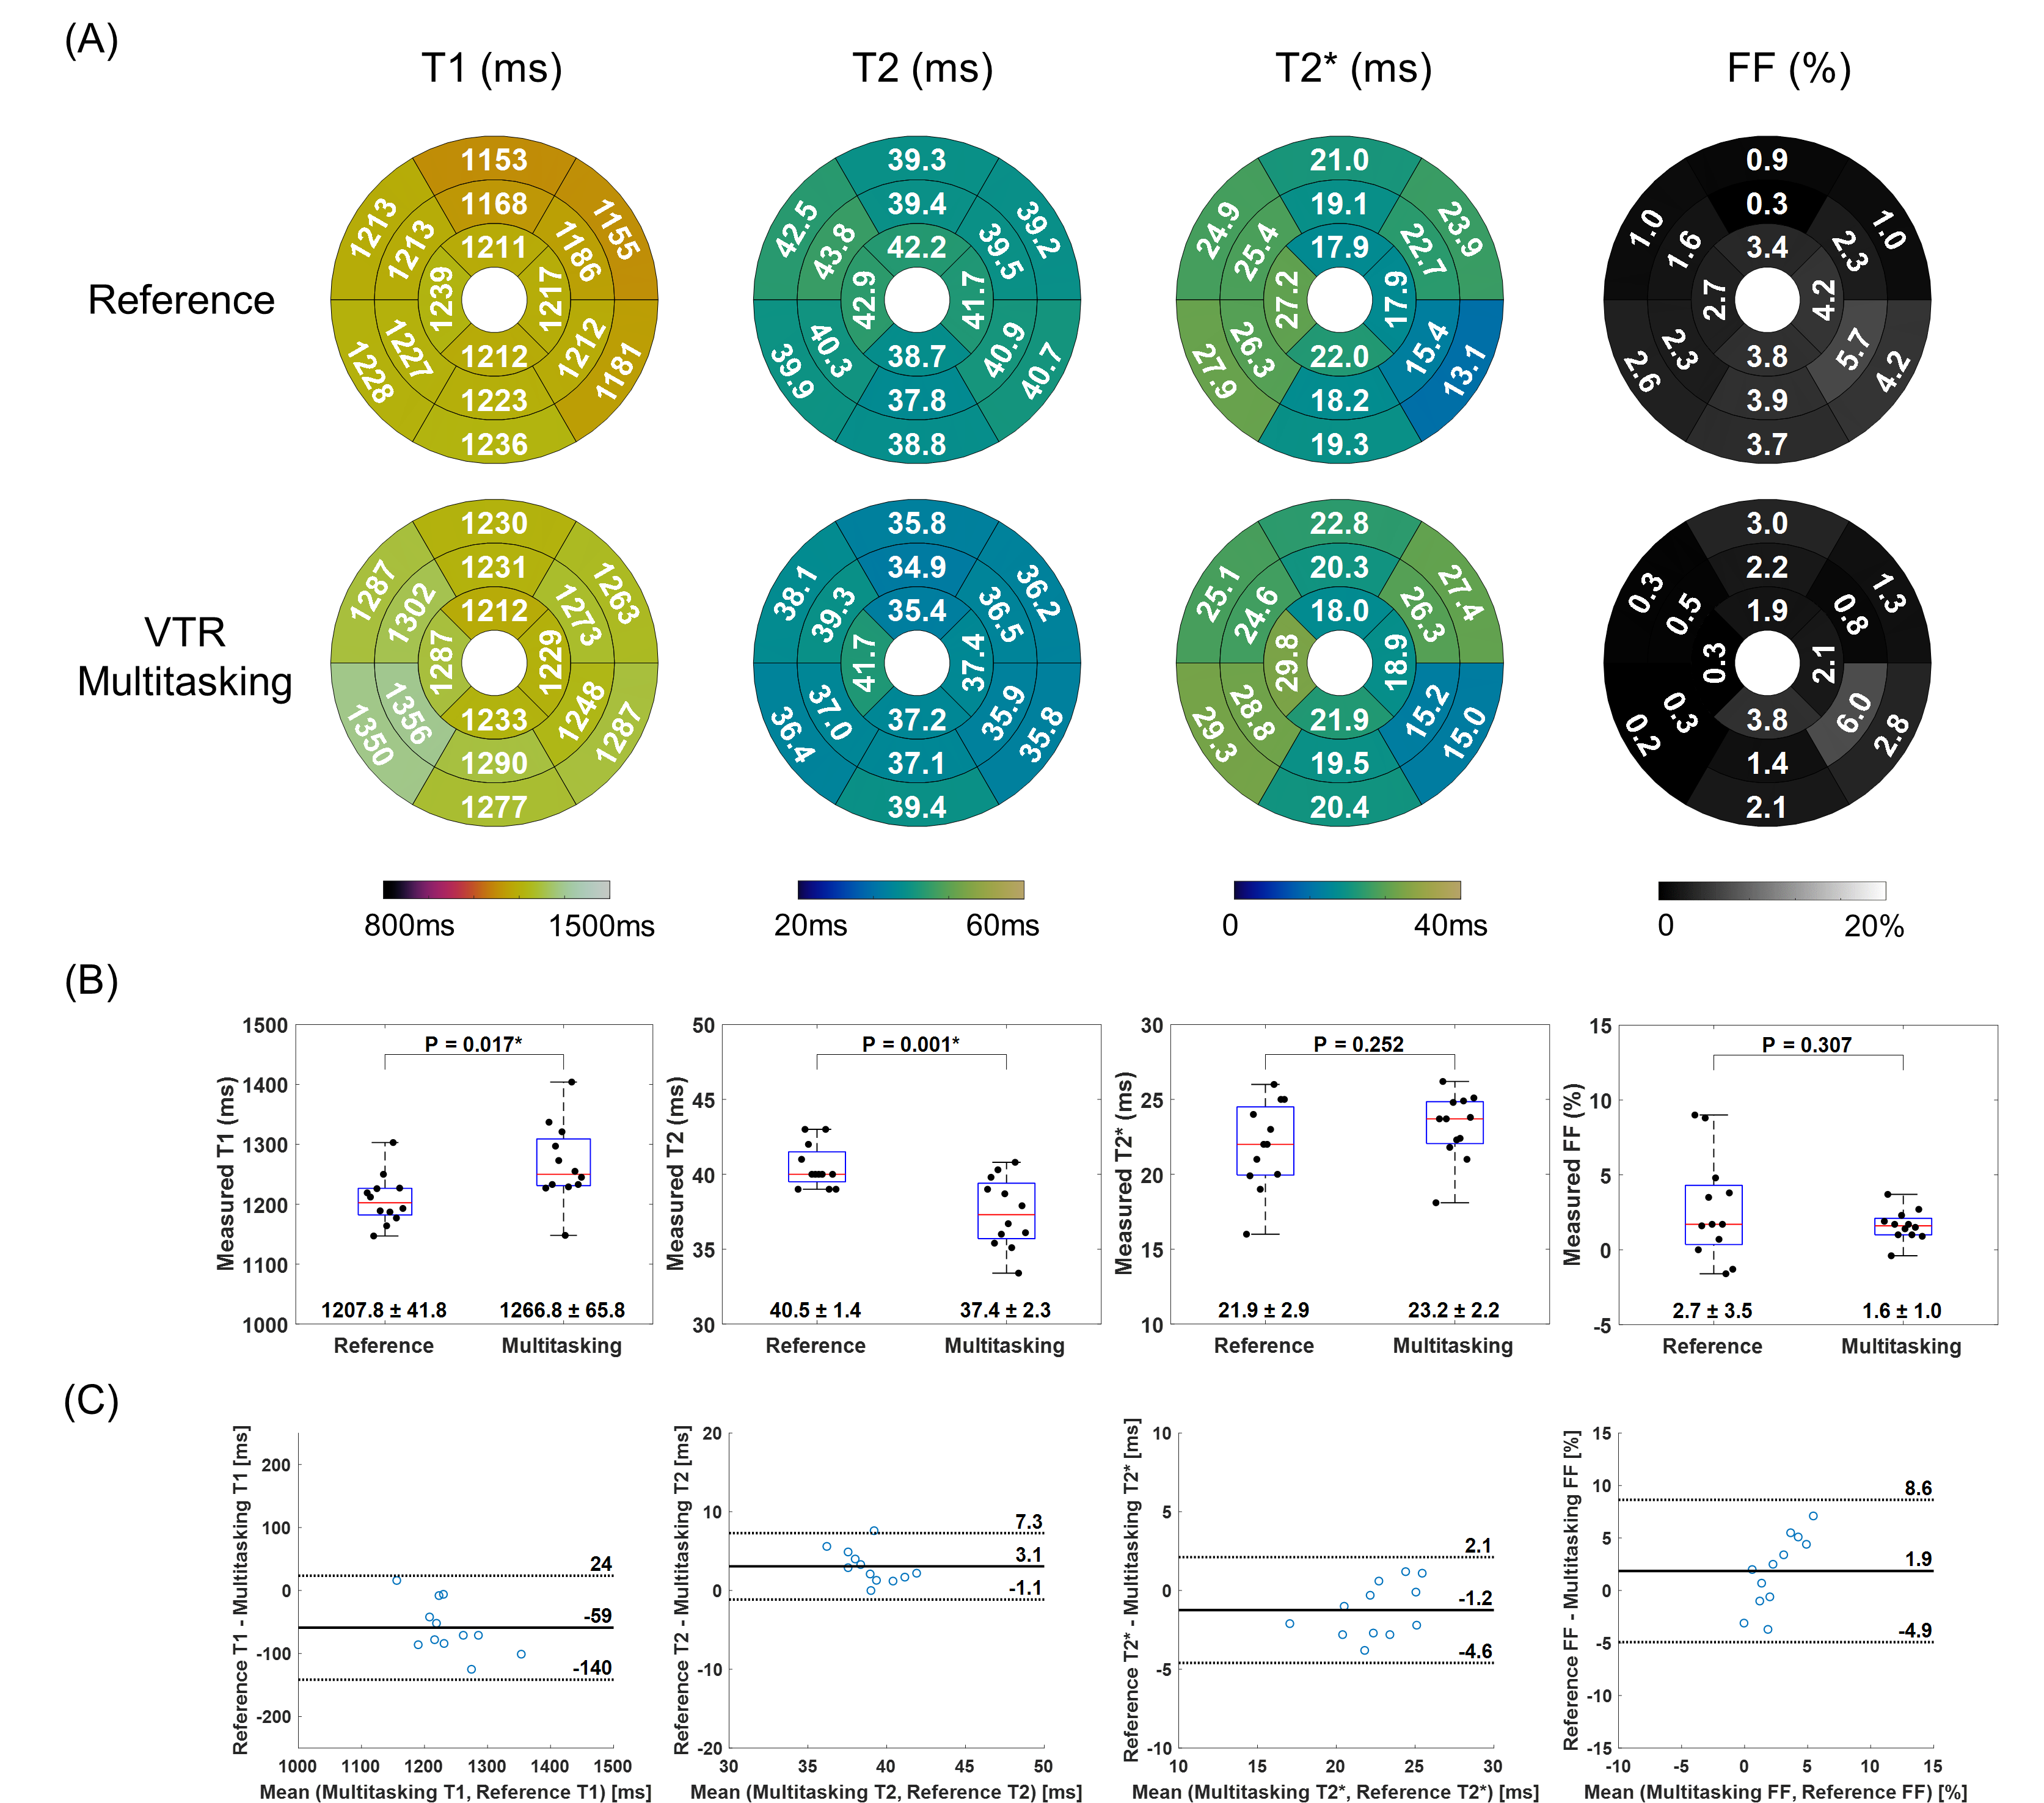
The in-vivo mid-ventricular maps from different methods (reference, VTR Multitasking, and CTR Multitasking) were blinded and assessed by an imaging cardiologist (A.C.K.). The T1 and T2 maps were scored based on a 4-point grading system12(1, uninterpretable; 2, poor; 3, acceptable; 4 excellent), and the T2* maps were scored based on a 5-point grading system13(0, unusable; 1, poor; 2, average; 3, good; 4, very good; 5, excellent). The map quality of proposed VTR Multitasking were compared to those of reference and CTR Multitasking using Wilcoxon signed-rank test. The in-vivo reference and VTR Multitasking maps were segmented in CVI 42 (Circle Cardiovascular Imaging, Calgary, Alberta, Canada) using AHA 16-segment model14 and the results were visualized using bullseye plots. Student’s t-test was performed on average T1/T2/T2*/FF measurements to test for significant differences between VTR Multitasking and references. The agreement was assessed using Bland-Altman analysis.
Results
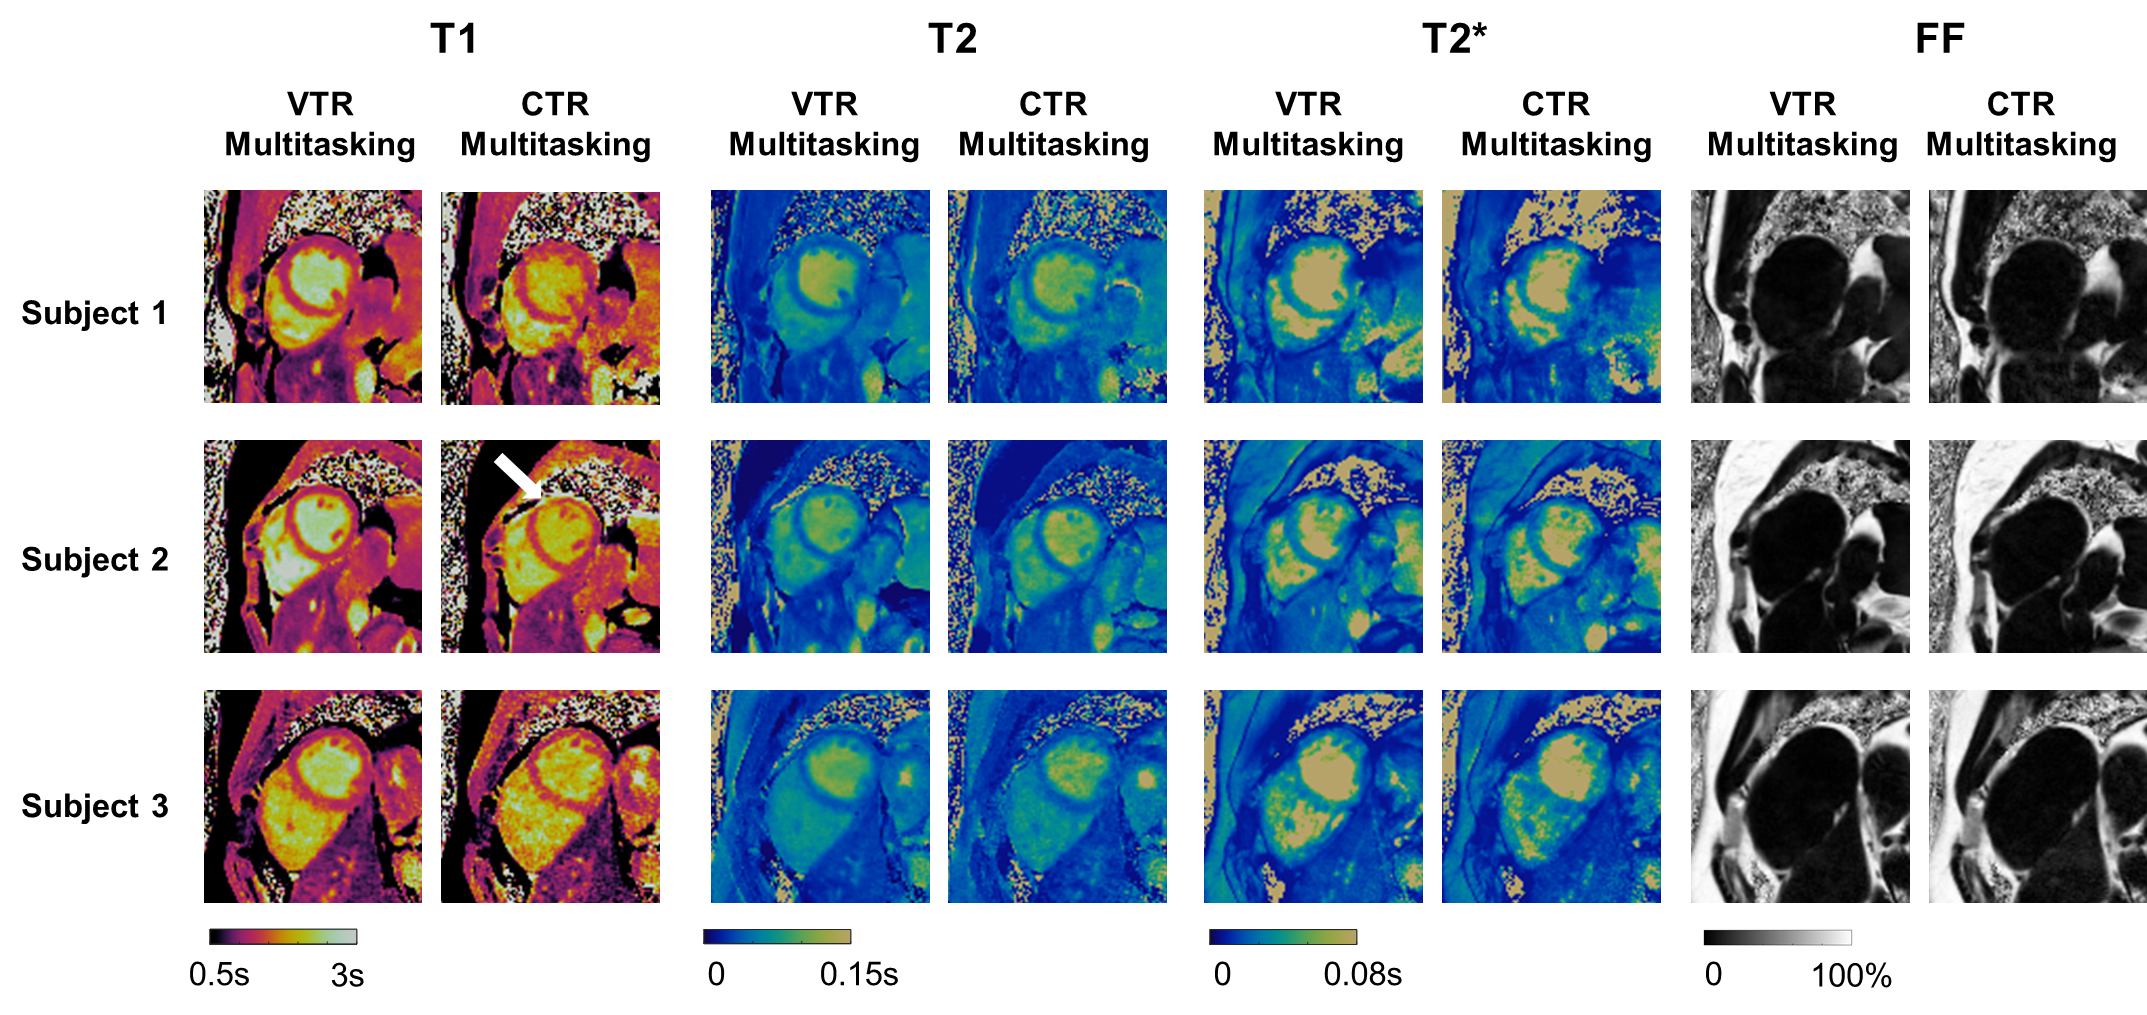
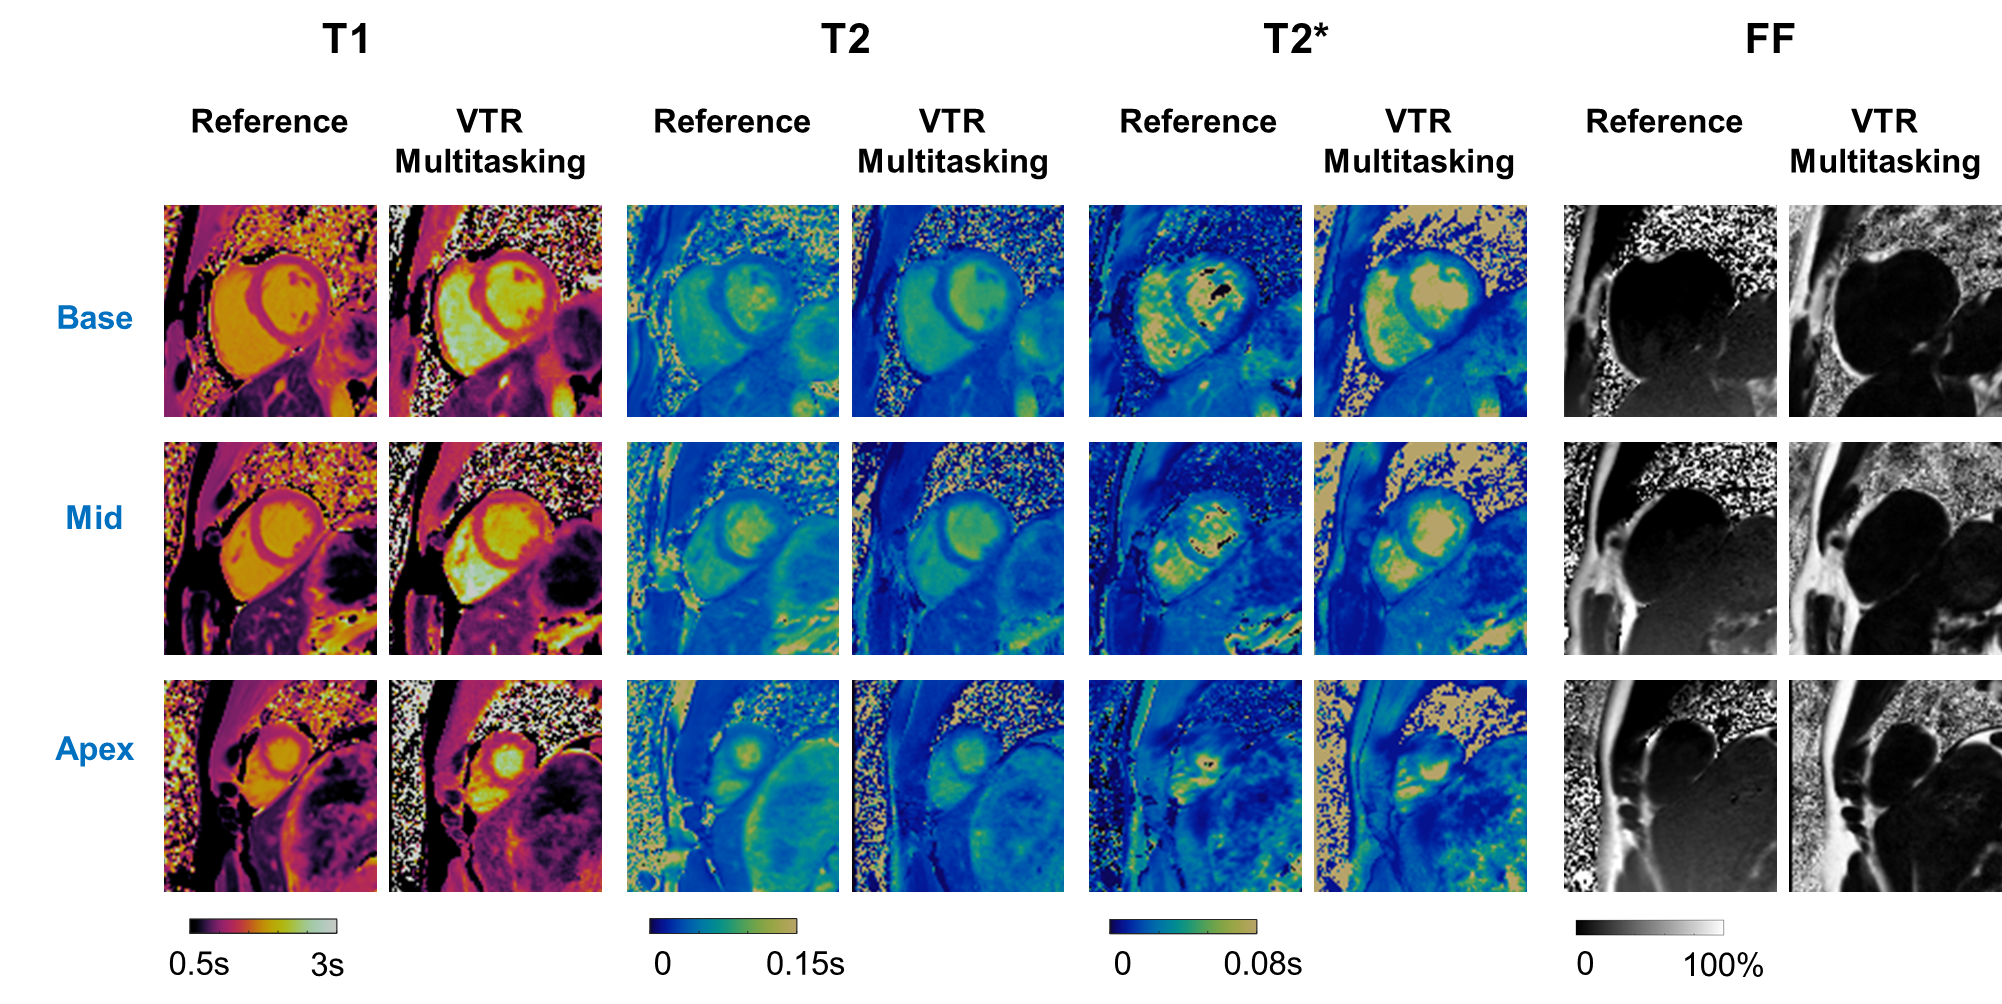
Fig. 2 shows the comparison between VTR Multitasking and CTR Multitasking on three healthy volunteers, where T1 and T2 maps from CTR had lower image quality and visible artifacts (as indicated by white arrow). The image quality scores in Fig. 3 show VTR Multitasking had significantly better (P=0.008) T1 map quality (median score: 3) than that of CTR Multitasking (median score: 2). No significant difference was found between T2 (P=0.766) and T2* (P=0.371) map quality scores of VTR and CTR Multitasking.Fig. 4 shows mapping results on a healthy volunteer, where VTR Multitasking generated co-registered maps that resembled the reference ones. As shown in Fig. 3, the T1 map quality scores of VTR Multitasking were significantly lower than those of the MOLLI (P=0.008), whereas no significant difference was found between T2 (P=1.000) and T2* (P=0.125) map quality scores of VTR Multitasking and references. Average value in each segment is shown in Fig. 5A. Paired t-tests in Fig. 5B indicated small but significant differences between T1 and T2 measurements of VTR Multitasking and references, yet Multitasking measurements were still within or close to the literature range12, 13, 15-19. The Bland-Altman plot in Fig. 5C shows agreement with references.
Discussion and Conclusion
In this work, we presented a non-ECG-triggered, free-breathing technique for T1/T2/T2*/FF mapping in a single 2.5-min scan. The technique used a VTR approach to preserve temporal resolution and imaging efficiency, which showed a significant improvement in image quality. Although T1 map quality was still lower than that of MOLLI, VTR had raised the median image quality of Multitasking from “poor” to “acceptable” and had unique advantages in resolving motion. The statistical analysis demonstrated that the measurements from the proposed technique agreed with those from the references. Scan time may be further reduced using Deep Learning and further clinical validations need to be performed.Acknowledgements
This work was partially supported by the National Institutes of Health (Grant/Award Nos. R01EB028146 and R01HL156818). Anthony G. Christodoulou and Debiao Li contributed equally to this work. We acknowledge the use of the Fat-Water Toolbox (http://ismrm.org/workshops/FatWater12/data.htm) for some of the results shown in this abstract.
References
1. Giri S, Chung YC, Merchant A, et al. T2 quantification for improved detection of myocardial edema. J Cardiovasc Magn Reson. Dec 30 2009;11:56. doi:10.1186/1532-429X-11-56
2. Messroghli DR, Walters K, Plein S, et al. Myocardial T-1 mapping: Application to patients with acute and chronic myocardial infarction. Magn Reson Med. Jul 2007;58(1):34-40. doi:10.1002/mrm.21272
3. Pennell DJ, Udelson JE, Arai AE, et al. Cardiovascular Function and Treatment in -Thalassemia Major: A Consensus Statement From the American Heart Association. Circulation. Jul 16 2013;128(3):281-308. doi:10.1161/CIR.0b013e31829b2be6
4. Goldfarb JW, Roth M, Han J. Myocardial Fat Deposition after Left Ventricular Myocardial Infarction: Assessment by Using MR Water-Fat Separation Imaging. Radiology. Oct 2009;253(1):65-73. doi:10.1148/radiol.2532082290
5. Kenchaiah S, Ding J, Carr JJ, et al. Pericardial Fat and the Risk of Heart Failure. J Am Coll Cardiol. Jun 1 2021;77(21):2638-2652. doi:10.1016/j.jacc.2021.04.003
6. Ernault AC, Meijborg VMF, Coronel R. Modulation of Cardiac Arrhythmogenesis by Epicardial Adipose Tissue: JACC State-of-the-Art Review. J Am Coll Cardiol. Oct 26 2021;78(17):1730-1745. doi:10.1016/j.jacc.2021.08.037
7. Christodoulou AG, Shaw JL, Nguyen C, et al. Magnetic resonance multitasking for motion-resolved quantitative cardiovascular imaging. Nat Biomed Eng. Apr 2018;2(4):215-226. doi:10.1038/s41551-018-0217-y
8. Shaw JL, Yang Q, Zhou Z, et al. Free-breathing, non-ECG, continuous myocardial T1 mapping with cardiovascular magnetic resonance multitasking. Magn Reson Med. Apr 2019;81(4):2450-2463. doi:10.1002/mrm.27574
9. Cao T, Ma S, Wang N, et al. Three-dimensional simultaneous brain mapping of T1, T2, T 2 * and magnetic susceptibility with MR Multitasking. Magn Reson Med. Oct 27 2021;doi:10.1002/mrm.29059
10. Wang N, Cao T, Han F, et al. Free-breathing multitasking multi-echo MRI for whole-liver water-specific T1 , proton density fat fraction, and R 2 * quantification. Magn Reson Med. Aug 21 2021;doi:10.1002/mrm.28970
11. Liang Z-P. Spatiotemporal imagingwith partially separable functions. IEEE; 2007:988-991.
12. Jaubert O, Cruz G, Bustin A, et al. Water-fat Dixon cardiac magnetic resonance fingerprinting. Magn Reson Med. Jun 2020;83(6):2107-2123. doi:10.1002/mrm.28070
13. Alam MH, Auger D, McGill LA, et al. Comparison of 3 T and 1.5 T for T2* magnetic resonance of tissue iron. J Cardiovasc Magn Reson. Jul 8 2016;18(1):40. doi:10.1186/s12968-016-0259-9
14. Cerqueira MD, Weissman NJ, Dilsizian V, et al. Standardized myocardial segmentation and nomenclature for tomographic Imaging of the heart - A statement for healthcare professionals from the Cardiac Imaging Committee of the Council on Clinical Cardiology of the American Heart Association. Int J Cardiovas Imag. Feb 2002;18(1):539-542.
15. Fischer K, Yamaji K, Luescher S, et al. Feasibility of cardiovascular magnetic resonance to detect oxygenation deficits in patients with multi-vessel coronary artery disease triggered by breathing maneuvers. Journal of Cardiovascular Magnetic Resonance. May 7 2018;20doi:ARTN 3110.1186/s12968-018-0446-y
16. Gottbircht M, Kramer CM, Salerno M. Native T1 and Extracellular Volume Measurements by Cardiac MRI in Healthy Adults: A Meta-Analysis. Radiology. Feb 2019;290(2):317-326. doi:10.1148/radiol.2018180226
17. Liu CY, Redheuil A, Ouwerkerk R, Lima JA, Bluemke DA. Myocardial fat quantification in humans: Evaluation by two-point water-fat imaging and localized proton spectroscopy. Magn Reson Med. Apr 2010;63(4):892-901. doi:10.1002/mrm.22289
18. Roy C, Slimani A, de Meester C, et al. Age and sex corrected normal reference values of T1, T2 T2* and ECV in healthy subjects at 3T CMR. J Cardiovasc Magn Reson. Sep 21 2017;19(1):72. doi:10.1186/s12968-017-0371-5
19. von Knobelsdorff-Brenkenhoff F, Prothmann M, Dieringer MA, et al. Myocardial T-1 and T-2 mapping at 3 T: reference values, influencing factors and implications. Journal of Cardiovascular Magnetic Resonance. Jun 18 2013;15doi:Artn 5310.1186/1532-429x-15-53
Figures
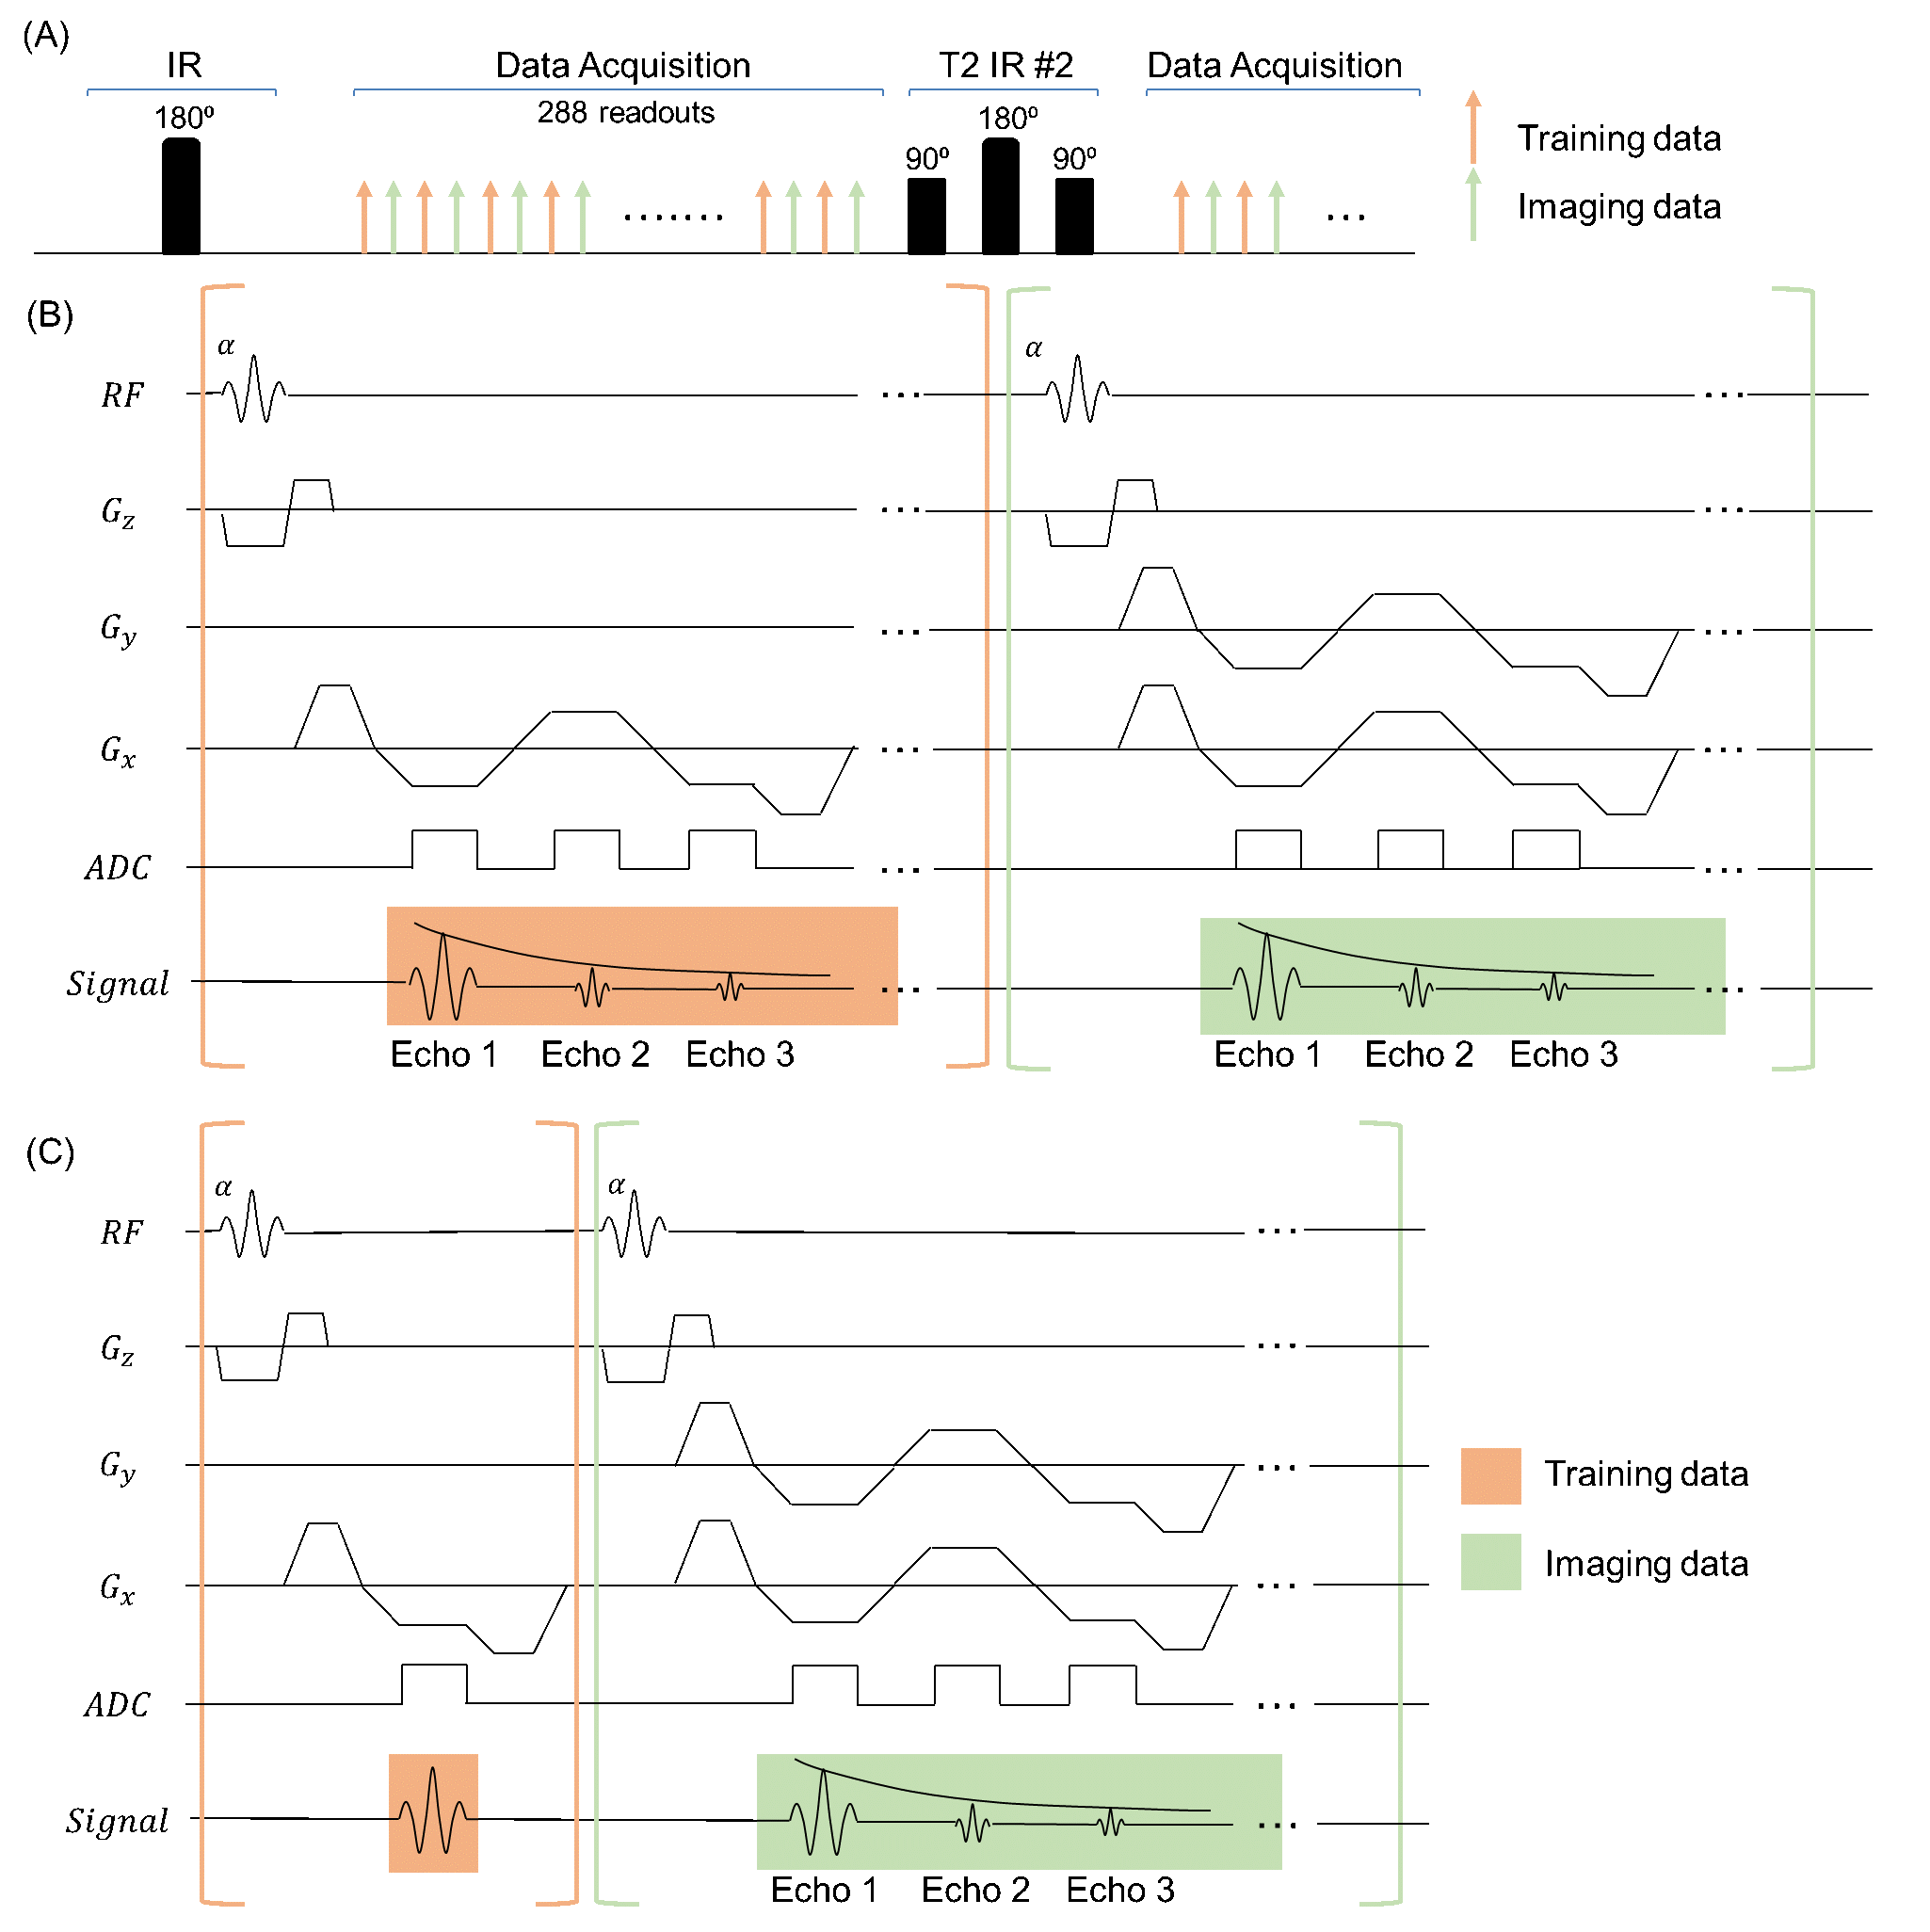
Figure 1. (A) Sequence diagram. T2IR preparation modules were followed by multi-echo FLASH readouts, which alternated between training and imaging acquisitions. (B) FLASH readout module used in CTR Multitasking, where training and imaging data readout had same $$$T_R$$$. (C) FLASH readout module used in VTR multitasking, where training data only collected a single-echo readout and imaging data collected a multi-echo readout.