0013
How vascular properties affect the BOLD contrast across cortical depth.
Wouter Schellekens1, Alex Bhogal1, Emiel Roefs1, Mario Báez-Yáñez1, Jeroen Siero1, and Natalia Petridou1
1UMC Utrecht, Utrecht, Netherlands
1UMC Utrecht, Utrecht, Netherlands
Synopsis
In the current study, we quantify vascular properties in relation to laminar BOLD fMRI signals for differently sized vascular compartments across cortical depth. Using hypercapnic and hyperoxic breathing conditions, while measuring from macro- and micro-vascular compartments, we estimate effects of dilation capacity, theoretical maximum signal intensity, and relative change in cerebral blood volume on laminar BOLD contrasts. We show that enlarged signals for larger pial veins are mainly caused by their capacity for dilation. BOLD signal differences between macro- and micro-vascular compartments are not likely caused by differences in theoretical maximum signal intensity, or relative changes in cerebral blood volume.
Introduction
With advancements in ultra-high field 7 Tesla functional MRI (fMRI), human cortical activity can now be measured at a spatial resolution of laminar detail(1). The most commonly used fMRI contrast, the Gradient-Echo (GE) Blood-Oxygen-Level Dependent (BOLD) contrast, is regularly used to measure brain activity due to its superior sensitivity, which becomes an even greater asset for measurements at laminar resolutions. However, the GE-BOLD fMRI signal scales with vessel diameter, making it relatively more sensitive to larger (draining) veins that predominantly reside near the pial surface(2,3). Furthermore, it is not fully understood how different vascular properties contribute to the increased GE-BOLD signal near larger vessels. In the current study, we quantify how the fMRI BOLD signal is dependent on its capacitary for dilation (cerebrovascular reactivity, CVR), its theoretical maximum signal due to oxygen saturation (M-scaling), and the relative change in cerebral blood volume (ΔCBV). Different vascular conditions are evoked by obtaining hypercapnic and hyperoxic conditions, following breathable gas challenges (CO2 and O2, respectively), while measuring BOLD fMRI signals in human visual cortex from macro- and micro-vascular compartments (GE-BOLD and Spin-Echo (SE) BOLD, respectively).Methods
Eleven healthy volunteers (female=8, mean age=24.3 years) participated in a 7 Tesla fMRI session, while performing hypercapnic (CO2) and hyperoxic (O2) breathing challenges (Respiracttm). BOLD signals were recorded using a gradient-echo (GE, resolution=1x1x1mm, TR/TE=850/27ms, FA=50°, FOV=128x128x7mm), and spin-echo (SE, resolution=1.5x1.5x1.5 mm, TR/TE=850/50ms, FA=90°, FOV=190x190x7.5mm) EPI scan sequences. The gas conditions consisted of a 2-minute increase in end-tidal pressure CO2 (+3, +5, +8, and +10 mmHg) and O2 (+350 mmHg), preceded by a baseline of normal air. The CVR was calculated as the linear slope of the increase in BOLD signal following the hypercapnic conditions(4,5). The M-scaling factor was calculated following the hyperoxic breathing condition(6), whereas the ΔCBV was estimated using the M-scaling and hypercapnic conditions. On the basis of a T1-weighted anatomical scan, a cortical depth estimate was obtained using LayNii(7). Large pial veins were estimated using Nighres(8) and Braincharter on T2*-weighted anatomical scans. Finally, early visual cortex was segmented using neuropythy(9) (Figure 1).Results
Following the hypercapnic conditions (Figure 2), an increase in CVR towards the superficial layers was particularly apparent for the GE scan sequence, (F(1,10.0) = 17.02 p = .002). (Figure 3). Deeper cortical layers showed on average a CVR estimate of CVR = 0.39 for GE (95% CI = [0.28, 0.50]) and CVR = 0.18 for SE (95% CI = [0.13, 0.23]), whereas the superficial cortical layers exhibited CVR estimates of CVR = 0.64 for GE (95% CI = [0.50, 0.79]) and CVR = 0.25 for SE (95% CI = [0.20, 0.31]). Thus, the increase in CVR across cortical depth is over a factor of 3 larger for the macro-vasculature than the micro-vasculature. The M-scaling parameter increased strongly across cortical depth, peaking near the GM/CSF border (F(1,10.0) = 75.79, p < .001). However, a difference between scan sequences was not observed (F(1,9.9) = 0.54, p = .479; Figure 4). Lastly, we observed a difference in ΔCBV effect during hypercapnia levels for the different scan sequences (F(1,9.3) = 8.61, p = .016), indicating that a ΔCBV increase is approximately 1.35 times larger for GE (mean %ΔCBV = 10.1, 95% CI = [8.1, 12.2]), compared to SE (mean %ΔCBV = 7.4, 95% CI = [6.5, 8.2]). We did not observe a difference in ΔCBV across cortical depth (F(1,15.5) = 0.23, p = .637), meaning that the relative ΔCBV increase was approximately uniform across cortical depth (Figure 5).Discussion
In the current study, we quantify different vascular effects measured from macro- and micro-vascular organization on laminar fMRI BOLD signals. We find that increasing levels of hypercapnia result in increasing percent signal changes for both the macro- and micro-vasculature. However, the effect of hypercapnia on the BOLD signal is strongly dependent on cortical depth, as well as the different vascular compartments from which the signal originates. This effect is signified by the increasing CVR across cortical depth as sampled from the macro-vasculature. The CVR of the macro-vasculature was approximately three times larger than CVR estimates from the micro-vasculature, which did not show significant differences in dilation capacity across cortical depth. On the basis of the hyperoxia condition, we find that M-scaling values increase strongly from deeper to more superficial layers. This trend was observed for both the micro- and macro-vasculature, albeit that the trend is steeper for the macro-vasculature. Finally, we observed that increased levels of hypercapnia lead to an increase in ΔCBV, which is significantly more pronounced in the macro- versus the micro-vasculature. We did not observe that the relative change in CBV differs across cortical depth.Conclusion
By quantification of vasoactive properties, the current study reveals that the increase in fMRI BOLD contrast observed around larger vessels particularly stems from a difference in dilation capacity, which was three times larger for the macro- versus the micro-vasculature. Alternatively, the theoretical maximum signal intensity, M-scaling, did not differ on the basis of vascular compartment size. Also the relative change in CBV did not increase differently for higher concentrations of larger veins near the pial surface, but was approximately constant across cortical depth.Acknowledgements
This work was supported by a grant from the National Institute of Health under Award Number RO1MH111417References
1. Lawrence SJD, Formisano E, Muckli L, de Lange FP. Laminar fMRI: Applications for cognitive neuroscience. Neuroimage 2019;197:785–791 doi: 10.1016/j.neuroimage.2017.07.004. 2. Goense J, Bohraus Y, Logothetis NK. fMRI at high spatial resolution implications for BOLD-models. Front. Comput. Neurosci. 2016;10:1–13 doi: 10.3389/fncom.2016.00066. 3. Duvernoy HM, Delon S, Vannson JL. Cortical blood vessels of the human brain. Brain Res. Bull. 1981;7:519–579 doi: 10.1016/0361-9230(81)90007-1. 4. Poublanc J, Crawley AP, Sobczyk O, et al. Measuring cerebrovascular reactivity: The dynamic response to a step hypercapnic stimulus. J. Cereb. Blood Flow Metab. 2015;35:1746–1756 doi: 10.1038/jcbfm.2015.114. 5. Bhogal AA, Philippens MEP, Siero JCW, et al. Examining the regional and cerebral depth-dependent BOLD cerebrovascular reactivity response at 7T. Neuroimage 2015;114:239–248 doi: 10.1016/j.neuroimage.2015.04.014. 6. Chiarelli PA, Bulte DP, Wise R, Gallichan D, Jezzard P. A calibration method for quantitative BOLD fMRI based on hyperoxia. Neuroimage 2007;37:808–820 doi: 10.1016/j.neuroimage.2007.05.033. 7. Huber L (Renzo) R, Poser BA, Bandettini PA, et al. LayNii: A software suite for layer-fMRI. Neuroimage 2021;237:118091 doi: 10.1016/j.neuroimage.2021.118091. 8. Huntenburg JM, Steele CJ, Bazin PL. Nighres: processing tools for high-resolution neuroimaging. Gigascience 2018;7:1–9 doi: 10.1093/gigascience/giy082. 9. Benson NC, Winawer J. Bayesian analysis of retinotopic maps. Elife 2018;7:1–29 doi: 10.7554/eLife.40224.Figures
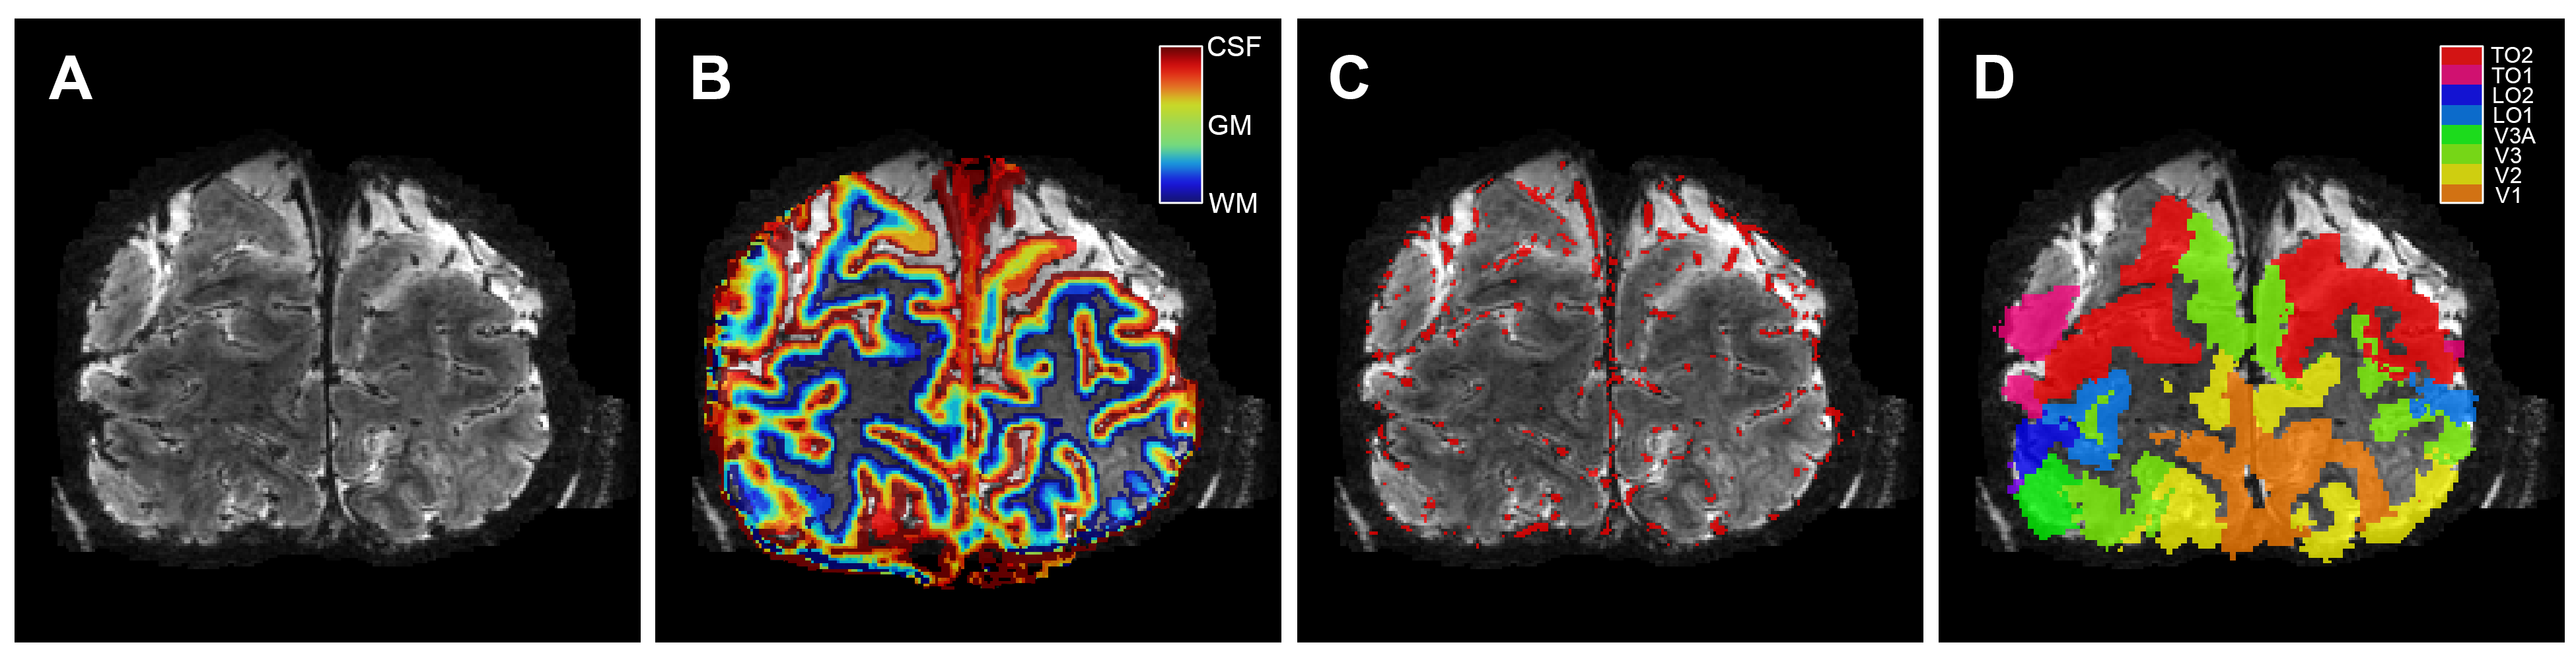
Volumetric maps. For 1 participant (subj09) the T2*-weighted
anatomical volume (A), the layer segmentation (B), the pial vein estimation (C),
and the visual ROIs (D) are shown. Of the visual ROIs, only V1, V2, and V3 were
included.
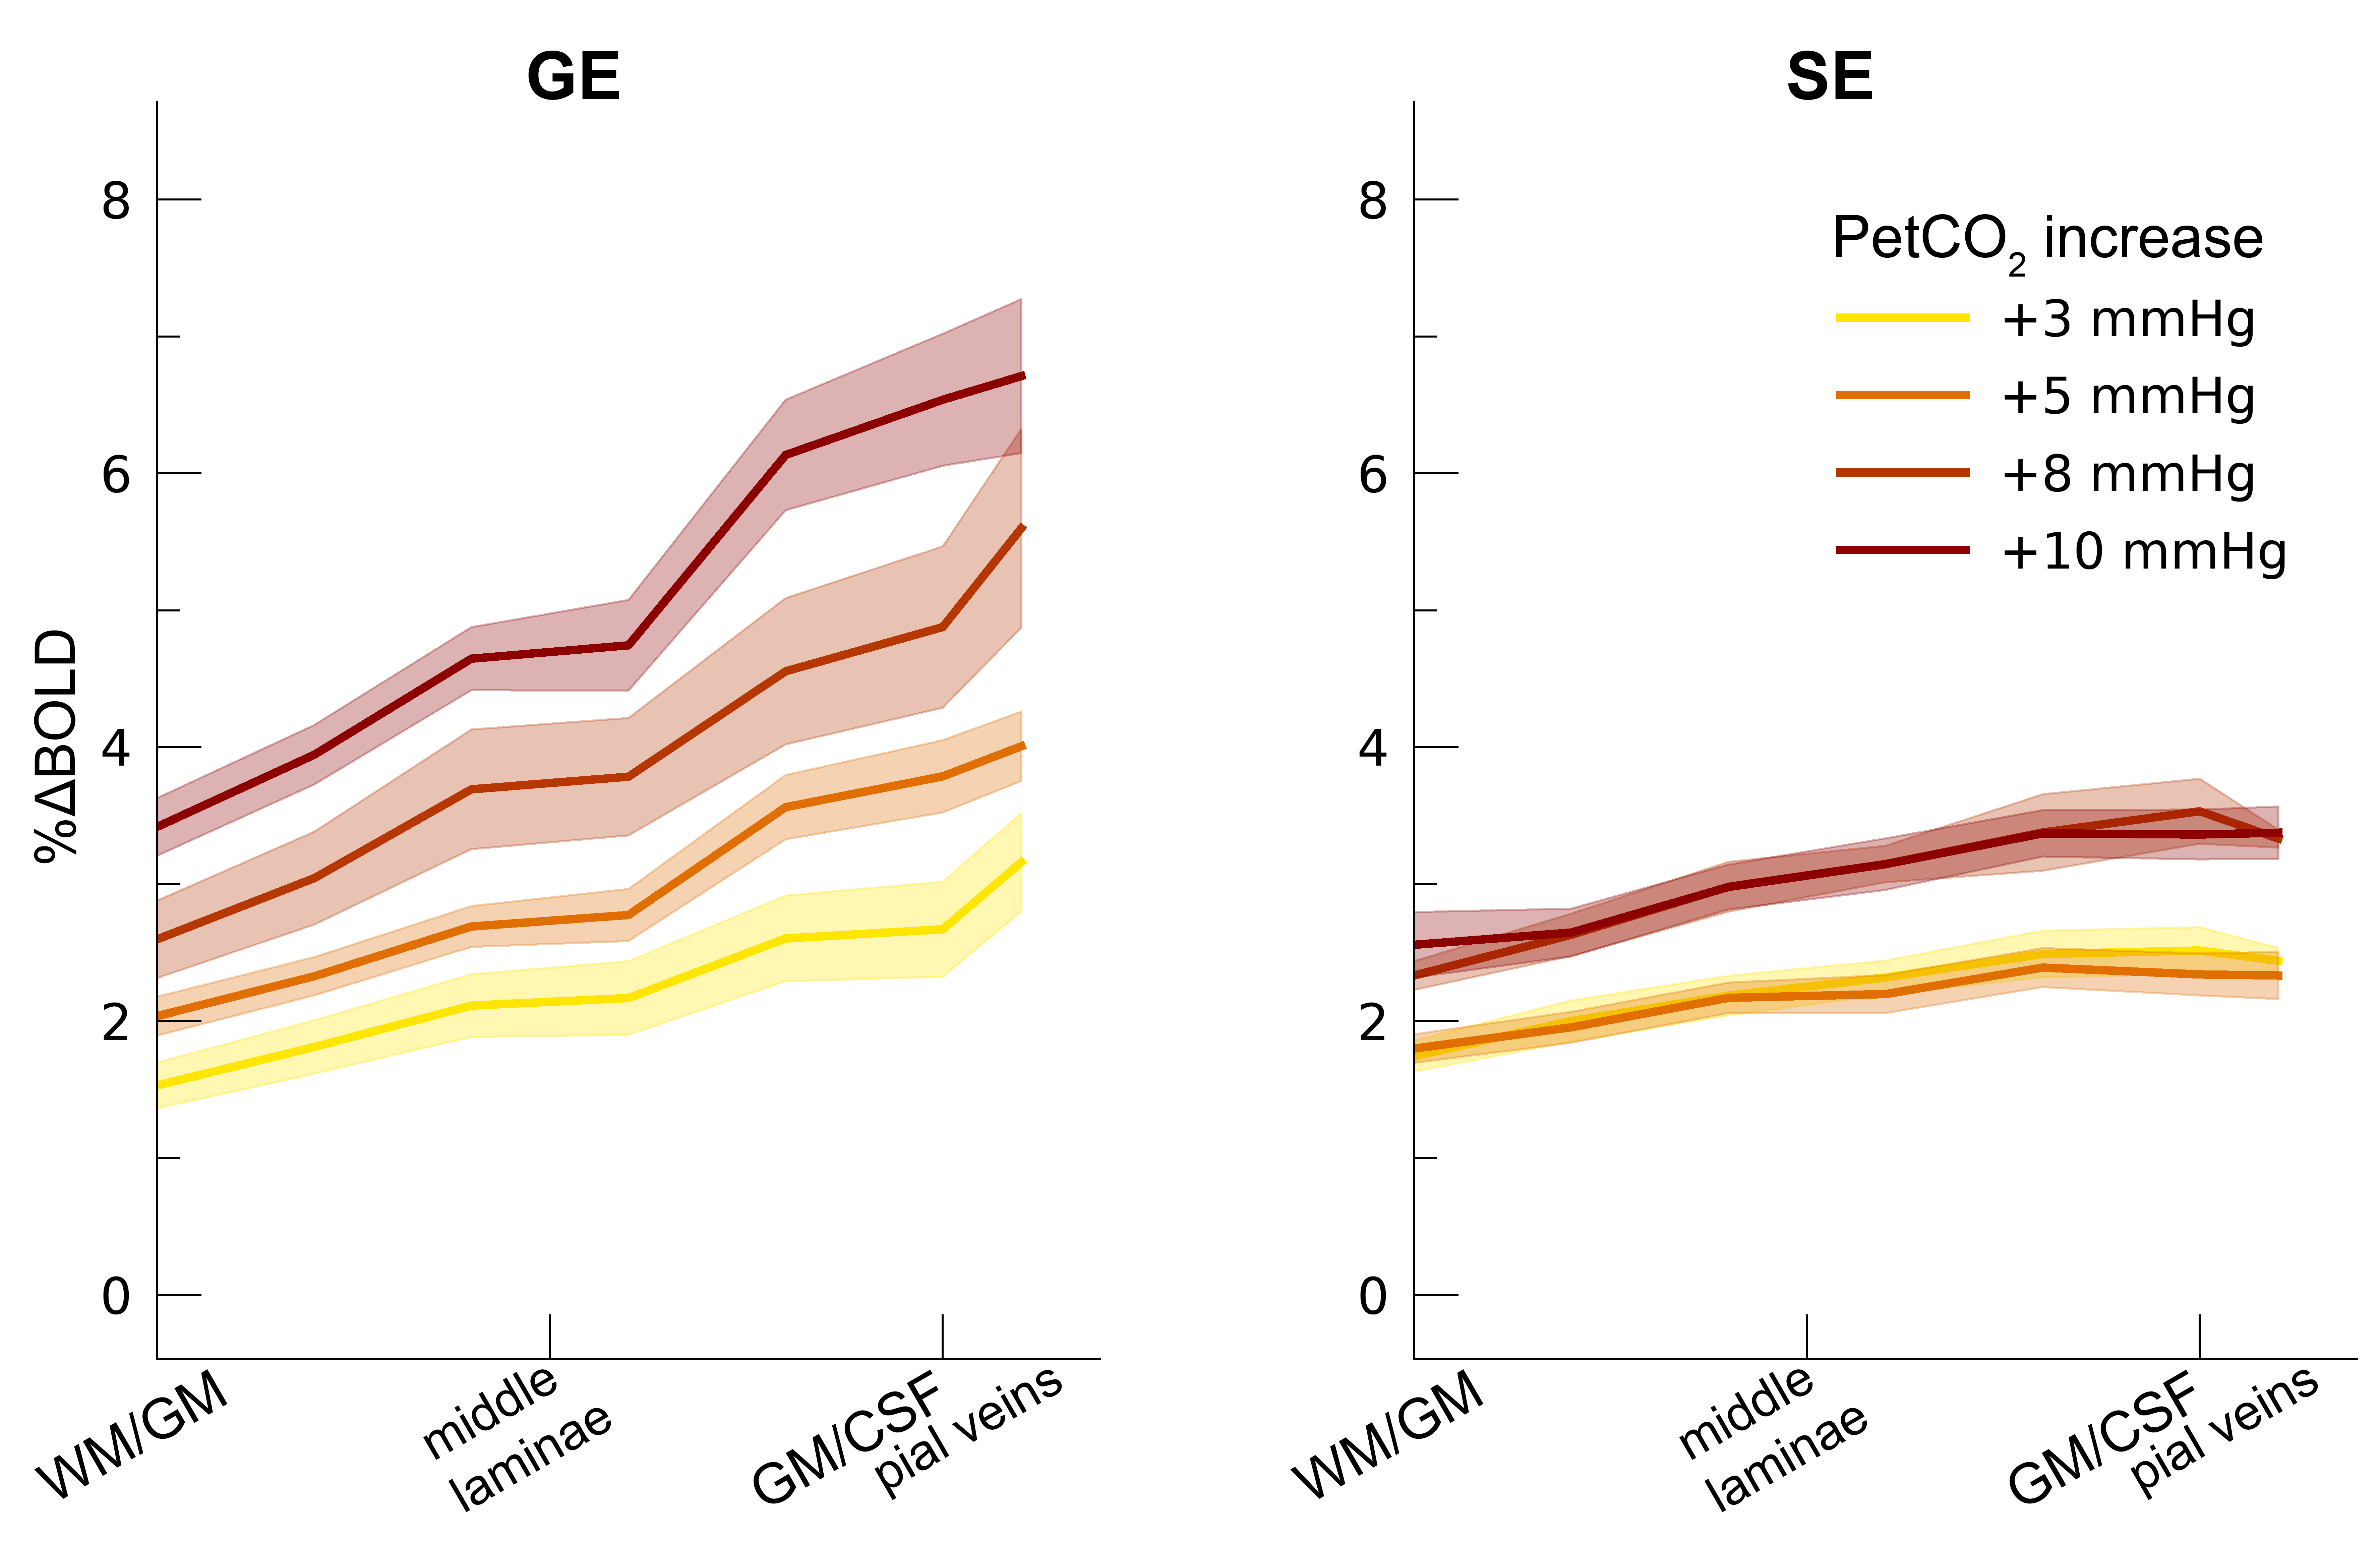
Percent BOLD signal change hypercapnia. The %ΔBOLDhc is shown across
cortical depth for the 4 hypercapnia levels (colors) and 2 scan sequences
(left/right panels). The shaded area represents the SEM across participants.
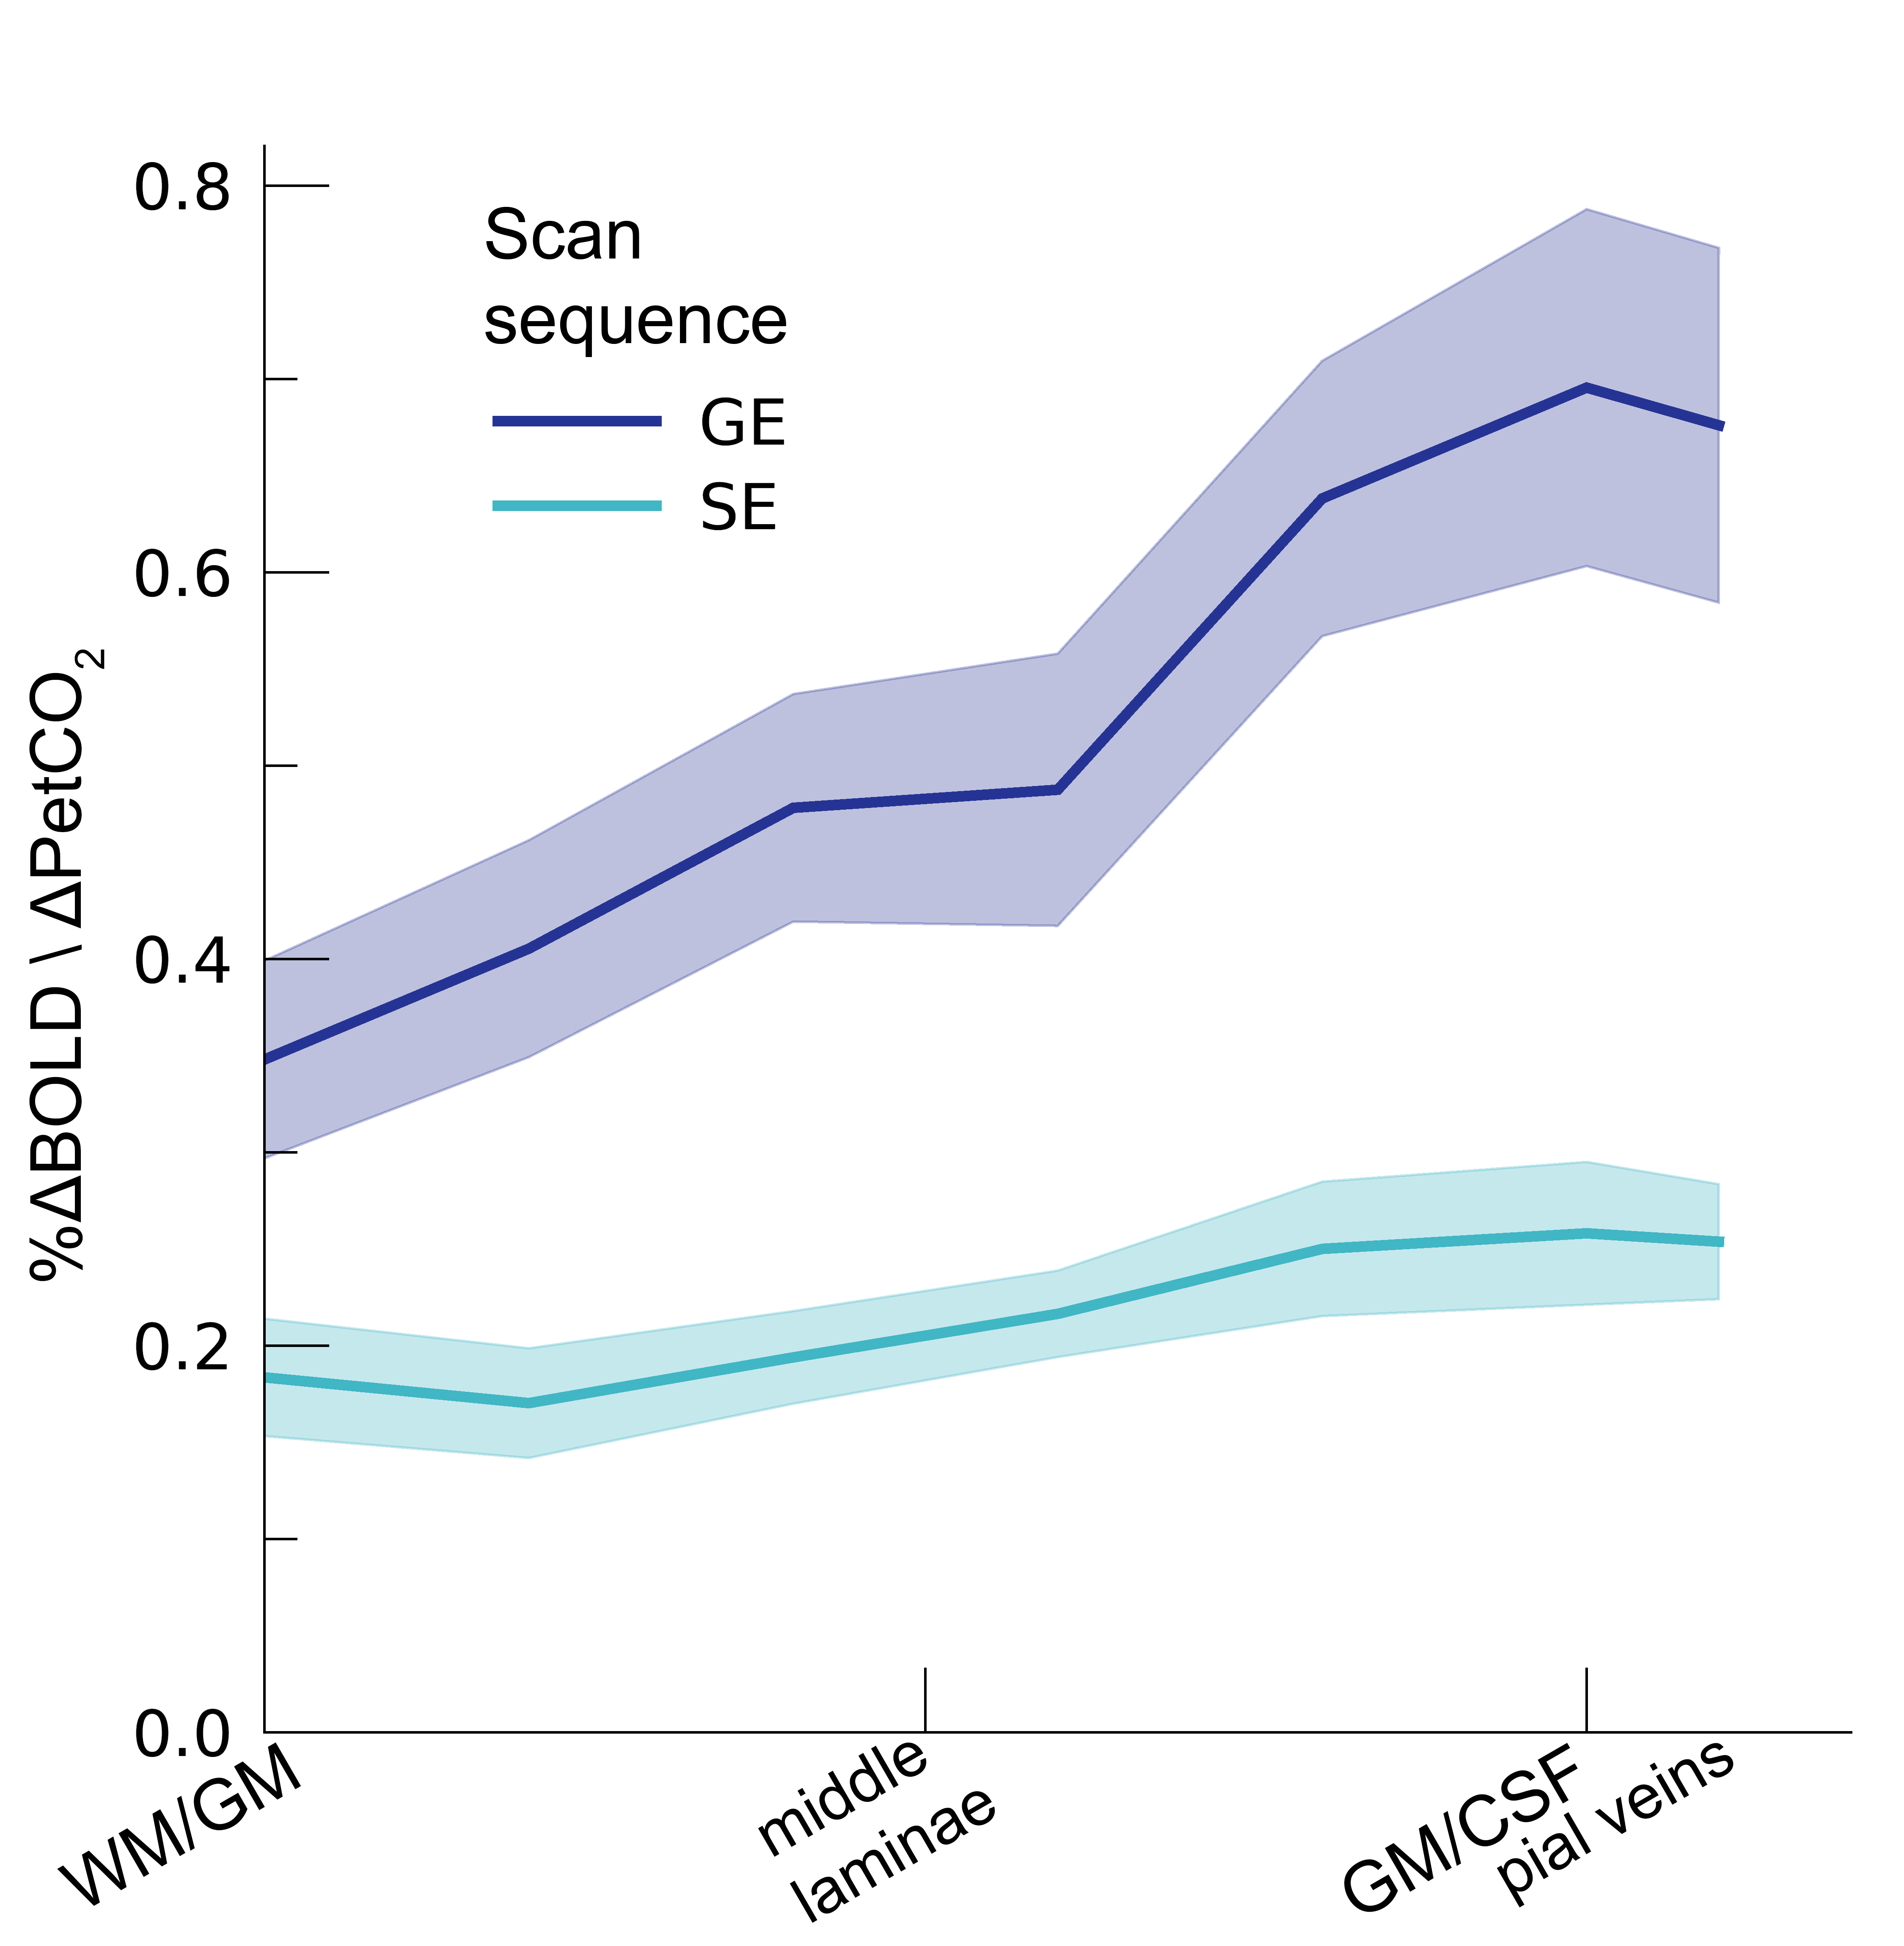
CVR. The CVR is shown across cortical depth for the 2 scan sequences
(colors). The shaded area represents the SEM across participants.
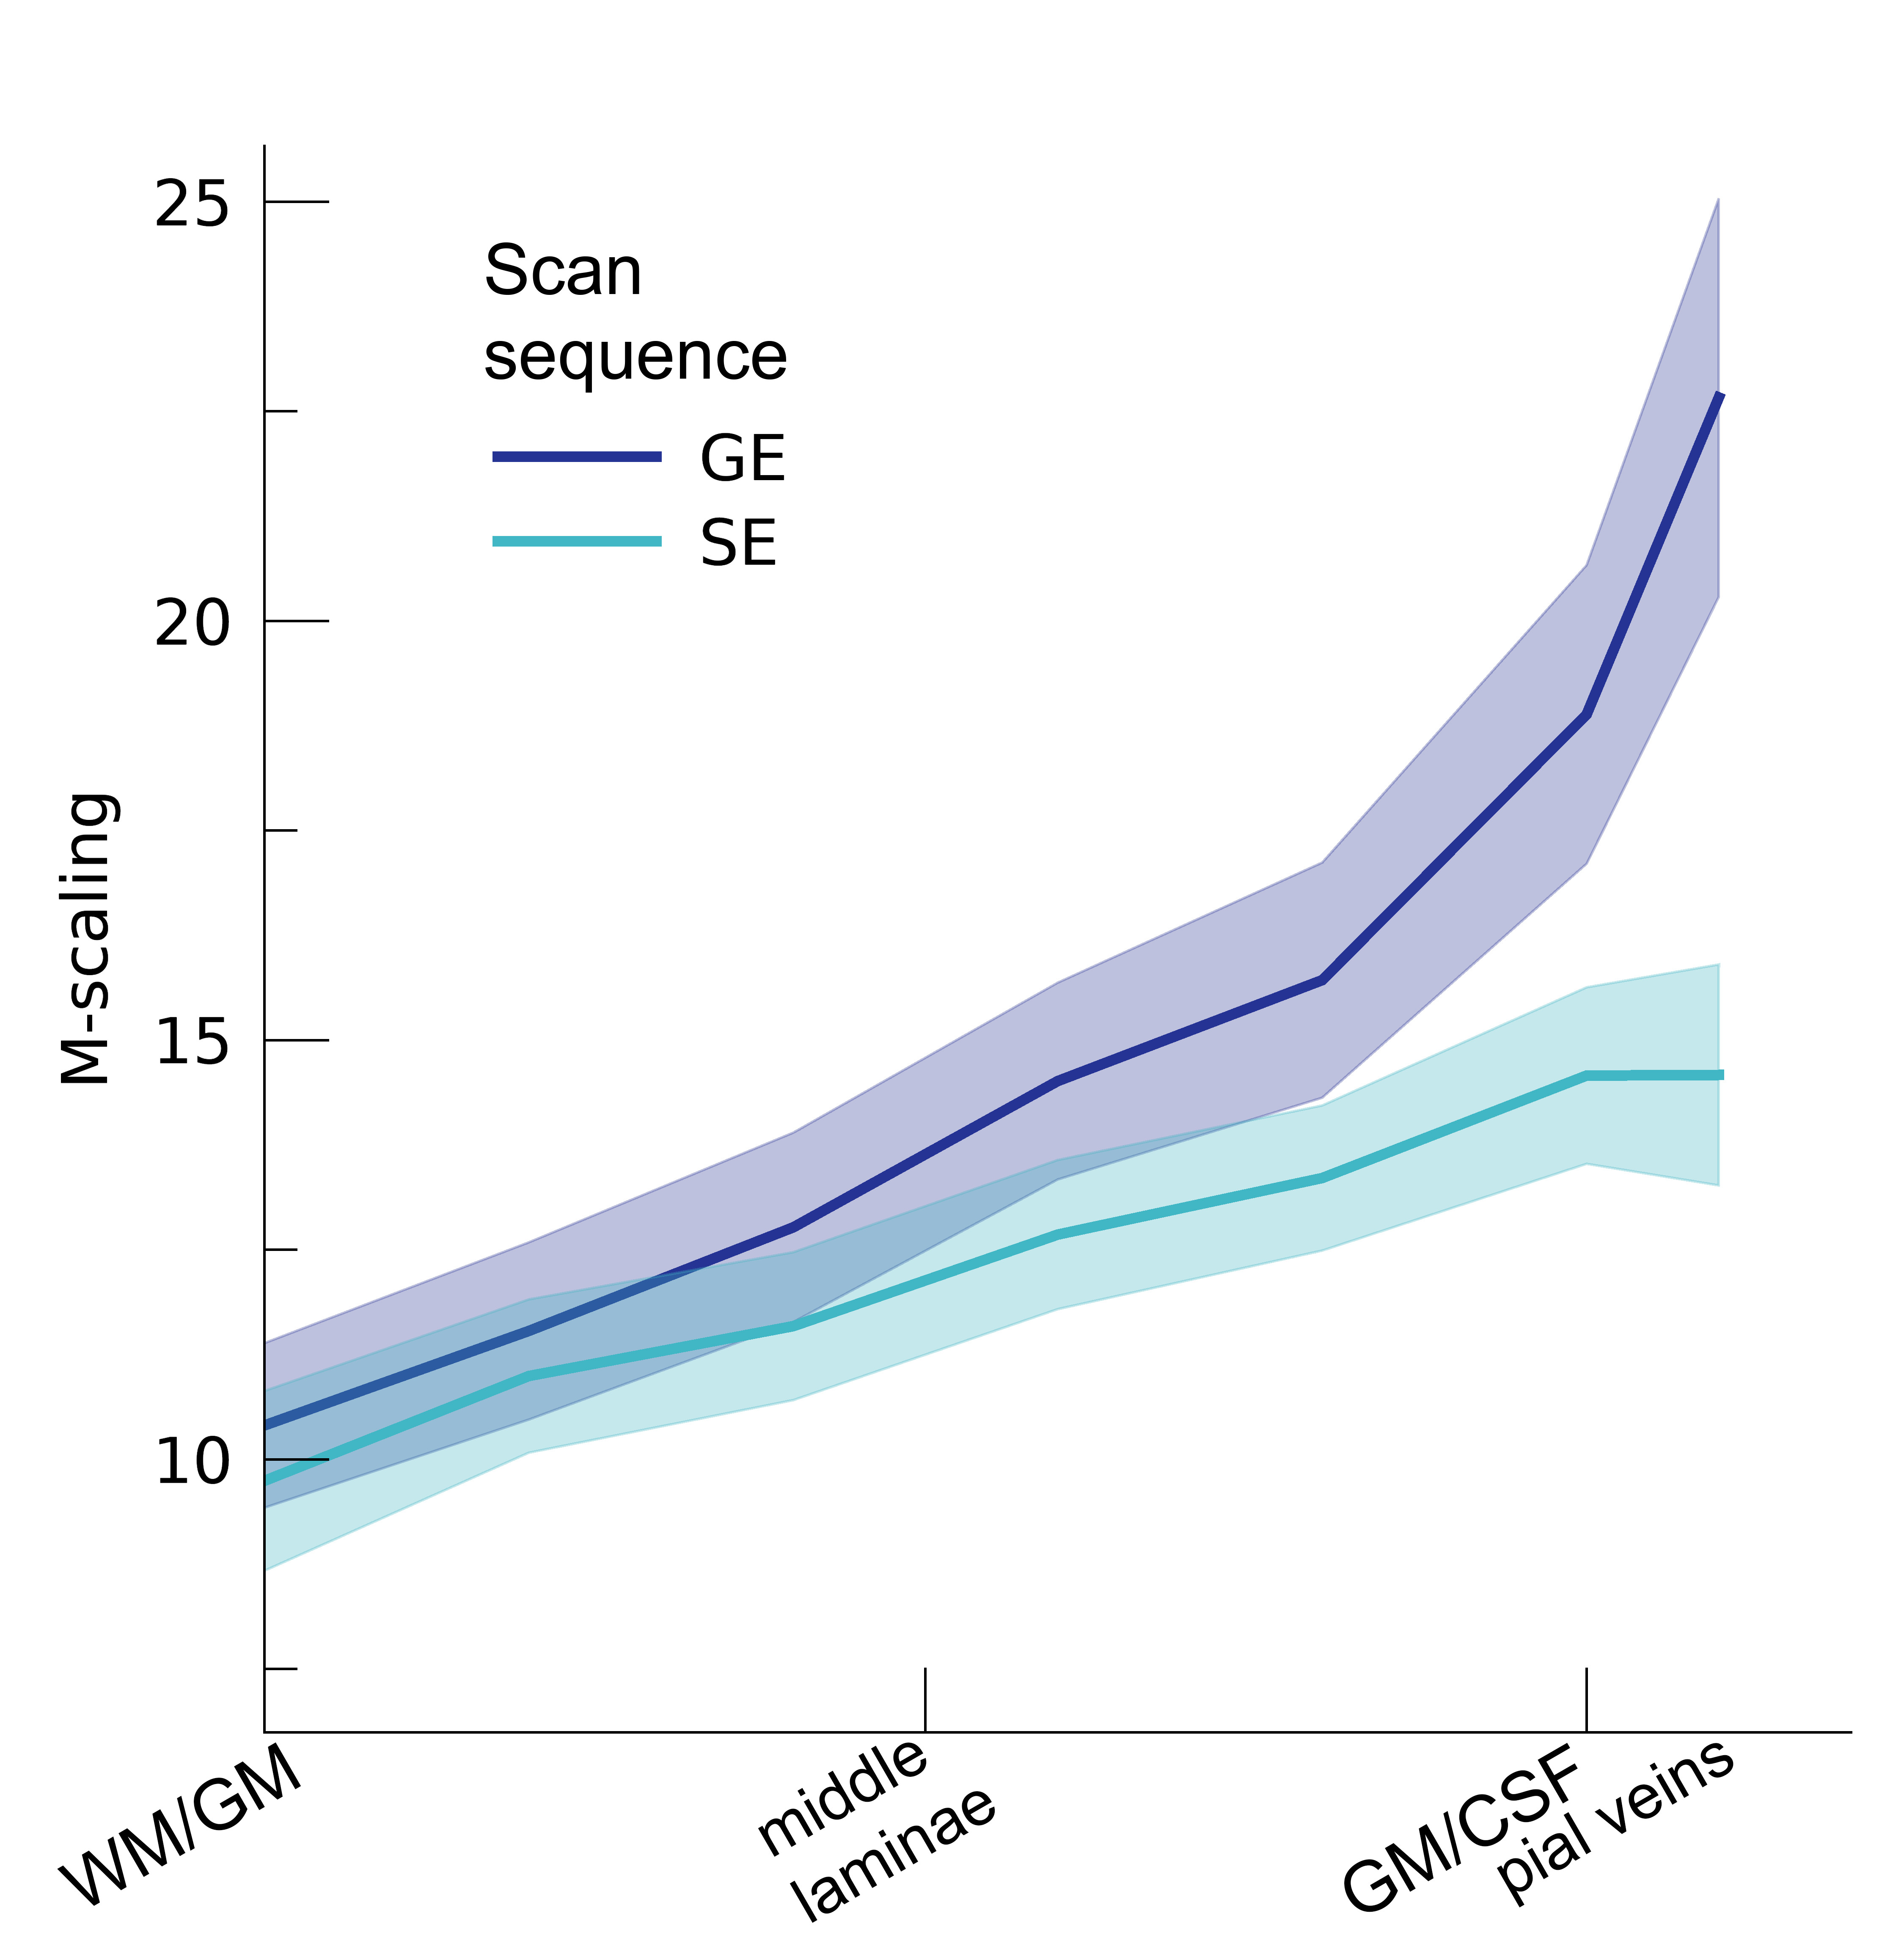
M-scaling. The theoretical maximum signal intensity “M” is shown across cortical
depth for the 2 scan sequences (colors). The shaded area represents the SEM
across participants.
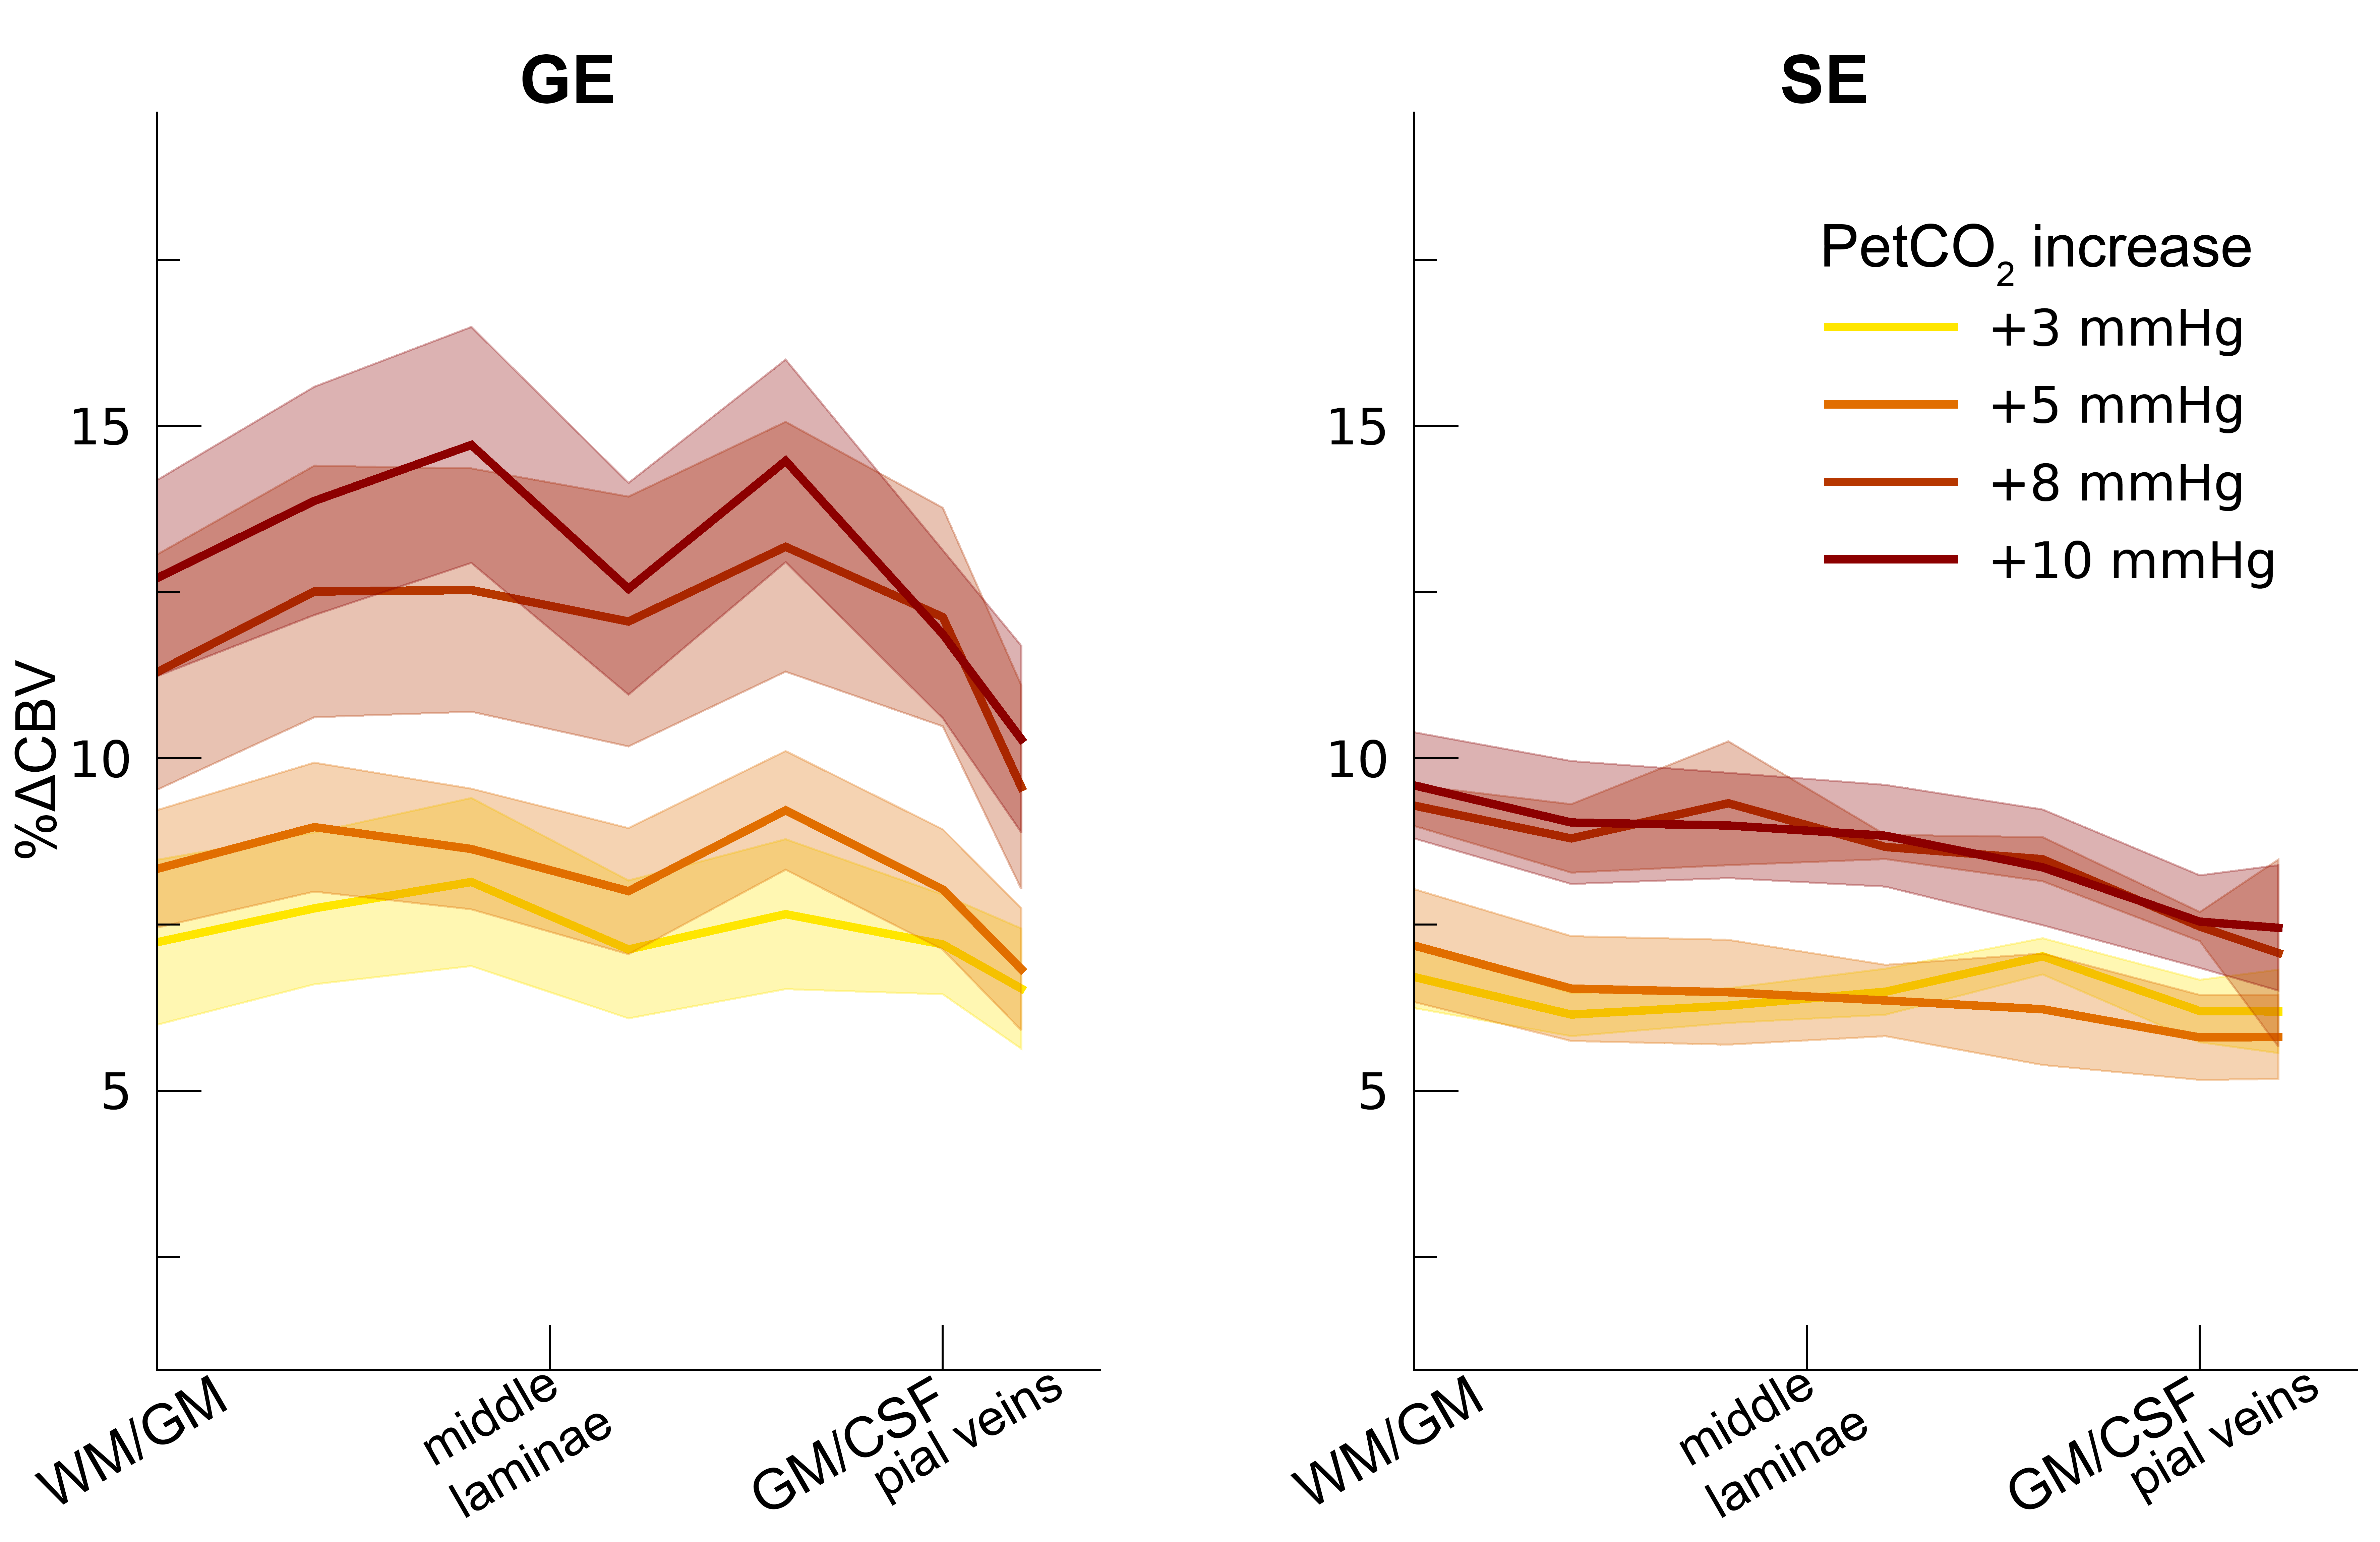
ΔCBV. The ΔCBV in percentages is shown across cortical depth for the 4
hypercapnia levels (colors) and 2 scan sequences (left/right panels). The
shaded area represents the SEM across participants.
DOI: https://doi.org/10.58530/2022/0013