0011
Regional diffusion imaging changes related to obesity, after adjusting for other risk factors: the UK Biobank study1University of Oxford, Oxford, United Kingdom
Synopsis
Small vessel disease is a common cause of white matter damage in older people. It is strongly associated with age, hypertension, diabetes, and obesity. We have investigated the associations between body mass index (BMI) and diffusion changes (adjusted for other risk factors) in data from UK Biobank. BMI was more strongly related to diffusion changes in inferior brain regions, depending on whether the white matter tracts were within the anterior or posterior circulation. Obesity affects white matter integrity, beyond the effect of cardiovascular risk factors.
Background
Cerebral small vessel disease (cSVD), i.e. damage to cerebral small vessels and surrounding brain tissue, is a major health problem in Europe affecting >50% of people over the age of 65, and >80% above 85.1 cSVD is responsible for 30% of strokes and 45% of cases of dementia2 as well as depression,3 disability, and increased all-cause mortality. cSVD is mainly associated with older age and hypertension, but its risk increases with other modifiable risk factors such as obesity. As Western populations become older and more overweight, the number of people with cSVD and subsequent stroke and dementia will also increase.Magnetic resonance imaging is a promising biomarker of cSVD, providing insights into dynamic disease pathology. Diffusion MRI (dMRI) is particularly sensitive to white matter damage in the early stages of cSVD.4 Previously, we have demonstrated that macrostructural white matter damage, presenting as white matter hyperintensities (WMH), and microstructural damage, assessed using dMRI, is associated with increased blood pressure, but it was the pulsatile component of hypertension that exaggerated the negative effect of age on white matter5 especially for the white matter tracts located within the posterior circulation.6
The aim of this study was to investigate the effect of body mass index (BMI) on the microstructural changes associated with diffusion imaging and the interactions between the BMI and blood pressure.
Methods
UK Biobank is a prospective community-based cohort of 502,484 40–69-year-old people, with brain MRI data available for 45,877 of them. Linear models were used to investigate associations between each of the diffusion measures: fractional anisotrophy (FA), mean diffusivity (MD), intracellular volume fraction (ICVF), isotropic volume fraction (ISOVF), and orientation dispersion (OD) within each of the 27 white matter tracts, using multivariable models with concurrent BMI, mean arterial pressure (MAP), and pulse pressure (PP), adjusted for age, sex, diabetes, antihypertensive medication, the source of blood pressure measures, blood circulation region, and smoking status.Fully-adjusted random-effects models were used, allowing for inclusion of multiple regional values from the same individual: dMRI ~ BMI + MAP + PP + circulation + age + sex + antiHT + smoking + diabetes + antiHT:MAP + antiHT:PP + BPmeasure + age:BMI + age:MAP + age:PP + circulation:MAP + circulation:PP + circulation:BMI + BMI:PP + BMI:MAP + (1 | eid) + (1 | roi).
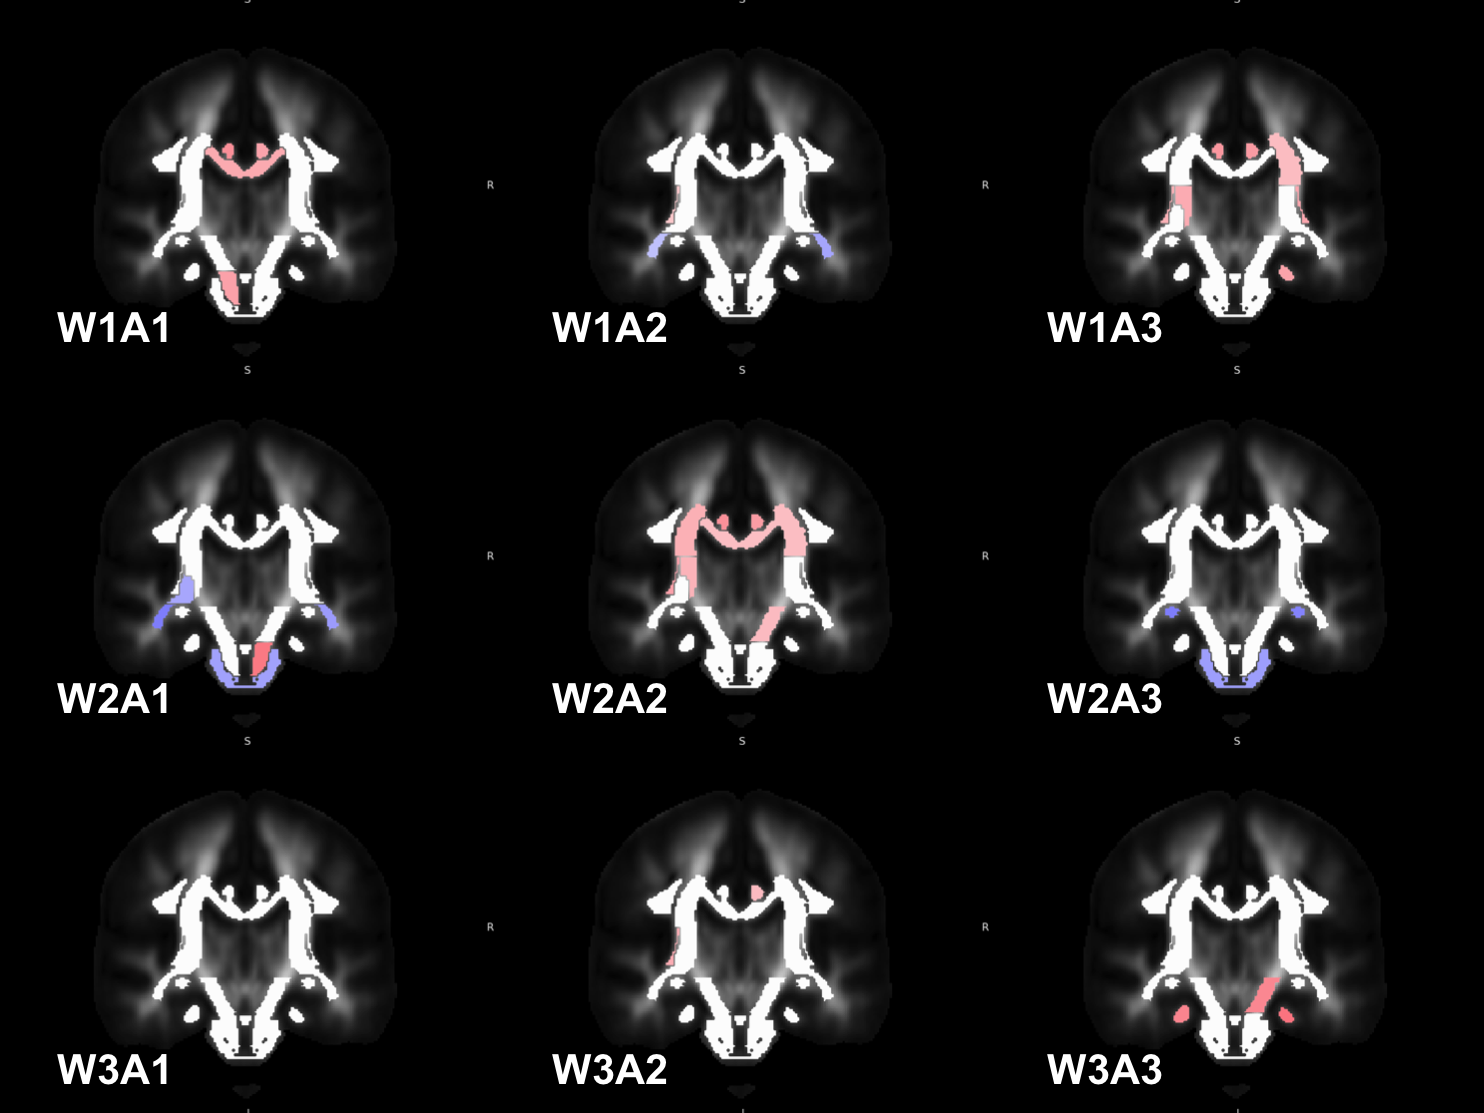
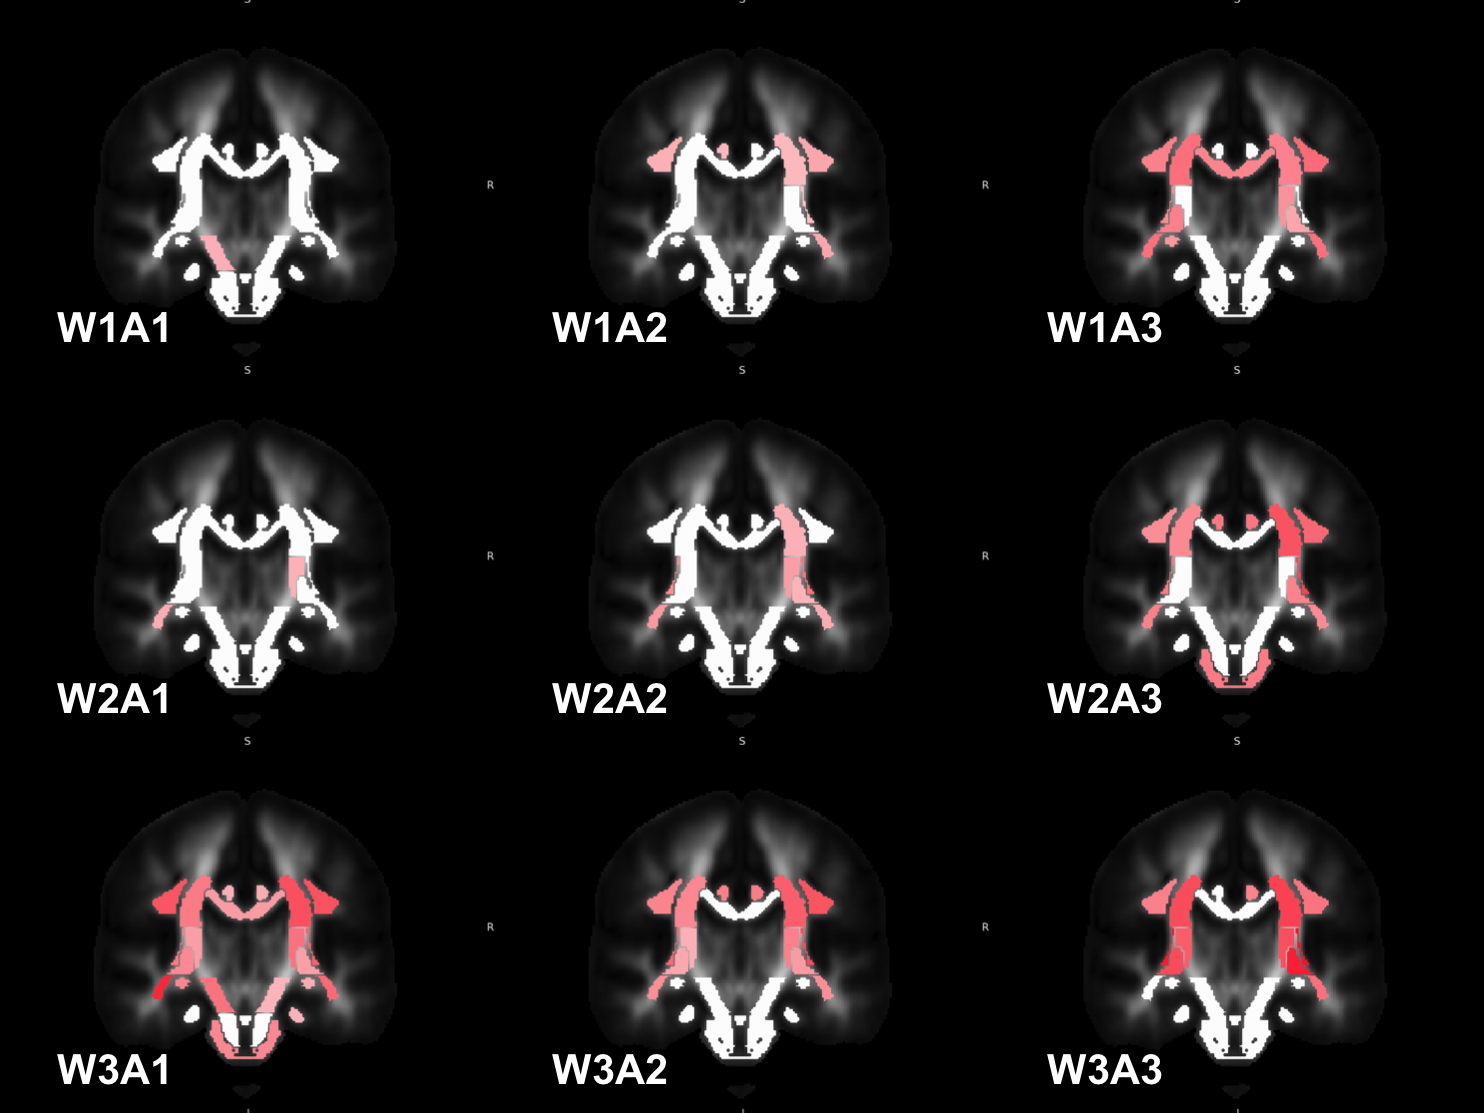
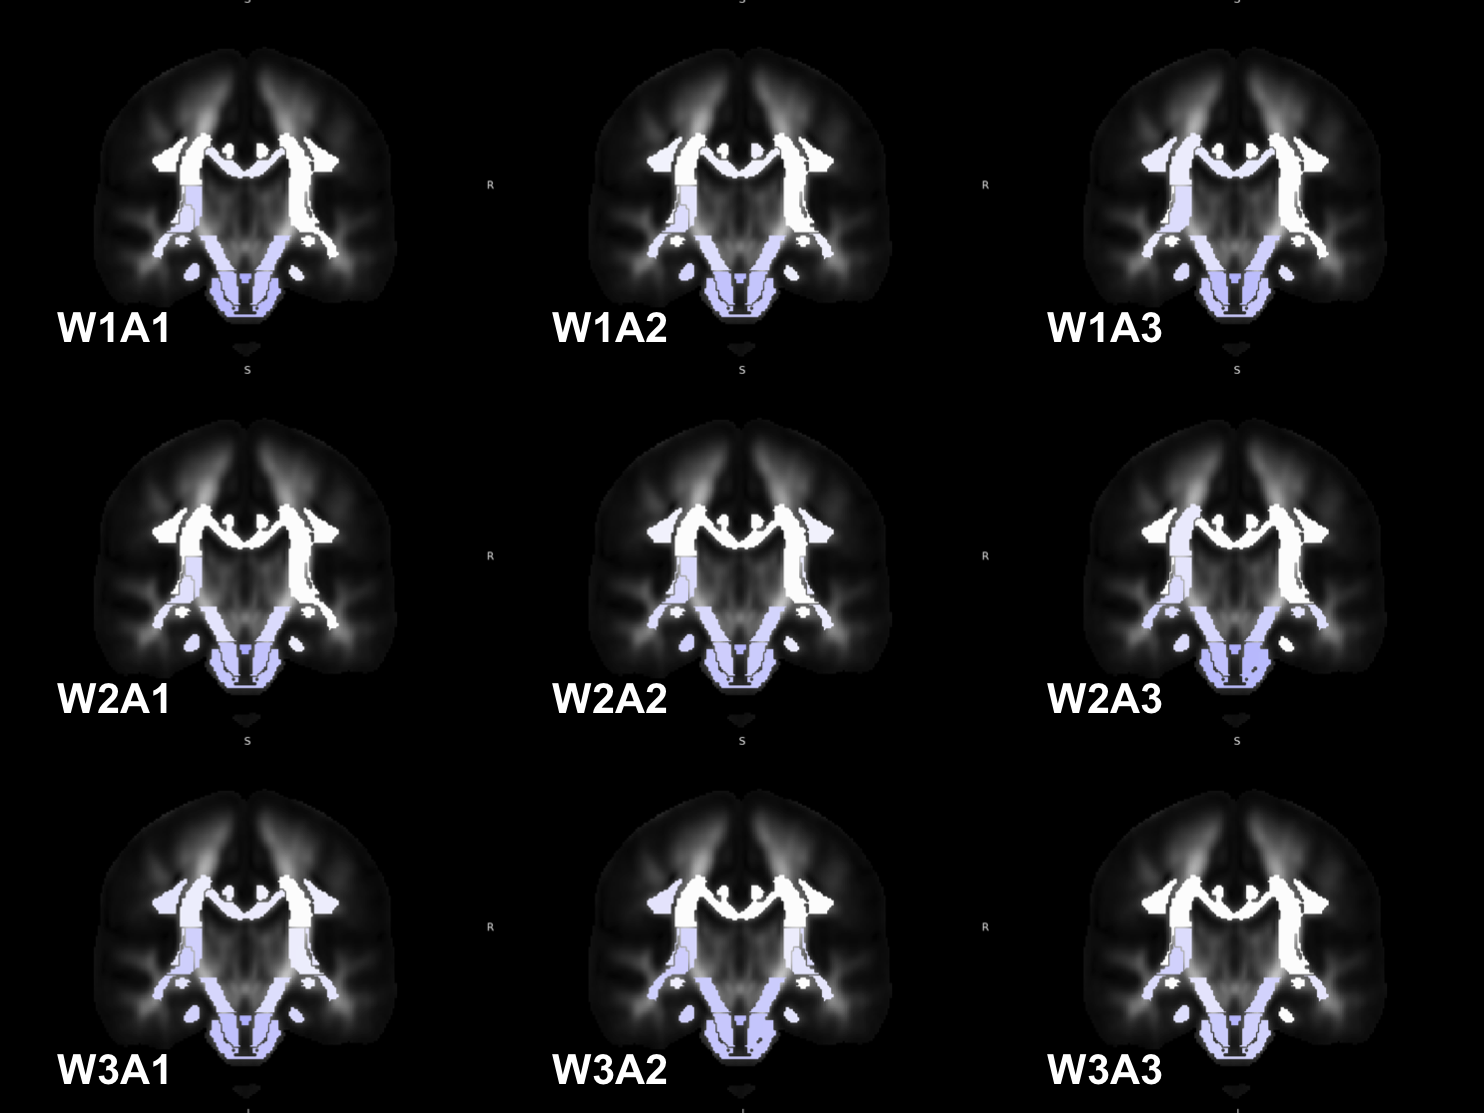
For analyses within a single dMRI measure in a single white matter tract, fully-adjusted linear models were used. As PP and white matter damage are strongly associated with age, analyses were also stratified by age decade (A1: <60; A2: 60–70; A3: ≥70) and tertile of white matter hyperintensity as a percentage of the total white matter volume (W1–W3).
Data management and analyses were performed using R version 4.0.2 with random-effects models fitted using the lme4 package version 1.1-26.
Results
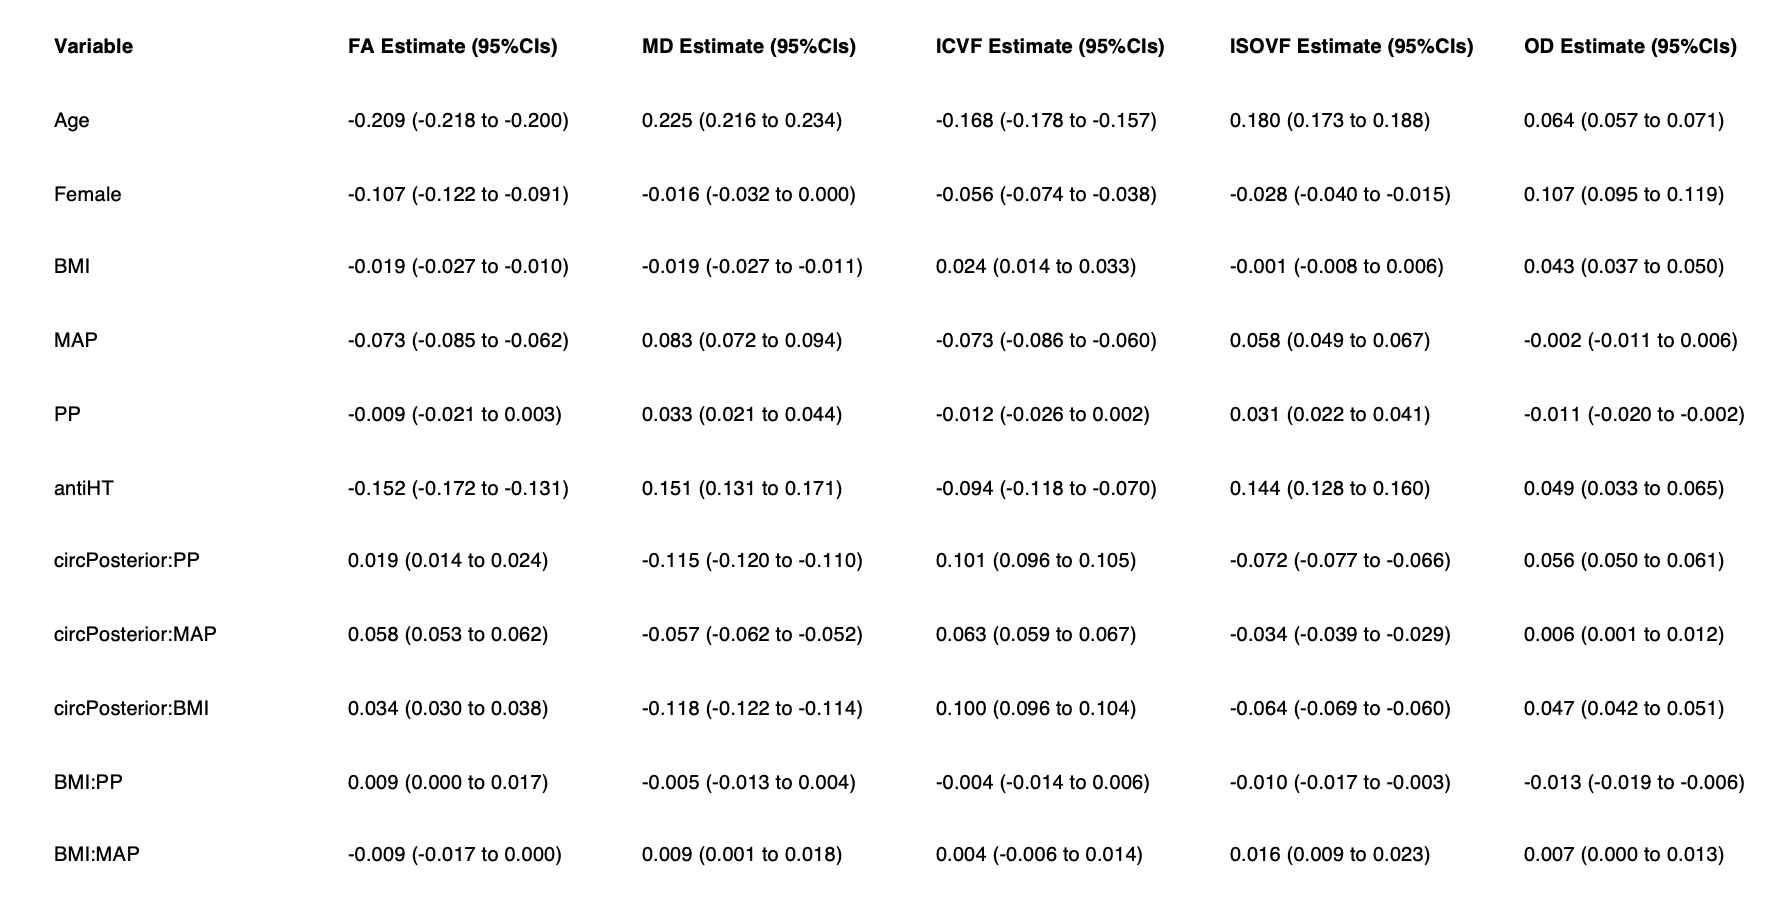
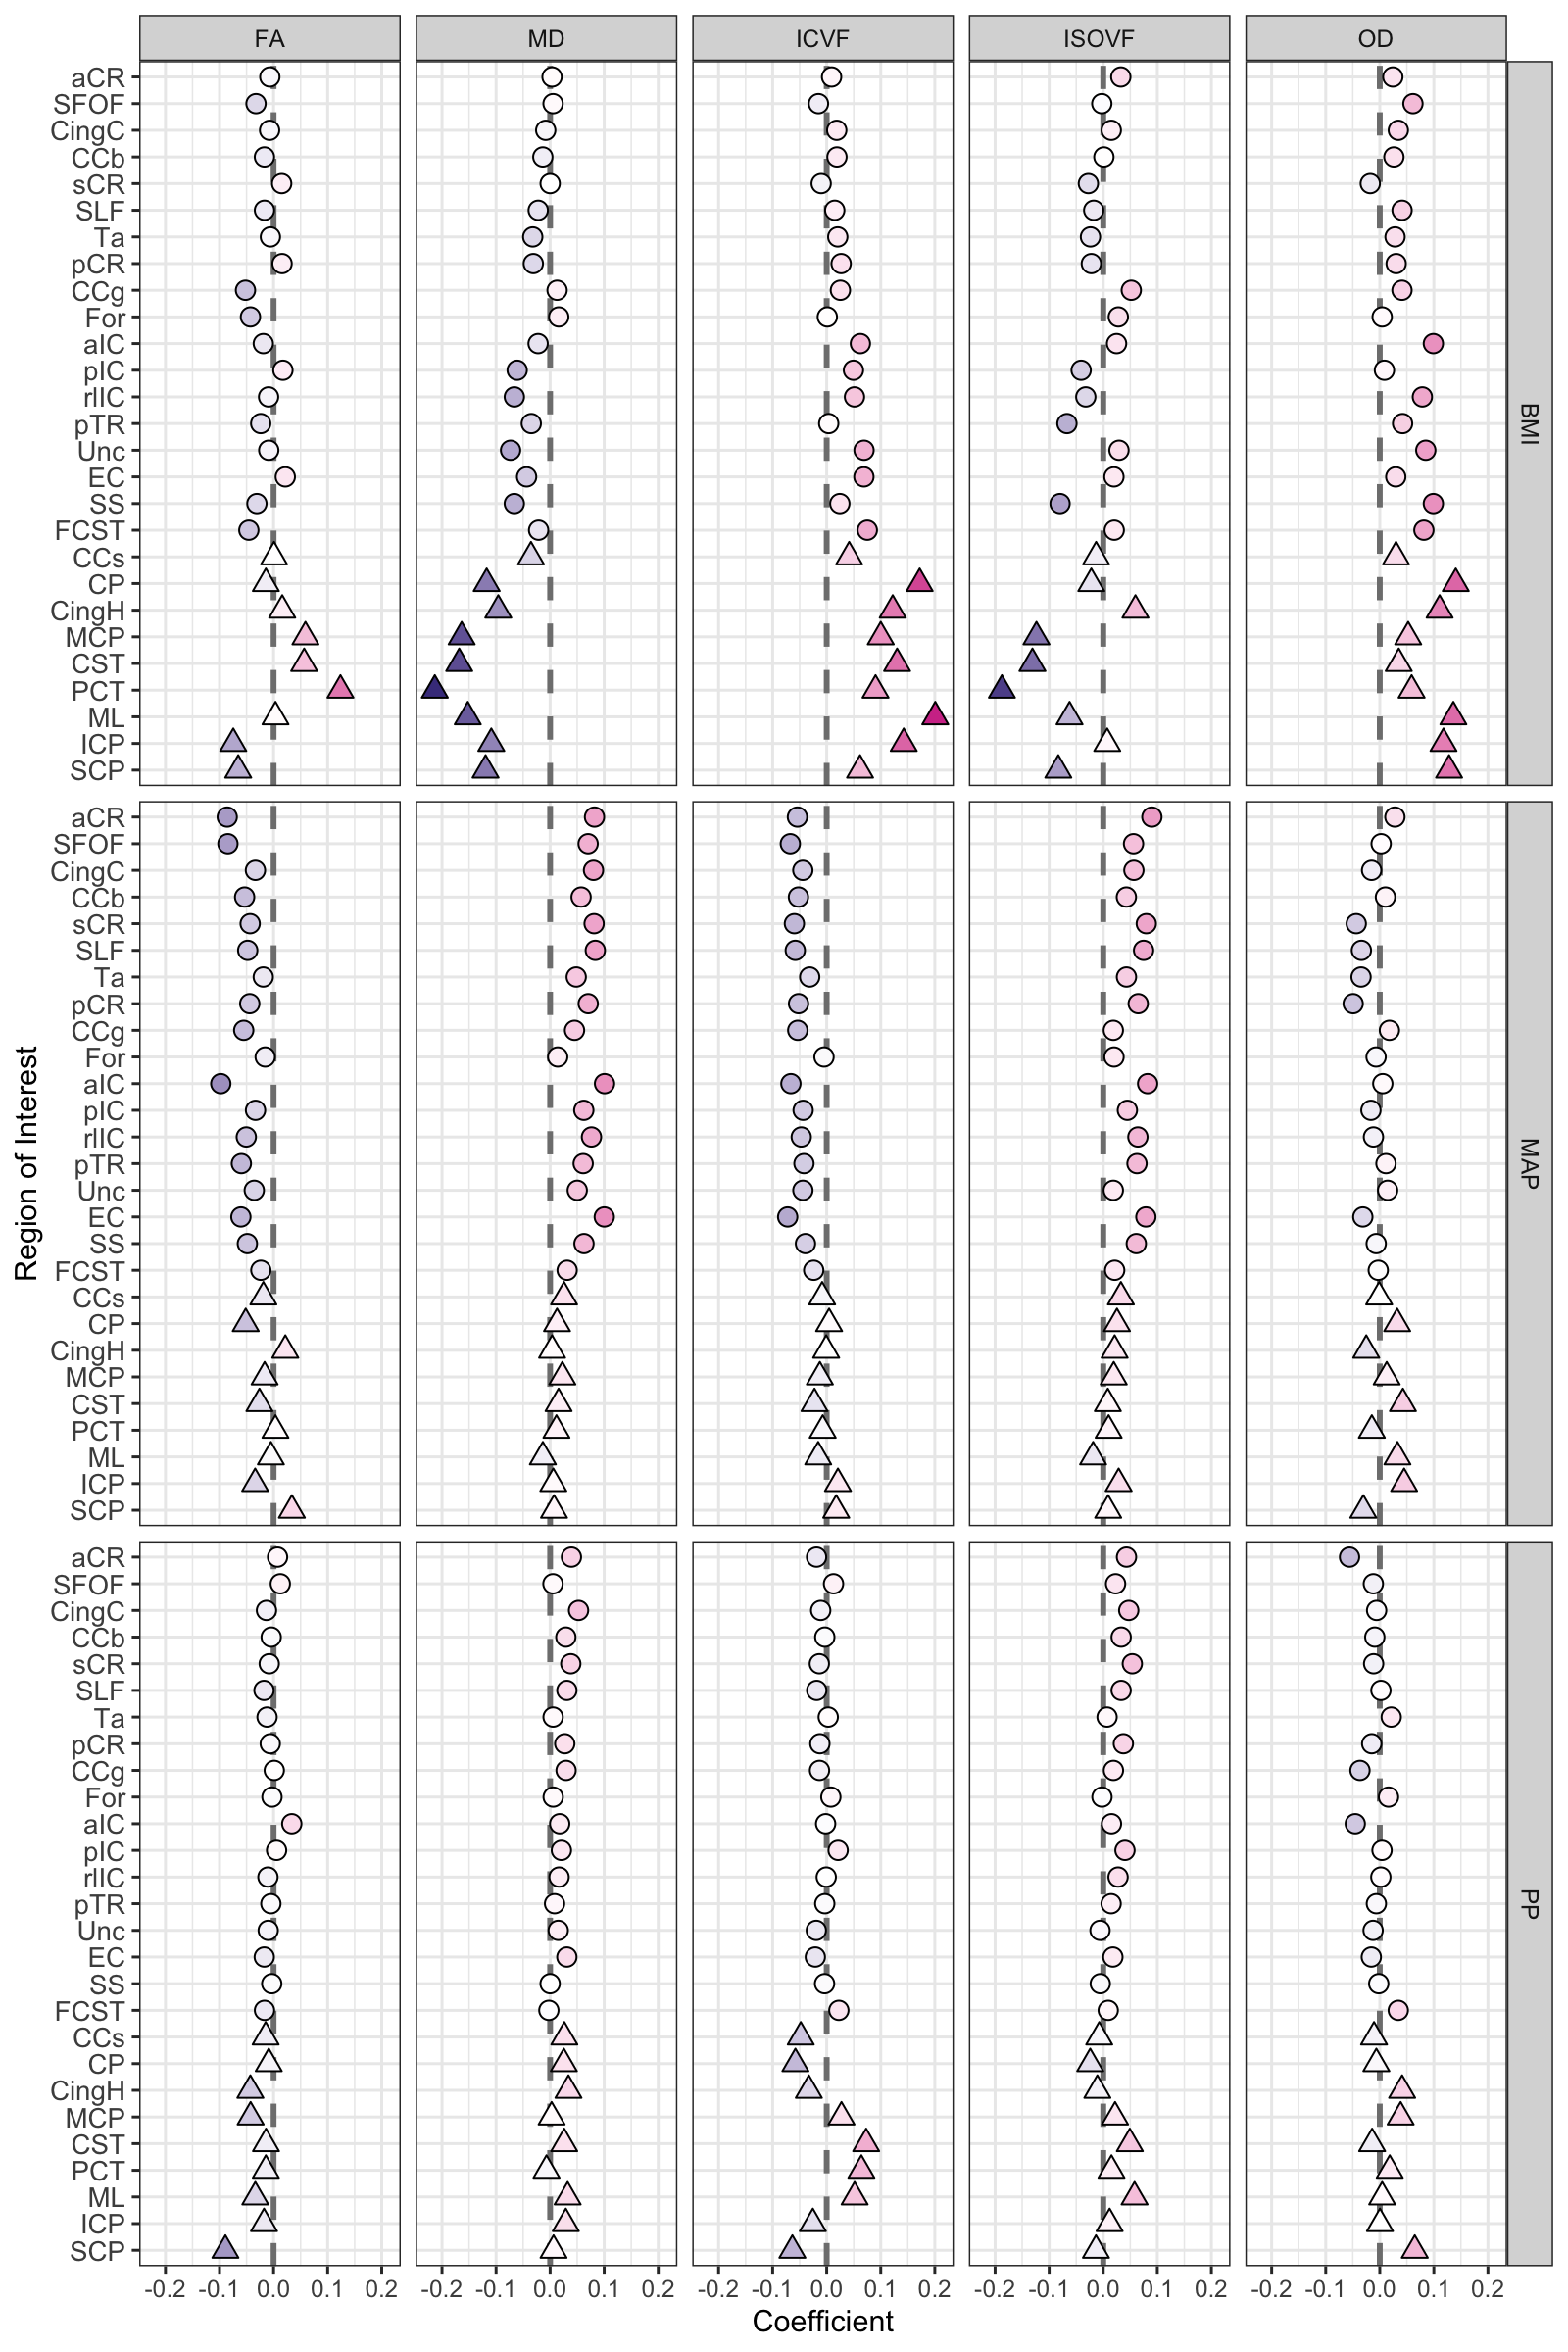
In fully-adjusted random-effects models, BMI was associated with higher OD and ICVF and lower FA and MD. There were interactions between the effect of BMI and PP on ISOVF and OD and between BMI and MAP on MD and ISOVF (Fig.1). Moreover, there were significant interactions between the location within the anterior and posterior circulation and the effect of BMI, MAP, and PP on each of the dMRI measures (Fig.1–2).For MD (used in the abstract as an example) higher BMI was associated with lower MD and this protective effect was enhanced within the posterior circulation (Fig. 1–2). The effect of MAP (Fig. 3) and PP (Fig. 4) varied following a superior-inferior gradient and were affected by age and WMH, whereas the effect of BMI was present predominantly within the inferior regions and showed less variation across age decades and tertiles of WMH (Fig. 5).
Discussion
BMI is an risk factor for microstructural white matter changes, independent of age and both the steady component of blood pressure (represented by MAP) and the pulsatile component (represented by PP). These findings suggest that either higher BMI protects against the negative consequences of high pressure, for example, the detrimental effect of high PP on MD within the posterior circulation, or that higher BMI introduces bias in the estimation of diffusion parameters, and that this effect is particularly pronounced in the regions that are most susceptible to motion or are the closest to the subjects torso.Conclusions
BMI affects diffusion measures, especially in the more inferior white matter tracts, even after controlling for cardiovascular risk factors.Acknowledgements
None.References
1. Simoni,
M. et al. Neurology 2012,79(12),1215–1222. DOI:10.1212/WNL.0b013e31826b951e.
2. Debette,
S. et al. BMJ
2010,341,c3666–c3666.
DOI:10.1136/bmj.c3666
3. Wardlaw,
J. M. et al. The Lancet Neurology 2013,12(8),822–838.
DOI:10.1016/S1474-4422(13)70124-8
4. Nitkunan,
A. et al. Stroke 2008,39(7),1999–2005. DOI: 10.1161/STROKEAHA.107.507475.
5. Wartolowska,
K. A. et al. Hypertension. 2021;78:532–539.DOI:10.1161/HYPERTENSIONAHA.121.17403.
6. Wartolowska,
K. A. et al. JCBFM 2021. DOI:
10.1177/0271678X211058803
Figures