0993
Pseudo-Enhancement in Intracranial Aneurysms on Black-Blood MRI: Effects of Flow Rate, Spatial Resolution, and Additional Flow Suppression.
Mariya S. Pravdivtseva1, Franziska Gaidzik2, Philipp Berg2, Carson Hoffman3, Leonardo A. Rivera-Rivera3, Rafael Medero4, Lindsay Bodart3, Alejandro Roldan-Alzate4, Michael A. Speidel3, Kevin M. Johnson3, Oliver Wieben3, Olav Jansen5, Jan-Bernd Hövener1, and Naomi Larsen5
1Section Biomedical Imaging, Molecular Imaging North Competence Center (MOIN CC), Department of Radiology and Neuroradiology, University Medical Center Schleswig-Holstein (UKSH), Kiel University, Kiel, Germany, 2Laboratory of Fluid Dynamics and Technical Flows, Forschungs campus STIMULATE, University of Magdeburg, Magdeburg, Germany, 3Department of Medical Physics and Medicine, University of Wisconsin School of Medicine and Public Health, Madison, WI, United States, 4Department of Mechanical Engineering and Radiology, University of Wisconsin School of Medicine and Public Health, Madison, WI, United States, 5Department of Radiology and Neuroradiology, University Medical Center Schleswig-Holstein, Kiel, Germany
1Section Biomedical Imaging, Molecular Imaging North Competence Center (MOIN CC), Department of Radiology and Neuroradiology, University Medical Center Schleswig-Holstein (UKSH), Kiel University, Kiel, Germany, 2Laboratory of Fluid Dynamics and Technical Flows, Forschungs campus STIMULATE, University of Magdeburg, Magdeburg, Germany, 3Department of Medical Physics and Medicine, University of Wisconsin School of Medicine and Public Health, Madison, WI, United States, 4Department of Mechanical Engineering and Radiology, University of Wisconsin School of Medicine and Public Health, Madison, WI, United States, 5Department of Radiology and Neuroradiology, University Medical Center Schleswig-Holstein, Kiel, Germany
Synopsis
An intracranial aneurysm is a life-threatening disease. Vessel-wall enhancement on black-blood MRI was associated with inflammation and proposed as a marker for higher aneurysm rupture risk. However, slow blood flow can mimic wall enhancement. Here, we studied the effects of flow rates, spatial resolution, and motion-sensitized driven equilibrium (MSDE) on black-blood MRI using printed aneurysm models. A hyperintense signal was observed in the models and co-localized with a slow flow. MSDE and higher flow rates reduced the hyperintensities. Slow-flow phenomena contribute substantially to aneurysm enhancement, vary with MRI parameters, and should be considered in rupture assessment.
Introduction
Intracranial aneurysm (IA) is a common pathology with life-threatening bleedings if ruptured. A reliable assessment of aneurysm rupture risk remains a clinical challenge.Enhancement of the aneurysm wall on gadolinium-enhanced black-blood MRI (BB MRI) has been proposed as a marker for higher risk of rupture1. It has been associated with inflammatory and degenerative processes in the aneurysm wall. Furthermore, so-called pseudo-enhancement related to slow blood flow in the aneurysm sac observed in vivo2 might impede precise assessment of true wall enhancement. This pseudo-enhancement has been observed in vitro in a plastic aneurysm model3 as well. Due to the impermeable walls of the vascular model, the accumulation of contrast agent in the wall can be ruled out as a cause of signal enhancement, thus enabling the examination of flow-related enhancement phenomena without the influence of inflammation-related wall permeability.
This study aimed to assess the contribution of slow flow on BB-signal using 3D-printed patient-specific aneurysm models. Moreover, the impact of spatial resolution and motion-sensitized driven equilibrium (MSDE) preparation on flow-related enhancement was investigated.
Methods
Experimental setup: Geometrical data of three patients with IAs showing extensive signal enhancement on BB MRI (Fig. 1a,b) were used to construct aneurysm models (M1-3, Fig. 1c). Models were 3D-printed, submerged in an agarose gel, and supplied with a pulsatile flow at time-averaged values of 160-311 ml/min (Fig. 1d).MRI measurements: 3 T MRI system with a 32-channel head coil was used (Ingenia CX, R5 V6.1, Philips Healthcare). The MR protocol comprised BB MRI and 4D flow.
BB MRI was performed using a 3D T1-weighted variable refocusing flip angle turbo spin-echo sequence4 (TE/TR: 22–32/700msec; FOV: 120×120×70mm3; echo train: 55; 3 voxel sizes: 0.5mm3, 0.7mm3, 0.9mm3) with and without MSDE5, before and after Gd-contrast administration.
4D flow was performed using a 3D T1-weighted spoiled fast gradient echo sequence with Cartesian sampling and a balanced symmetric 4-point phase-contrast encoding scheme (TE/TR: 4.6/7.5msec; FOV: 120×120×70mm3; voxel size: (1mm)3; temporal points: 24; velocity encoding: 50 and 100cm/s).
To verify 4D flow measurements, flow simulations (CFD) with a higher spatial resolution (0.1mm3) were conducted. Boundary conditions were set according to the experiment.
Data assessment: BB-signal was measured in three regions of interest (ROI): aneurysm lumen, wall, and agarose gel (Fig. 2). BB-signal at the aneurysm lumen and wall was normalized by the signal at the agarose gel. A Kruskal–Wallis test was performed to compare BB-signal with varying MRI parameters (p=0.01). Voxel-wise BB-signal was compared to velocity values at the aneurysm lumen.
Results
4D flow velocity was similar to that calculated with CFD for all models (Fig. 3). Flow jets were apparent in M1 and M2 (Fig. 4a). Jets lost their speed and changed direction after contact with the opposite aneurysm wall. The areas of minimum velocities were apparent between forward and reverse flow jets. No flow jet was observed in M3.In all three models, a hyperintense BB-signal was found in the aneurysm lumen. High velocities were co-localized with areas of low BB-signal (Fig. 3), a voxel-wise comparison between 4D flow and BB-signal yielded the same result (Fig. 4b). Median values of velocity and BB-signal were inversely dependent on each other (Fig. 4c): higher velocities were associated with more effective blood signal suppression, resulting in lower BB-signal. Flow entering the aneurysm was the highest in M1 and the lowest in M3, respectively the best flow suppression was observed in M1 and the worst in M3.
Among all three models, the following tendency was observed: BB-signal in the aneurysm increased by a factor of 2.56±0.68 (p<0.01) after Gd-contrast administration and decreased by 2.21±1.12 when a higher flow was applied (Fig. 5). BB-signal was reduced further 4.91±3.01 times when MSDE and the high flow rate were used, thus BB-signal was lowest in conjunction with high flows and MSDE. Modification of the spatial resolution did not yield a clear result.
Discussion
Our results indicate that higher signal intensities in the aneurysm lumen are associated with slow flow inside the aneurysm, which is in line with findings reported previously3. In addition, we showed an inverse dependence between the median values of velocity and BB-signal. Remarkably, previously both signal enhancement6 and slow flow7 were associated with a higher rupture risk. Likely, the sensitivity of BB-signal for slow flow could help to identify hemodynamic conditions associated with aneurysm progression and rupture, as opposed to considering it only as a misleading artifact.In agreement with the previous results8, MSDE reduced flow-related signal enhancement. MSDE does not prolong MRI acquisition time and may be a good solution to minimize flow-related artifacts. However, other aspects such as the impact of MSDE-preparation on image quality and diagnostic performance should be further investigated.
The study has the following limitations: 1) a small number of models was used, although with different representative flow patterns; 2) rigid 3D-printed walls differ from in vivo aneurysm walls in terms of MRI signal, microscopic surface properties, and elasticity precluding direct transfer of the results to in vivo scans.
Conclusion
Slow-flow phenomena contribute substantially to aneurysm enhancement and vary with MRI parameters. This should be considered in the clinical setting when assessing VWE in patients with an unruptured aneurysm.Acknowledgements
We are grateful for the financial and intellectual support by the Research Training Group “Materials for Brain” (GRK2154).References
- Edjlali, M. et al. Does Aneurysmal Wall Enhancement on Vessel Wall MRI Help to Distinguish Stable From Unstable Intracranial Aneurysms? Stroke 45, 3704–3706 (2014).
- Cornelissen, B. M. W. et al. Vessel wall enhancement of intracranial aneurysms: fact or artifact? Neurosurg. Focus 47, E18 (2019).
- Cornelissen, B. M. W. et al. Insufficient slow-flow suppression mimicking aneurysm wall enhancement in magnetic resonance vessel wall imaging: a phantom study. Neurosurg. Focus 47, E19 (2019).
- Qiao, Y. et al. Intracranial arterial wall imaging using three-dimensional high isotropic resolution black blood MRI at 3.0 Tesla. J. Magn. Reson. Imaging 34, 22–30 (2011).
- Wang, J., Yarnykh, V. L. & Yuan, C. Enhanced Image Quality in Black-Blood MRI by Using the Improved Motion-Sensitized Driven-Equilibrium (iMSDE) Sequence. J. Magn. Reson. Imaging JMRI 31, 1256–1263 (2010).
- Hartman, J. B. et al. Intracranial aneurysms at higher clinical risk for rupture demonstrate increased wall enhancement and thinning on multicontrast 3D vessel wall MRI. Br. J. Radiol. 92, 20180950 (2019).
- Liang, L. et al. Towards the Clinical utility of CFD for assessment of intracranial aneurysm rupture – a systematic review and novel parameter-ranking tool. J. NeuroInterventional Surg. 11, 153–158 (2019).
- Kalsoum, E. et al. Blood Flow Mimicking Aneurysmal Wall Enhancement: A Diagnostic Pitfall of Vessel Wall MRI Using the Postcontrast 3D Turbo Spin-Echo MR Imaging Sequence. Am. J. Neuroradiol. 39, 1065–1067 (2018).
Figures
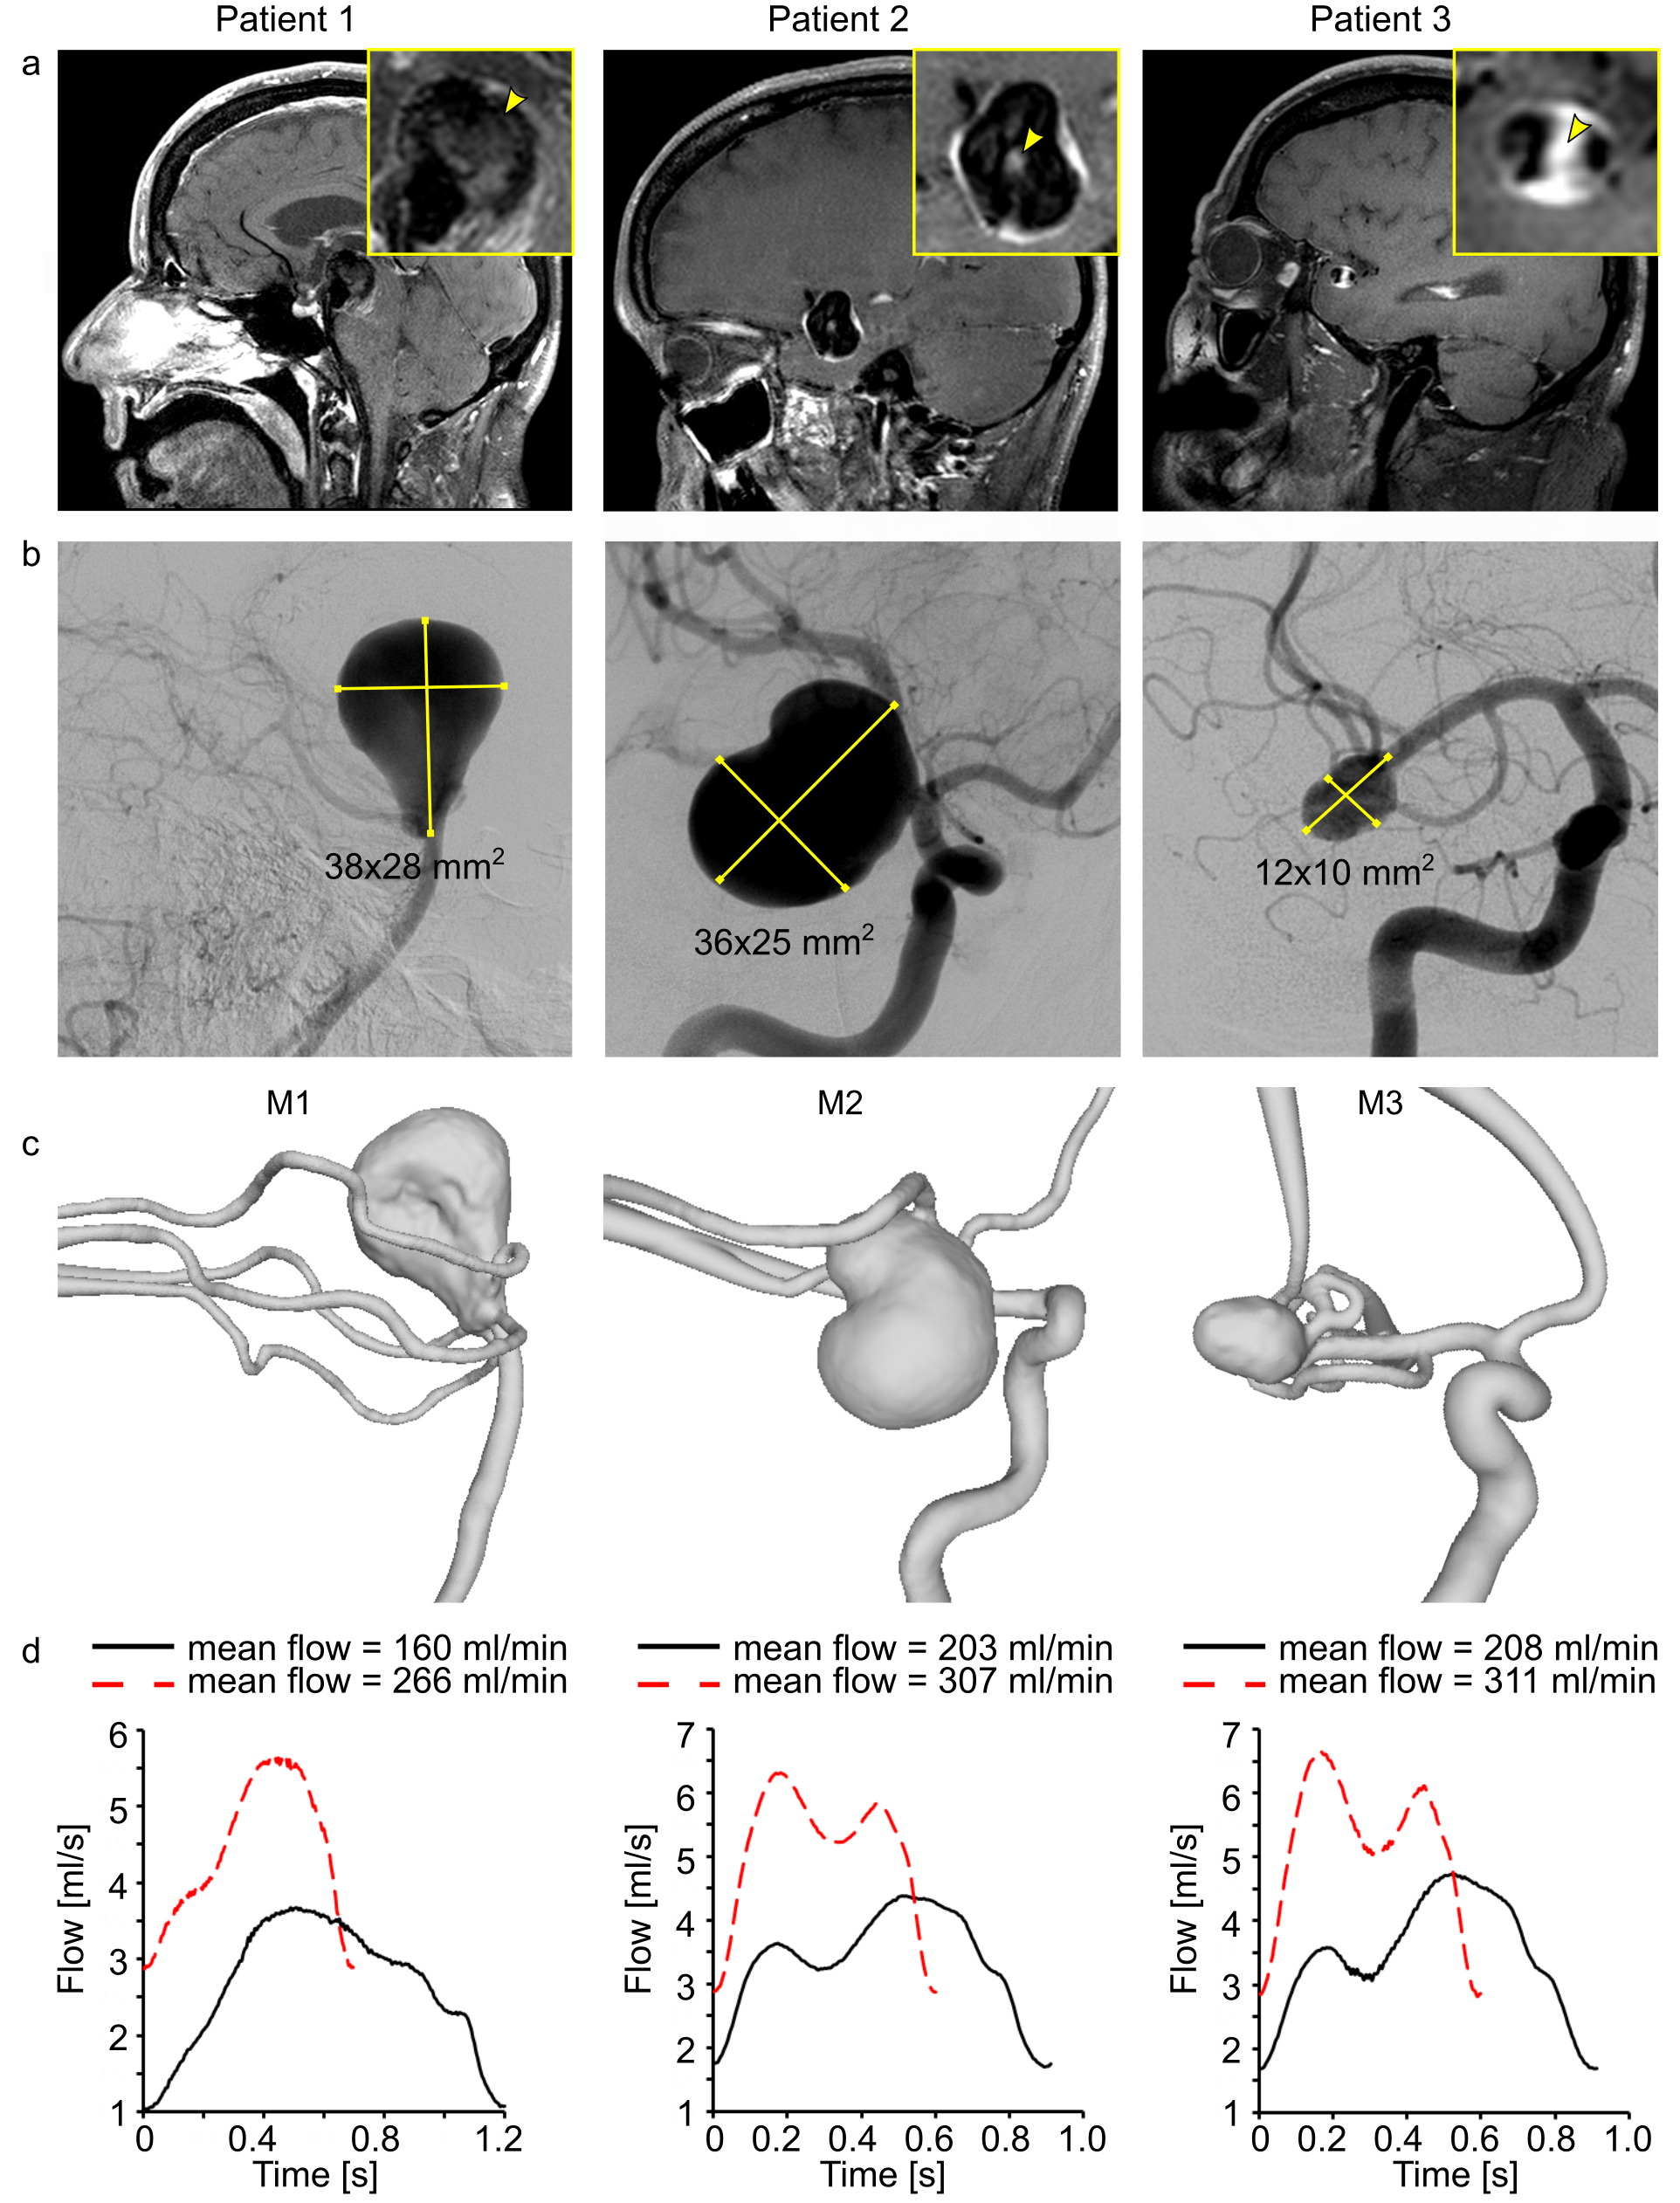
Figure 1: Black-blood MRI of patients 1–3 with intracranial
aneurysm (yellow squares, inset) with wall-adjacent and luminal (yellow arrowhead)
intra-aneurysmal signal enhancement after administering contrast agent (a),
digital subtraction angiography (b), and surface rendering of segmented lumens
(c) of intracranial arteries with aneurysms. Using these data, 3D-printed
models (M1-3) were produced and supplied with the pulsatile flow at different flow
rates and cycles, measured with a flow sensor at the model’s outlet (d).
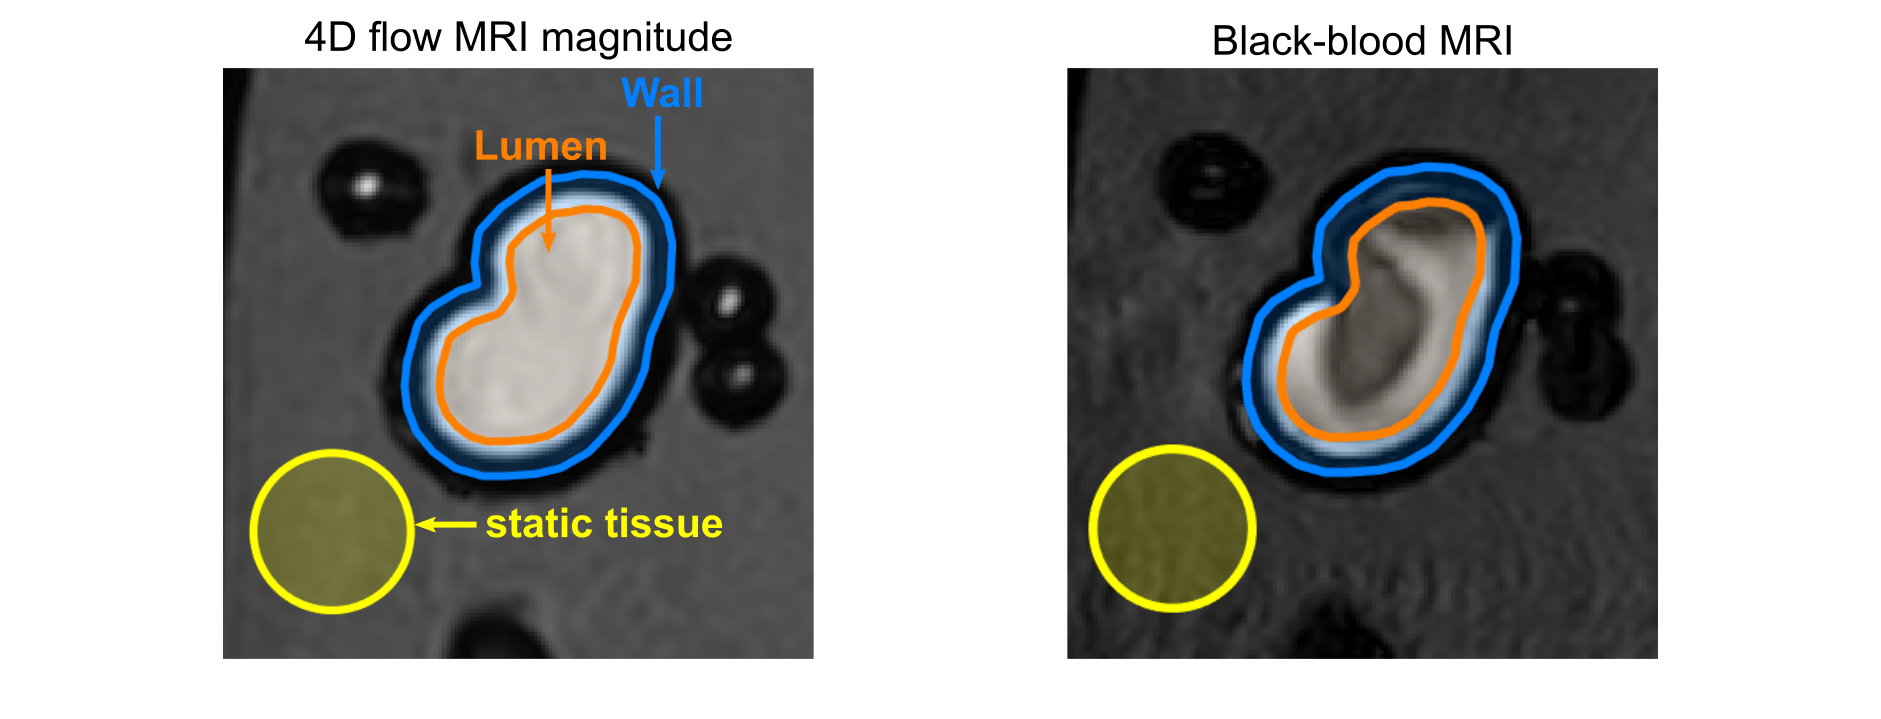
Figure
2: 4D flow magnitude MRI (left) and BB MRI (right) of model M2 with different
regions of interest (ROI). ROIs for lumen (orange), wall (orange-blue), and
static tissue (yellow) were manually created on the 4D flow magnitude images
and translated to the black-blood MRI. The BB MRI signal obtained in the lumen ROI
(orange) and wall (orange-blue) was normalized by the signal of the static
tissue (yellow) outside of the flow volume to calculate the signal enhancement
on black-blood MRI.
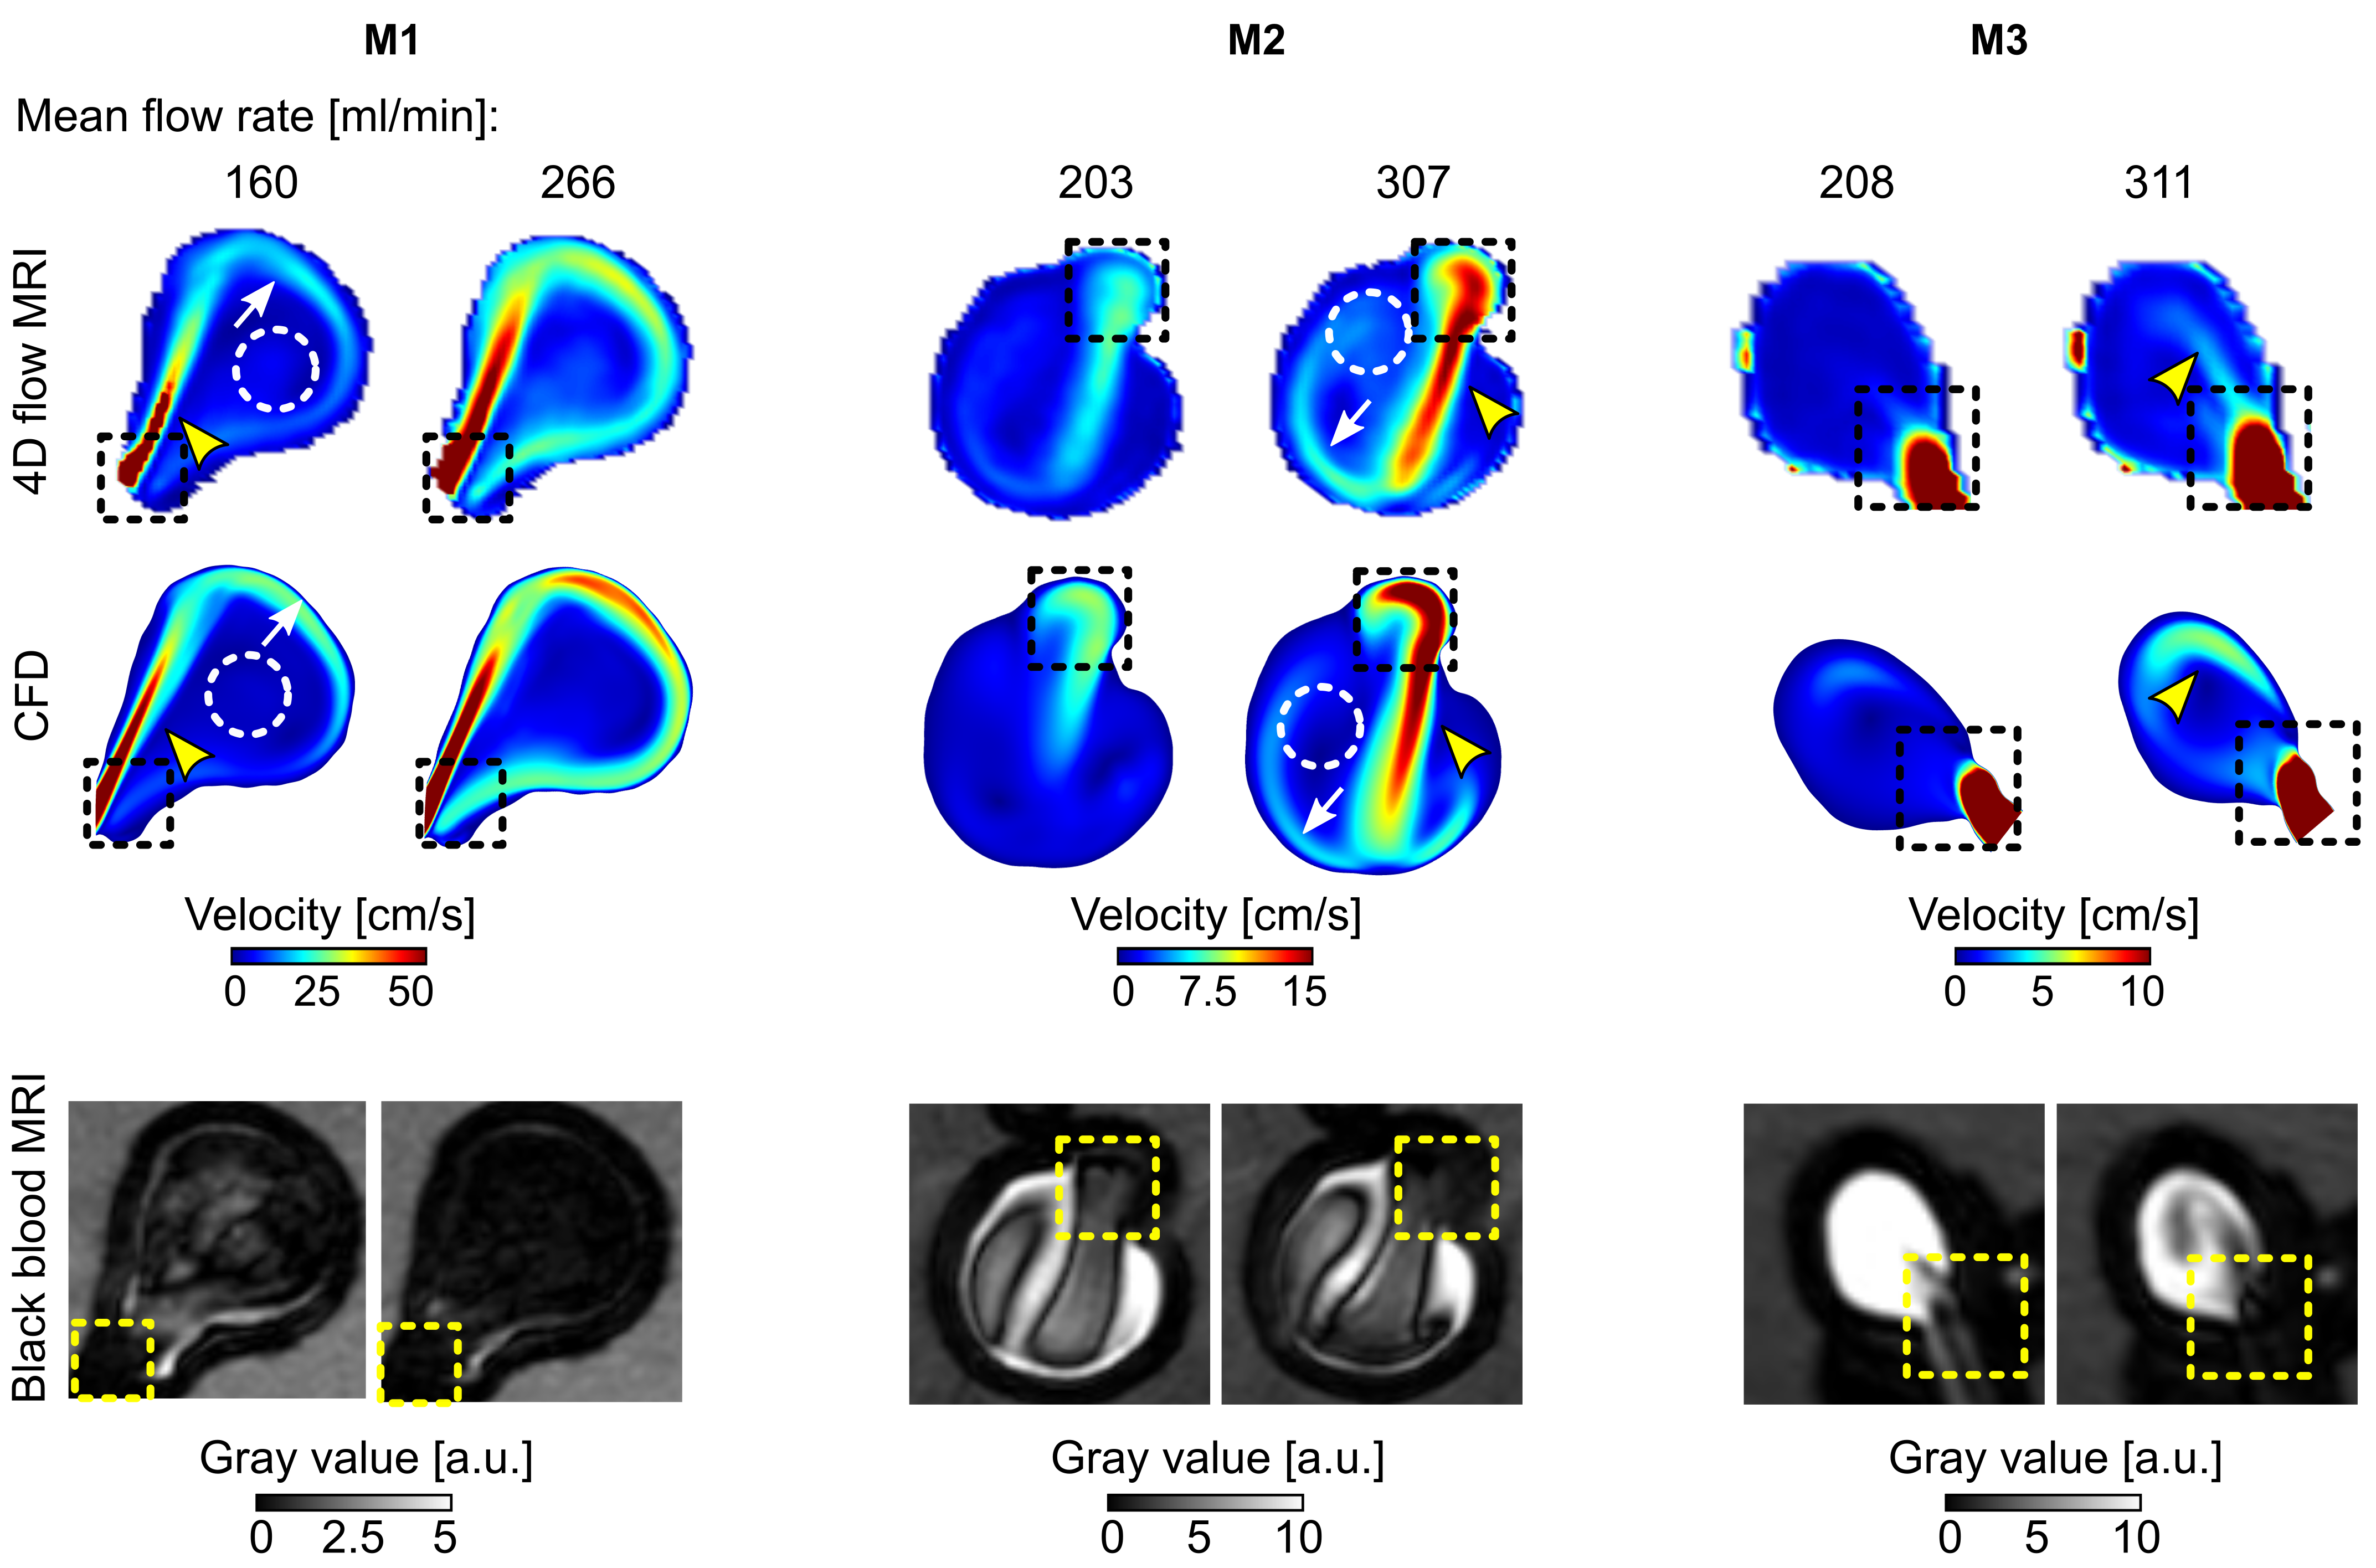
Figure
3: Time-averaged velocity magnitude acquired with 4D flow (top) and calculated with
CFD (middle) and corresponding black-blood MRI (bottom, after administering
contrast agent, with 0.7 mm3 isotropic voxel size) for M1-3. 4D flow
and CFD revealed similar flow patterns: a forward flow jet (yellow arrowheads),
reverse flow jet along the aneurysm wall (white arrows), and region of low
velocity in the center of the aneurysm (dashed circles) in M1 and M2. Areas of
high velocity were colocalized with low-signal regions on BB MRI (dashed
squares).
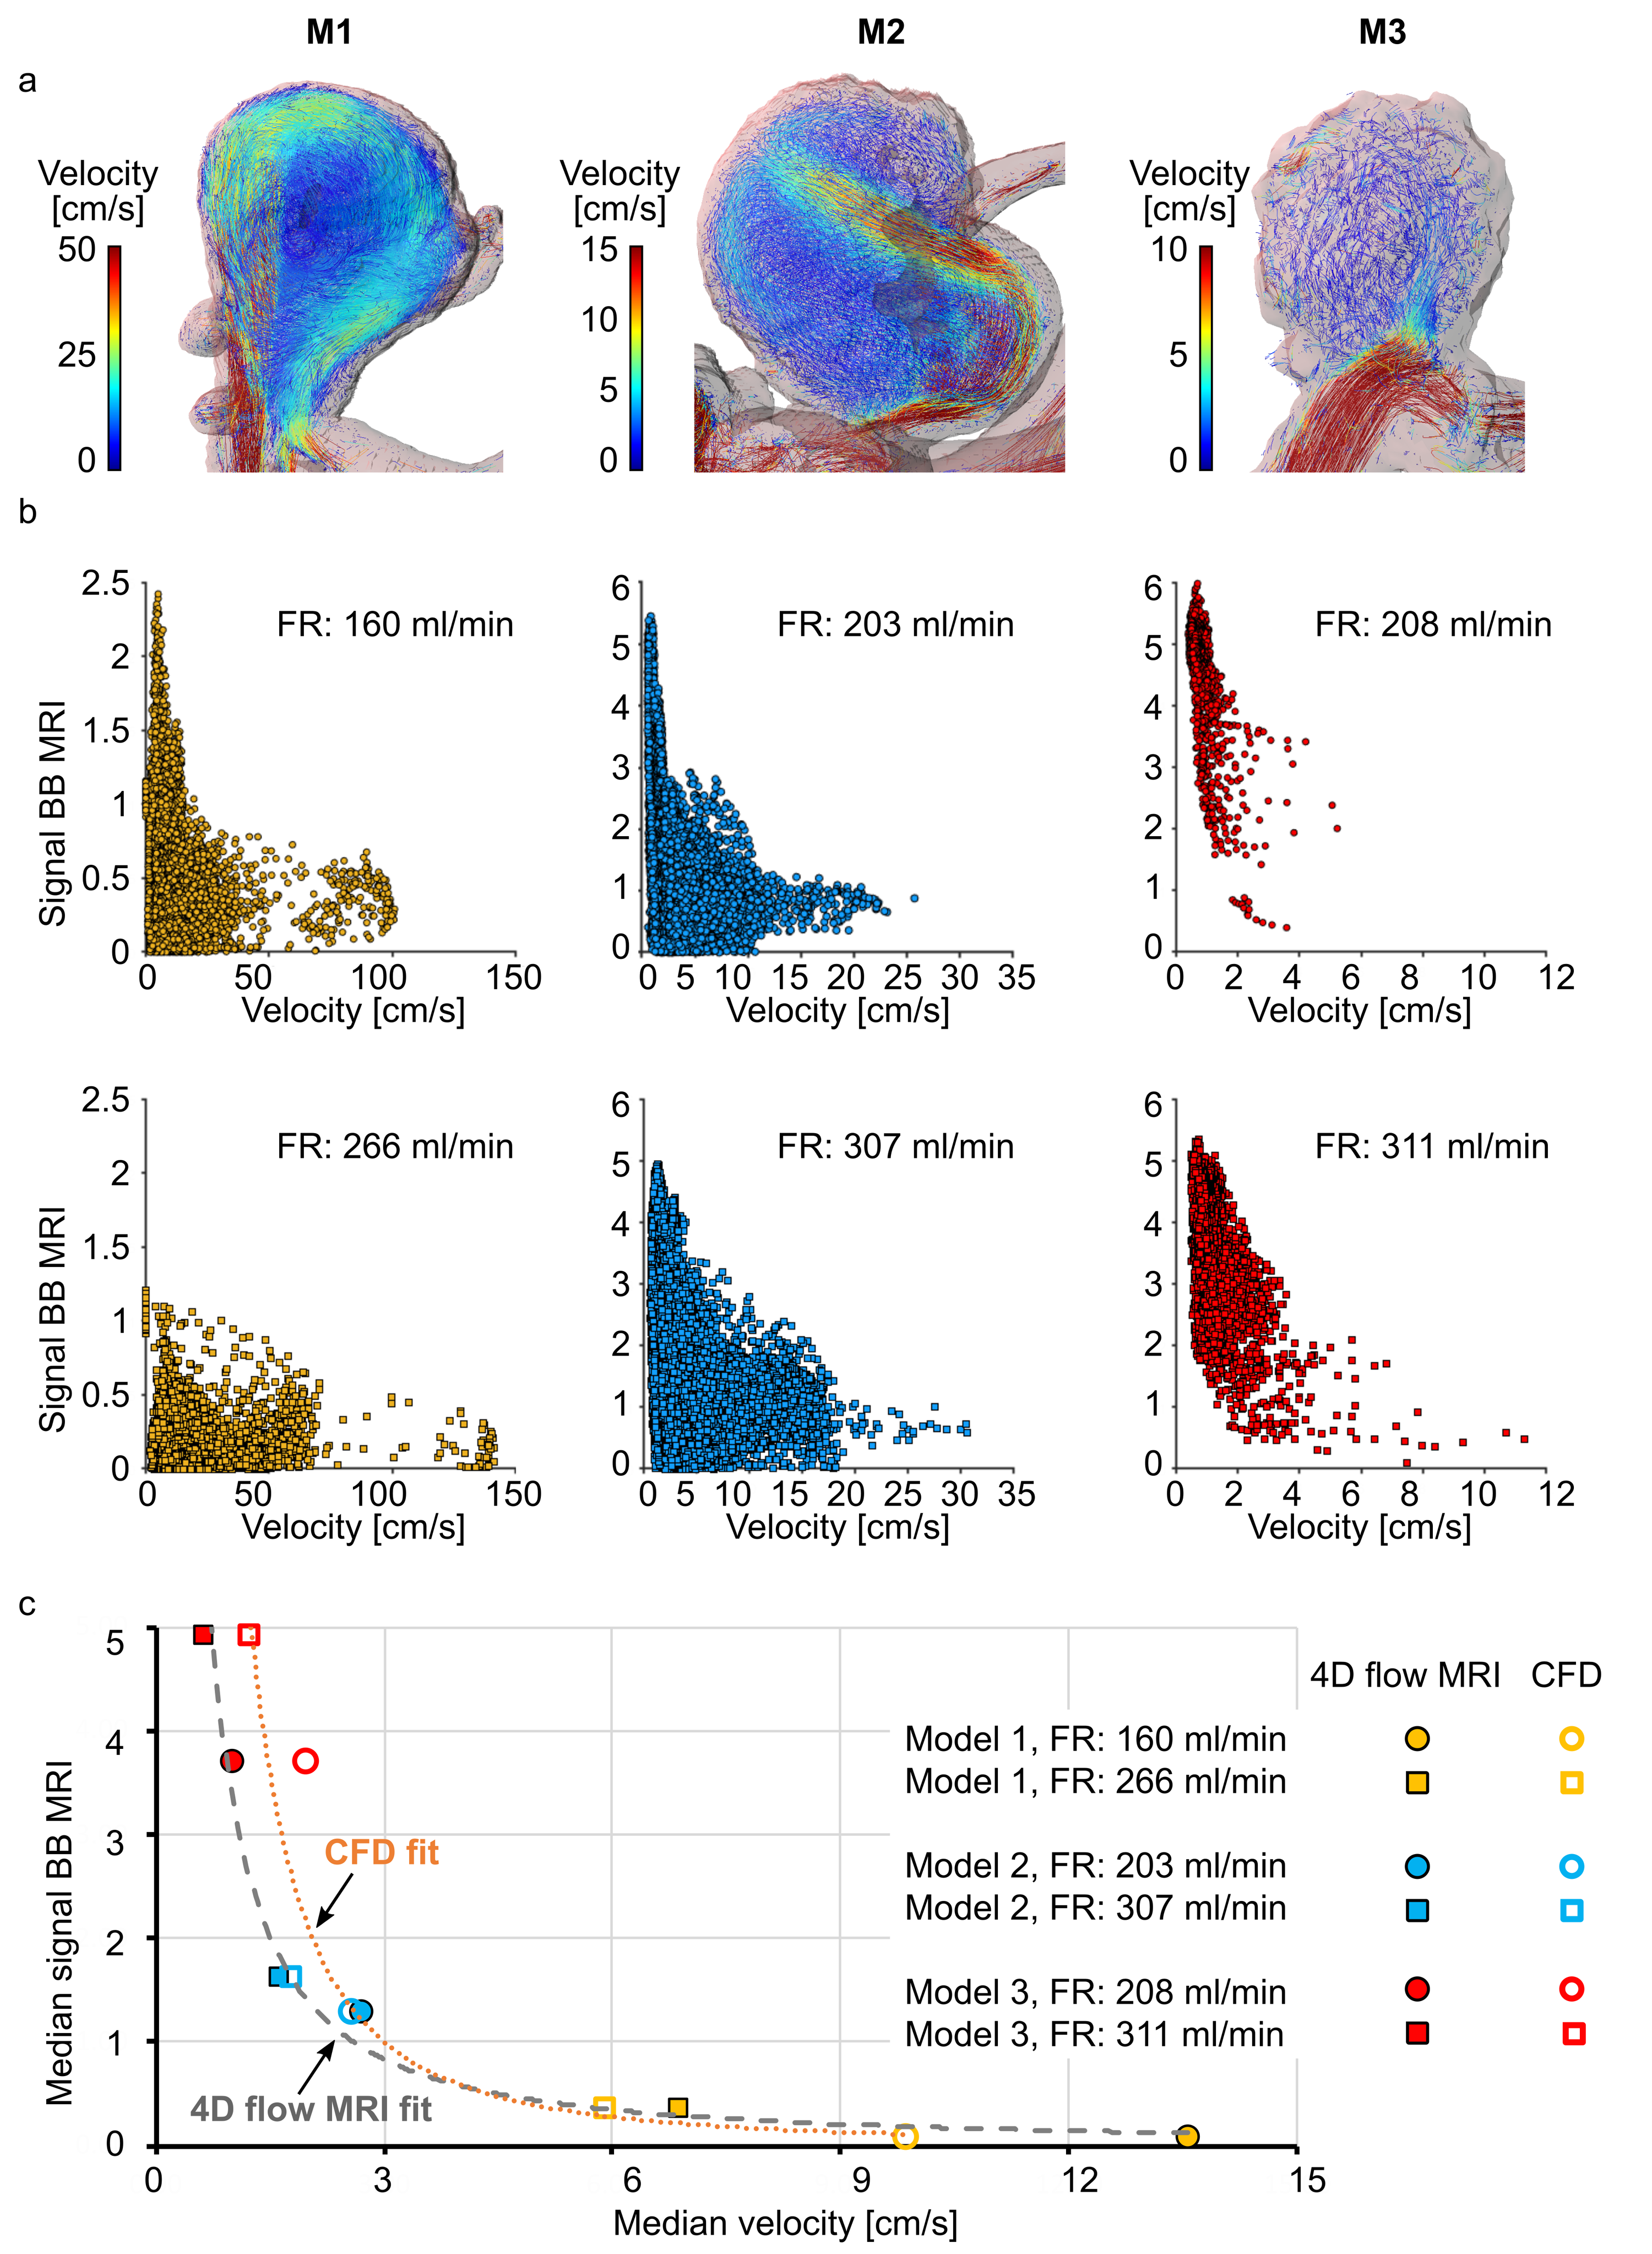
Figure 4: Flow
patterns in models M1–3 visualized by velocity pathlines; note that the
velocity scales are different for models M1–3 to magnify the flow patterns at
each geometry (a), and distribution of time-averaged velocity magnitude and
black-blood MRI signal intensities in the aneurysm lumen visualized with
scatter plots (b). Note the different scales of a and b. The median values of
time-averaged voxel-wise velocity and BB MRI signal intensities fitted with a
potential function (c). High time-averaged velocity magnitude was observed only
together with low-signal areas.
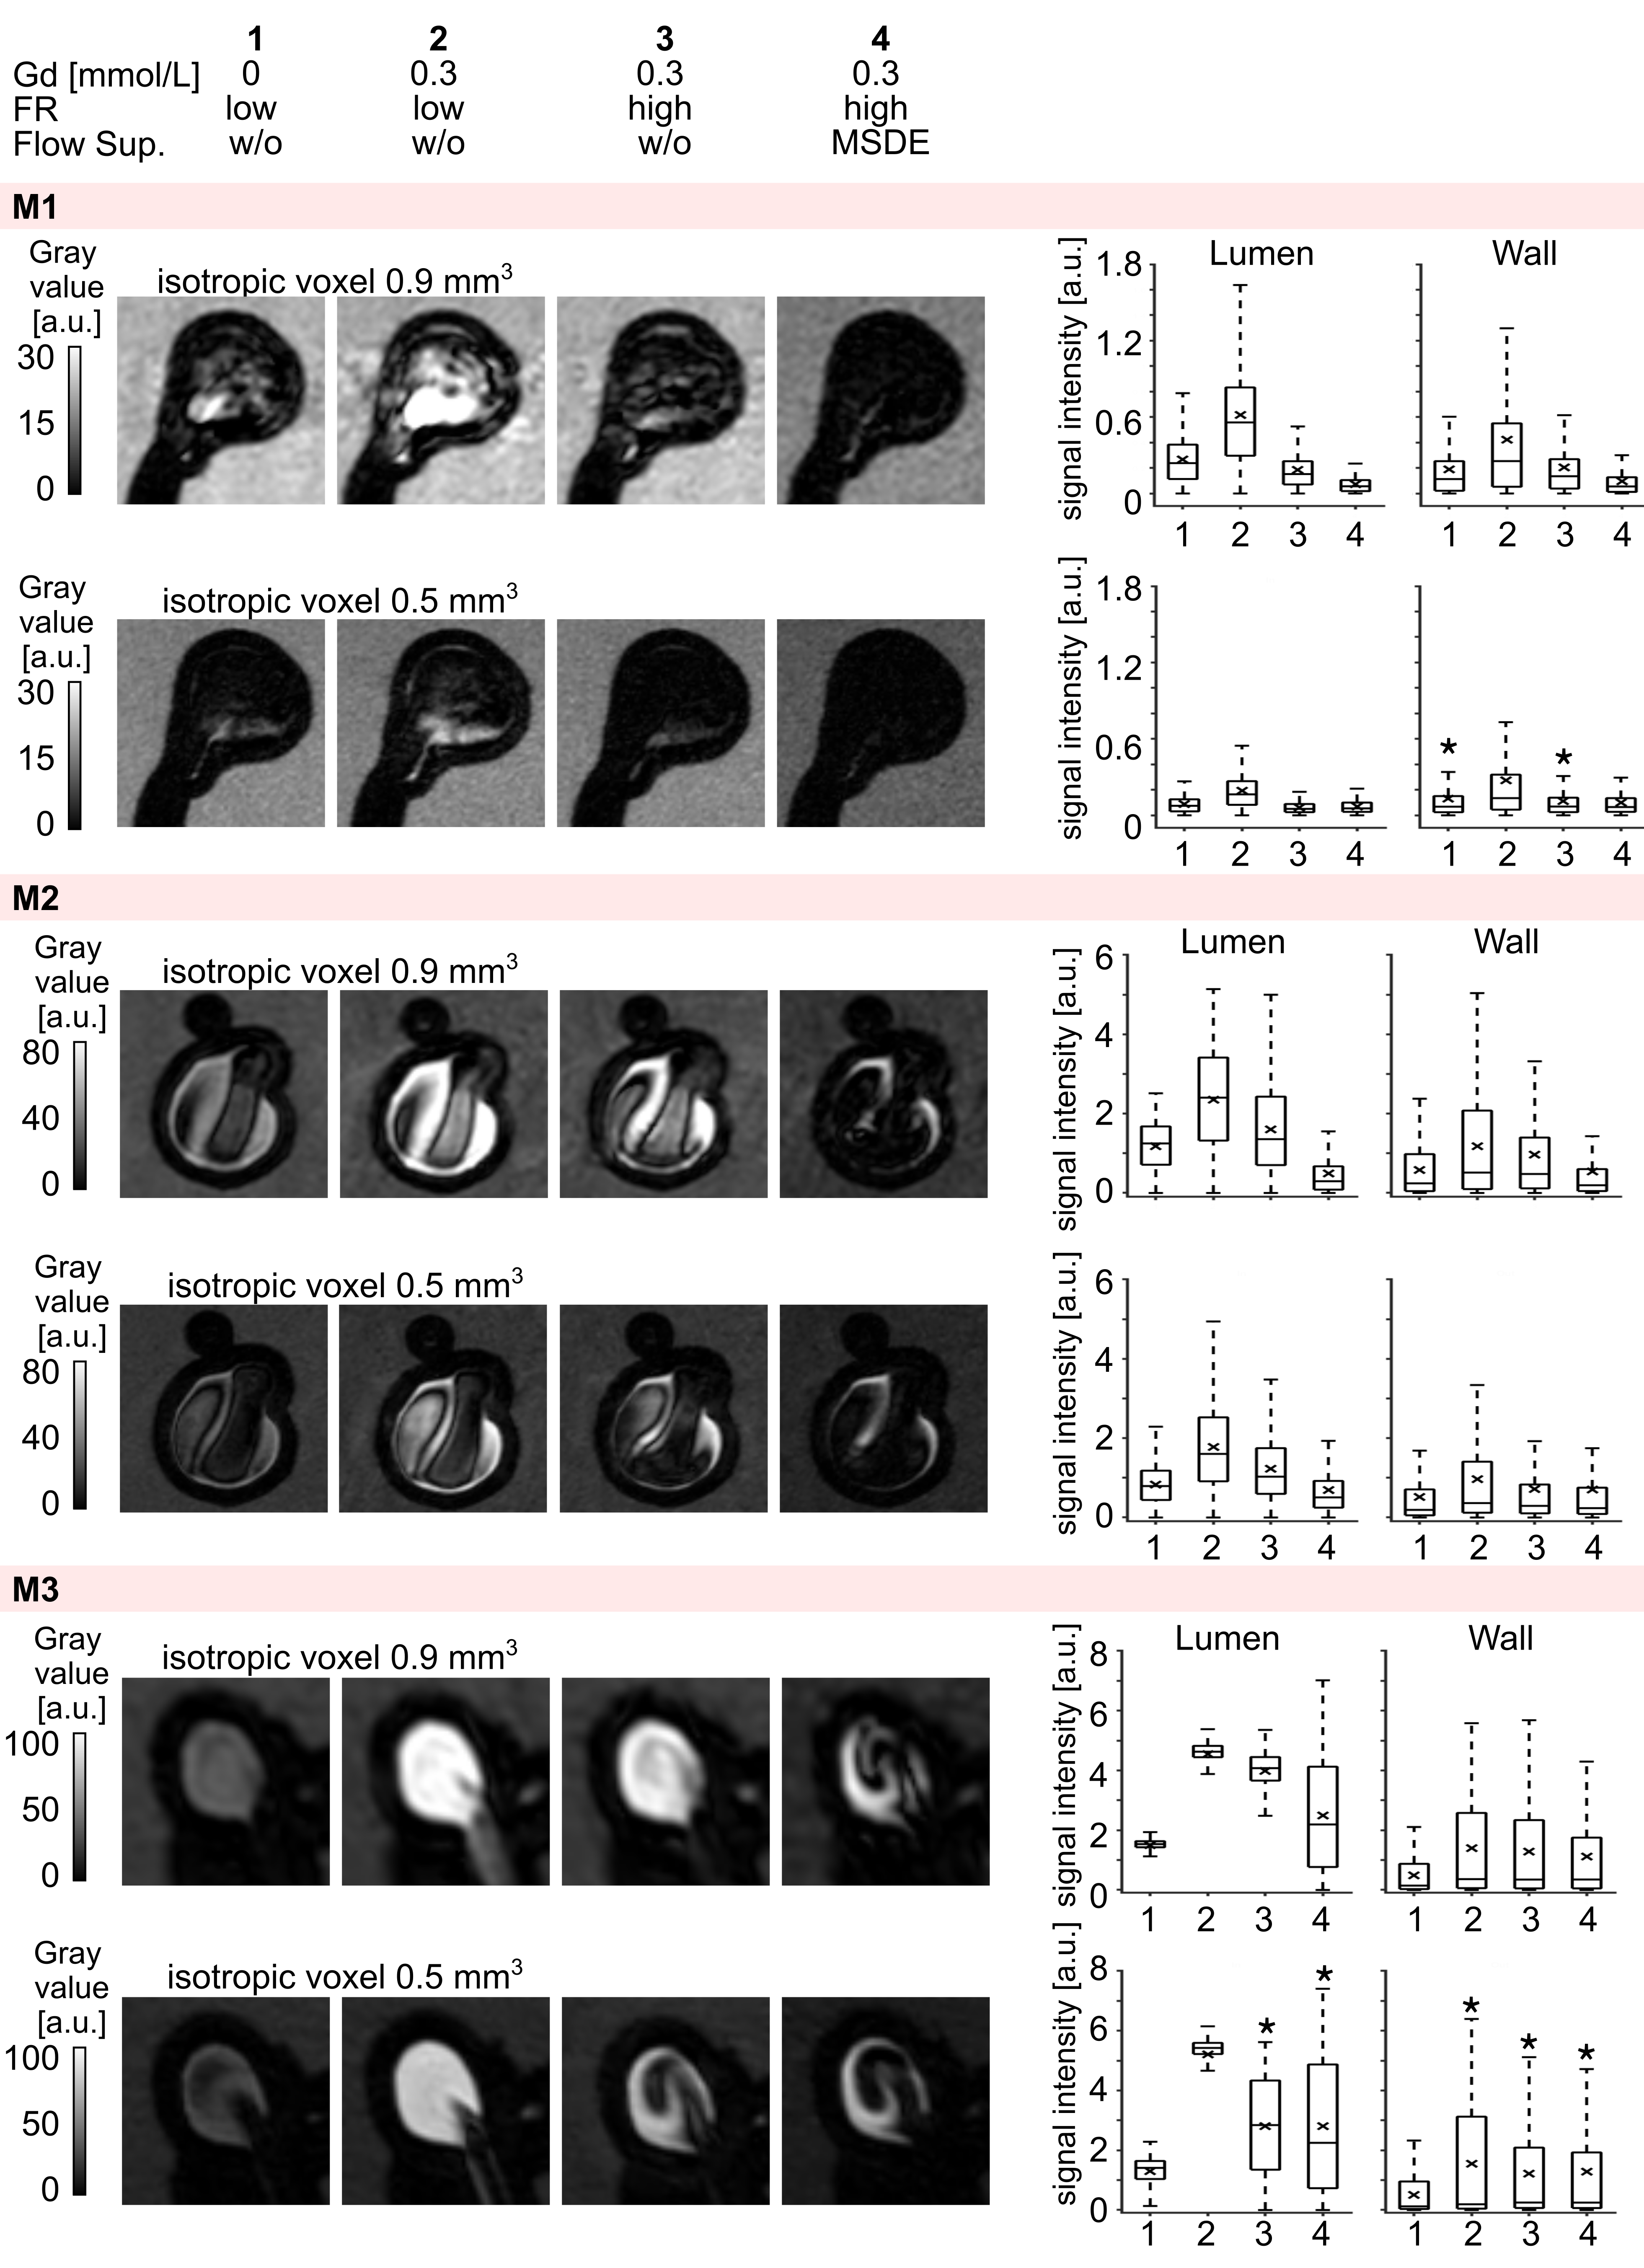
Figure 5: Black-blood
MR images of M1-3 before (1) and after (2-4) administration of contrast agent,
with low (1-2) and high (3-4) flow rates and additional flow suppression (MSDE,
4). The experiment was repeated with three voxel sizes 0.9, 0.7, and 0.5 mm3
(0.9 and 0.5 mm3 shown here). BB-signal was measured in the
lumen and at the wall. BB-signal increased when contrast agent was added and
decreased with higher flows and MSDE. The results were visualized with
boxplots, with the whiskers representing the upper and lower quartile.
Asterisks above the box indicate a p>0.01.
DOI: https://doi.org/10.58530/2022/0006